. 2019 Jul;46(7):3025-3033.
doi: 10.1002/mp.13576. Epub 2019 May 31.

Performance evaluation of the 5-Ring GE Discovery MI PET/CT system using the national electrical manufacturers association NU 2-2012 Standard

Affiliations

Performance evaluation of the 5-Ring GE Discovery MI PET/CT system using the national electrical manufacturers association NU 2-2012 Standard

Tinsu Pan et al. Med Phys. 2019 Jul.

Abstract

The GE Discovery MI PET/CT system has a modular digital detector design allowing three, four, or five detector block rings that extend the axial field-of-view (FOV) from 15 to 25 cm in 5 cm increments. This study investigated the performance of the 5-ring system and compared it to 3- and 4-ring systems; the GE Discovery IQ system that uses conventional photomultiplier tubes; and the GE Signa PET/MR system that has a reduced transaxial FOV.

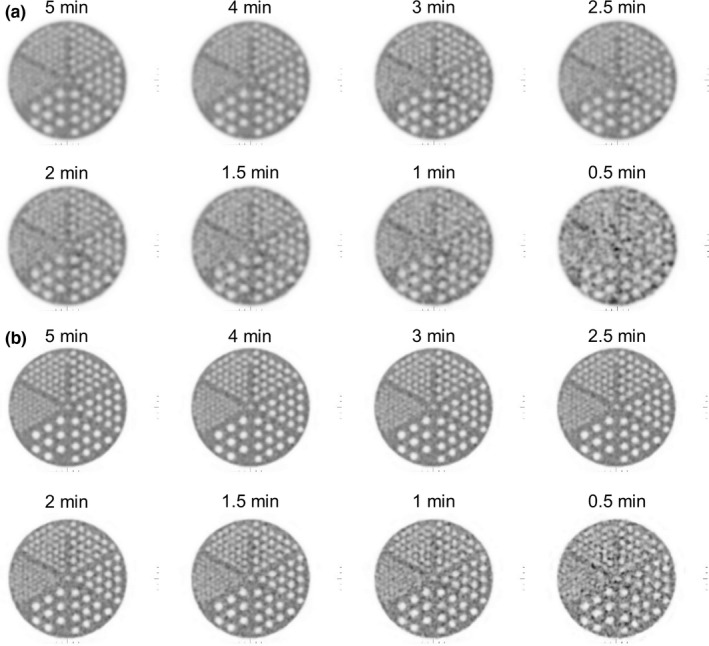
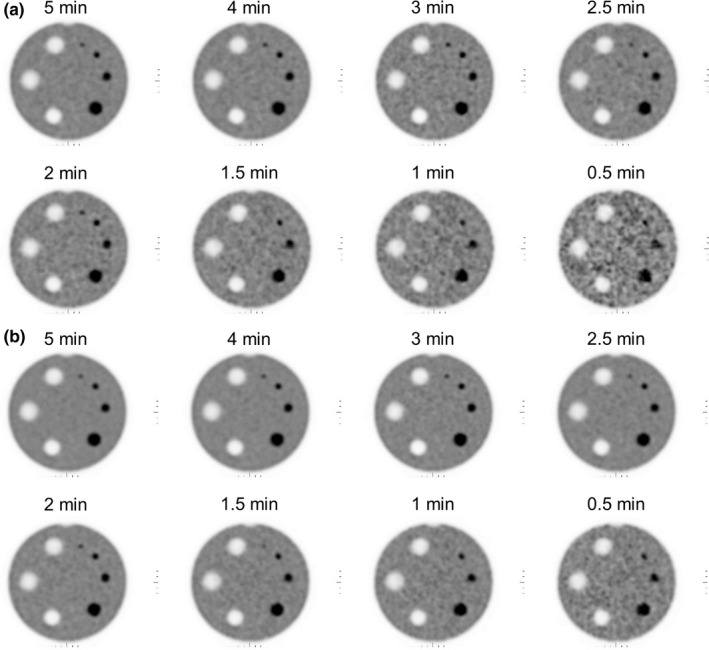
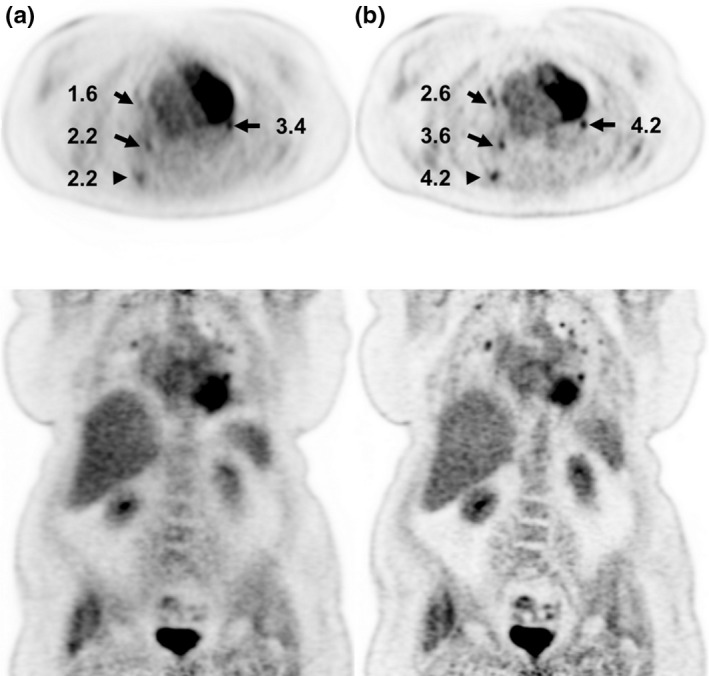
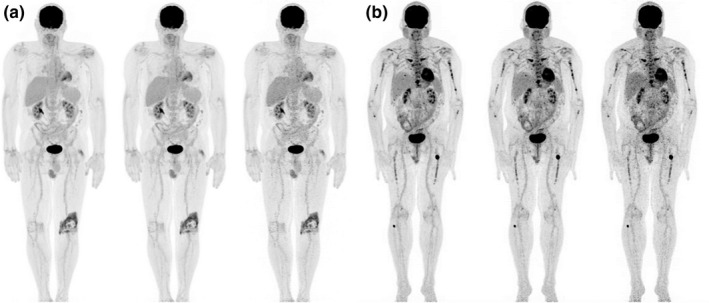
Methods: PET performance was evaluated at three different institutions. Spatial resolution, sensitivity, counting rate performance, accuracy, and image quality were measured in accordance with National Electrical Manufacturers Association NU 2-2012 standards. The mean energy resolution, mean timing resolution, and PET/CT subsystem alignment were also measured. Phantoms were used to determine the effects of varying acquisition time and reconstruction parameters on image quality. Retrospective patient scans were reconstructed with various scan durations to evaluate the impact on image quality.

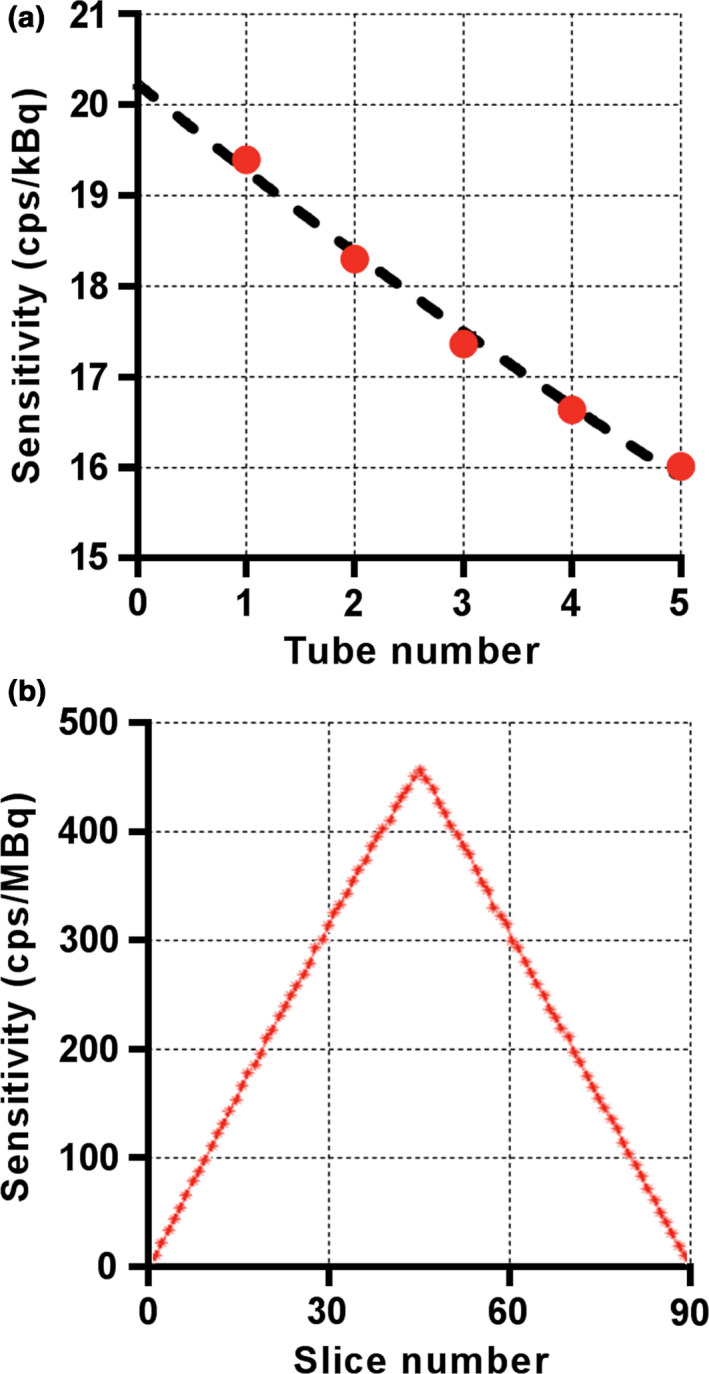
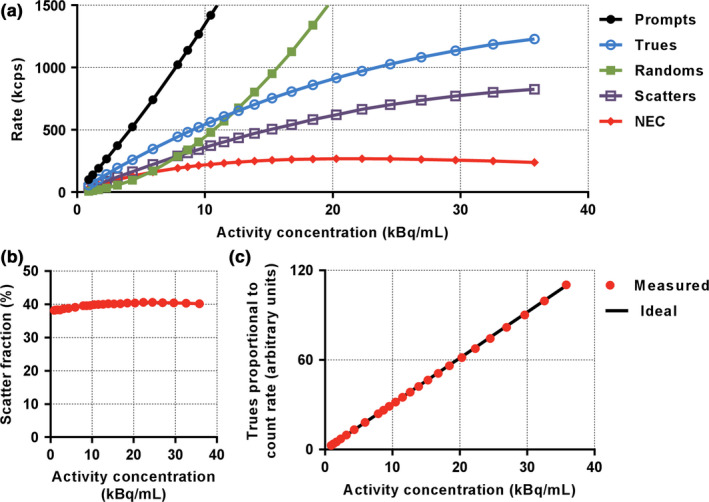
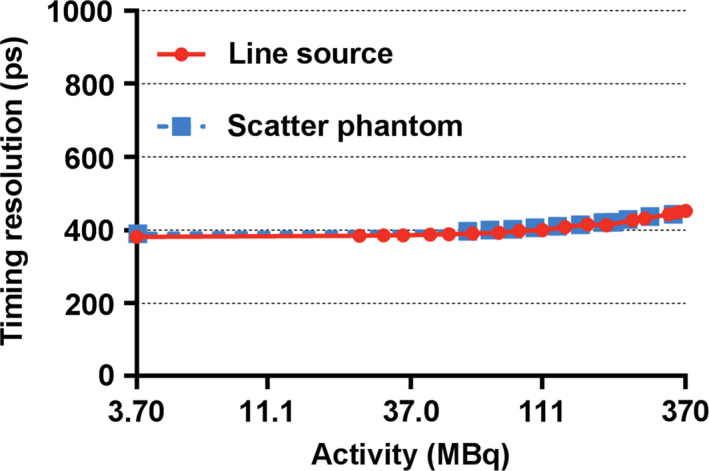
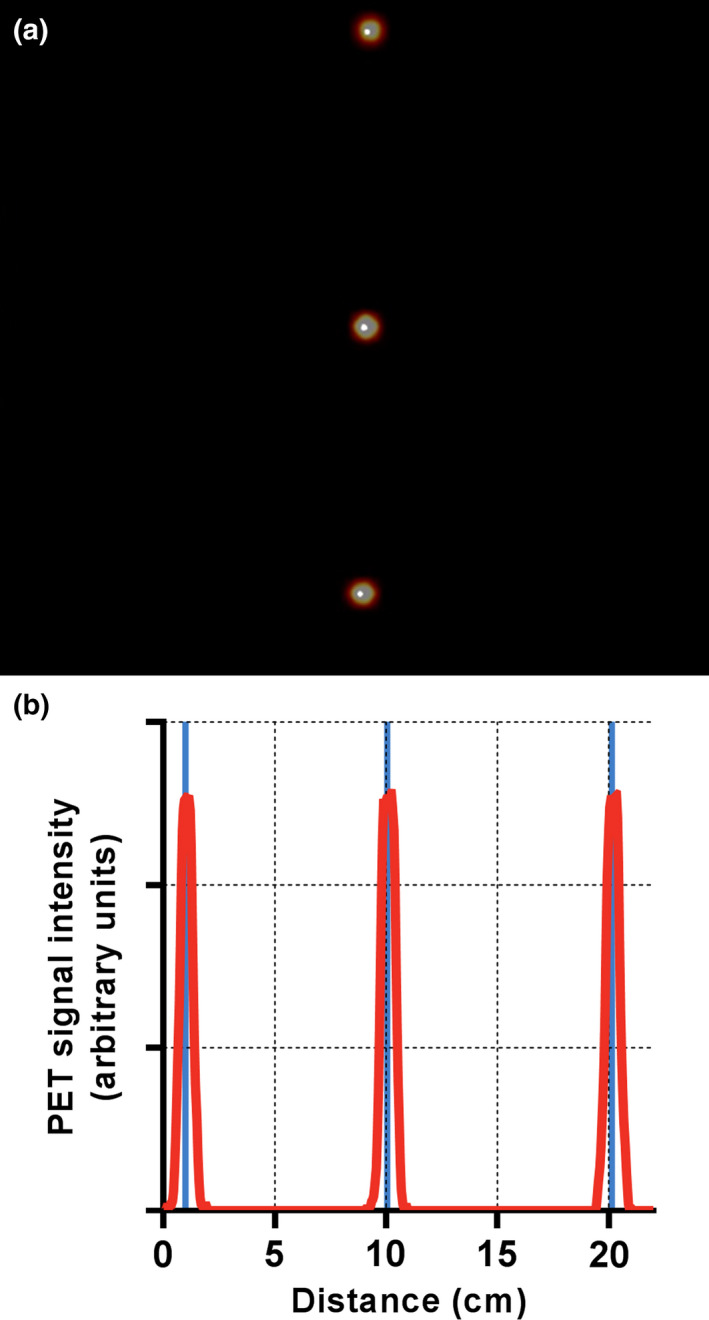
Results: Results from all three institutions were similar. Radial/tangential/axial full width at half maximum spatial resolution measurements using the filtered back projection algorithm were 4.3/4.3/5.0 mm, 5.5/4.6/6.5 mm, and 7.4/5.0/6.6 mm at 1, 10, and 20 cm from the center of the FOV, respectively. Measured sensitivity at the center of the FOV (20.84 cps/kBq) was significantly higher than systems with reduced axial FOV. The peak noise-equivalent counting rate was 266.3 kcps at 20.8 kBq/ml, with a corresponding scatter fraction of 40.2%. The correction accuracy for count losses up to the peak noise-equivalent counting rate was 3.6%. For the 10-, 13-, 17-, 22-, 28-, and 37-mm spheres, contrast recoveries in the image quality phantom were measured to be 46.2%, 54.3%, 66.1%, 71.1%, 85.3%, and 89.3%, respectively. The mean energy and timing resolution were 9.55% and 381.7 ps, respectively. Phantom and patient images demonstrated excellent image quality, even at short acquisition times or low injected activity.

Conclusion: Compared to other PET/CT models, the extended axial FOV improved the overall PET performance of the 5-ring GE Discovery MI scanner. This system offers the potential to reduce scan times or injected activities through increased sensitivity.

Keywords: Discovery MI-5 ring scanner; NEMA NU 2; PET/CT; instrumentation; performance characterization.


Conflict of interest statement

The authors have no financial conflicts of interest related to the material presented in this article.

Figures

Figure 1
Figure 1
Representative results of NEMA sensitivity testing on one 5‐ring Discovery MI scanner (MD Anderson). Sensitivity was measured by successively increasing attenuation with five aluminum tubes (a) and the axial sensitivity profile was generated for individual slices (b). Results are shown for a radial offset of 0 cm. [Color figure can be viewed at wileyonlinelibrary.com]
Figure 2
Figure 2
Representative results of NEMA performance testing on one 5‐ring Discovery MI scanner (MD Anderson). Figure shows results for counting rate performance (a), scatter fraction as a function of activity concentration (b), and accuracy (c). NEC, noise‐equivalent counting. [Color figure can be viewed at wileyonlinelibrary.com]
Figure 3
Figure 3
Discovery MI PET timing resolution as a function of source activity (natural log scale). Increased activities resulted in inferior timing resolution, as expected. [Color figure can be viewed at wileyonlinelibrary.com]
Figure 4
Figure 4
Results from the PET/CT co‐registration test indicated excellent alignment. The distance between the PET and CT centroids was negligible for all sources on both the fused image (a) and the PET signal profile through the center of the image (b). Within the profile of PET signal, the solid vertical lines denote the center of the CT signal centroids. [Color figure can be viewed at wileyonlinelibrary.com]
Figure 5
Figure 5
Reconstructed images of the ACR spatial resolution module. Five and six sections were visible on the (a) OSEM and (b) Q. Clear images, respectively, from 1.5 to 5 min/bed.
Figure 6
Figure 6
Images of the ACR contrast module reconstructed with (a) OSEM and (b) Q.Clear. All four high‐contrast cylinders were visible for the images of 2 to 5 min/bed. Q.Clear images were less noisy and exhibited better low‐contrast detectability.
Figure 7
Figure 7
Patient images from a 76‐year‐old female (BMI = 42) with injection activity of 429 MBq (11.6 mCi) and uptake time of 64 min. Images are reconstructed without (a) and with (b) time‐of‐flight (TOF) correction with 3 min per bed. Numbers indicate lesion standardized uptake value (SUV).
Figure 8
Figure 8
Representative patient maximum intensity projections reconstructed with time‐of‐flight corrections. (a) Patient (BMI = 28) with injection activity of 405 MBq (11 mCi) and uptake time of 68 min. The total acquisition times were 23, 14 and 7 min from left to right corresponding to 3, 2 and 1 min/bed, respectively, for 5 beds from head to mid‐thigh and 2, 1 and 0.5 min/bed, respectively, for 4 beds over the legs. (b) Patient (BMI = 27) with injection activity of 104 MBq (2.8 mCi) and uptake time of 72 min. The images from left to right were 3, 2, and 1 min/bed for 9 beds for a total scan time of 27, 18 and 9 min, respectively.

References

    1. Surti S, Karp JS. Advances in time‐of‐flight PET. Phys Medica. 2016;32:12–22. - PMC - PubMed
    1. Alessio AM, Stearns CW, Tong Shan, et al. Application and Evaluation of a measured spatially variant system model for PET image reconstruction. IEEE Trans Med Imaging. 2010;29:938–949. - PMC - PubMed
    1. MacDonald LR, Harrison RL, Alessio AM, Hunter WCJ, Lewellen TK, Kinahan PE. Effective count rates for PET scanners with reduced and extended axial field of view. Phys Med Biol. 2011;56:3629–3643. - PMC - PubMed
    1. Schatka I, Weiberg D, Reichelt S, et al. A randomized, double‐blind, crossover comparison of novel continuous bed motion versus traditional bed position whole‐body PET/CT imaging. Eur J Nucl Med Mol Imaging. 2016;43:711–717. - PubMed
    1. van der Vos CS, Koopman D, Rijnsdorp S, et al. Quantification, improvement, and harmonization of small lesion detection with state‐of‐the‐art PET. Eur J Nucl Med Mol Imaging. 2017;44:4–16. - PMC - PubMed

MeSH terms