. 2019 May 1;60(6):2012-2022.
doi: 10.1167/iovs.19-26571.

Multimodal Imaging in Best Vitelliform Macular Dystrophy

Affiliations

Multimodal Imaging in Best Vitelliform Macular Dystrophy

Jose Ronaldo Lima de Carvalho Jr et al. Invest Ophthalmol Vis Sci. .

Abstract

Purpose: In patients diagnosed with Best vitelliform macular dystrophy (BVMD), quantitative fundus autofluorescence (qAF), near-infrared fundus autofluorescence (NIR-AF), and spectral-domain optical coherence tomography (SD-OCT) were used to elucidate pathogenic mechanisms.

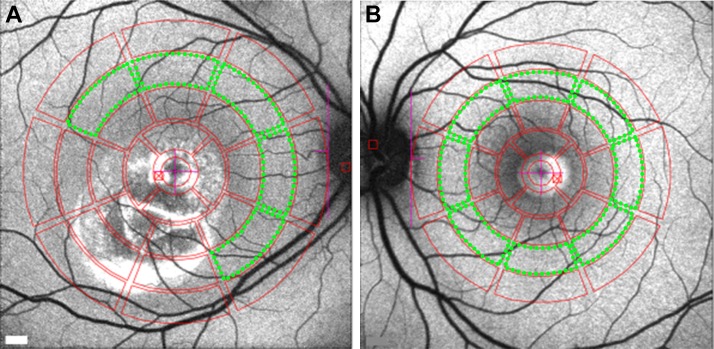
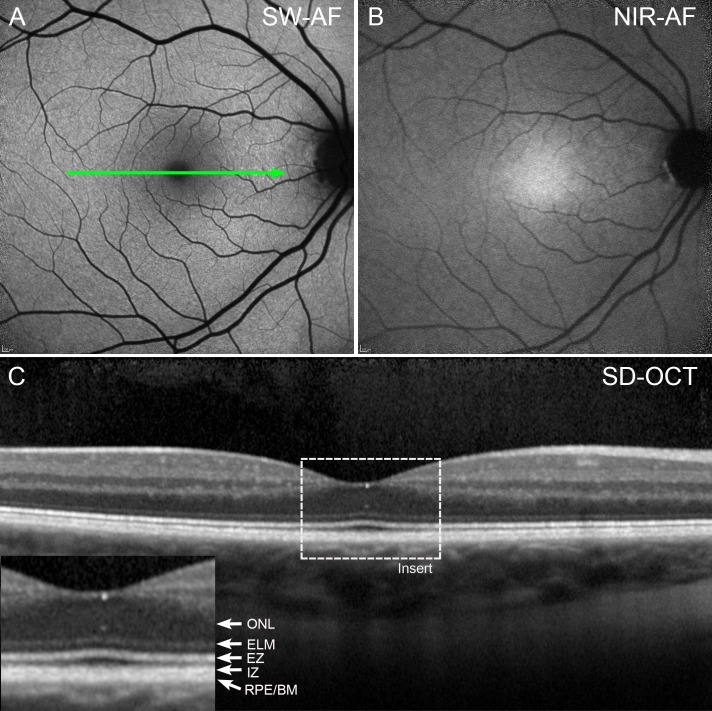
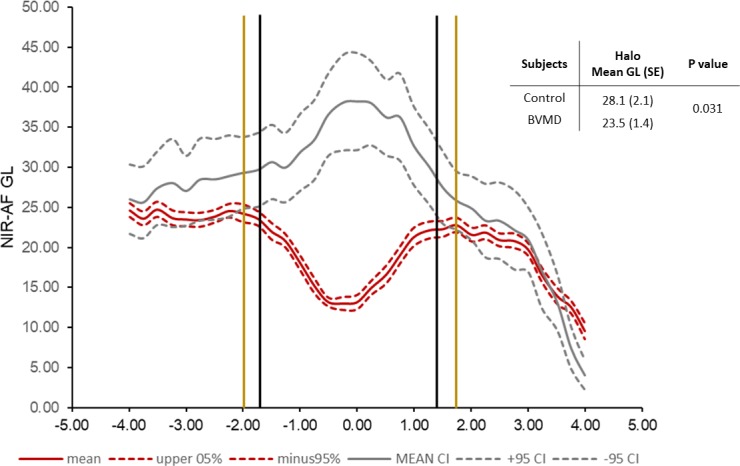
Methods: Fourteen patients heterozygous for BEST1 mutations were recruited. qAF was analyzed using short-wavelength fundus autofluorescence (SW-AF) images. Mean gray levels (GL) were determined in nonlesion areas (7 to 9° eccentricity) and adjusted by GL measured in an internal fluorescent reference. NIR-AF images (787 nm; sensitivity of 96) were captured and saved in non-normalized mode. Horizontal SD-OCT images also were acquired and BVMD was staged according to the OCT findings.

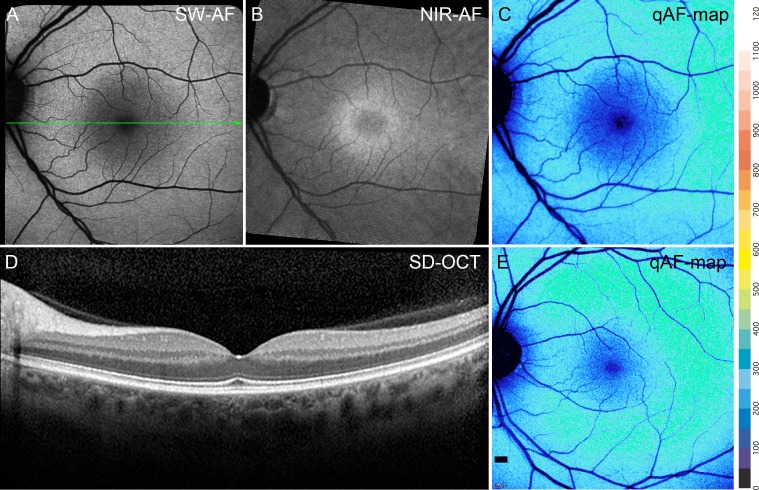
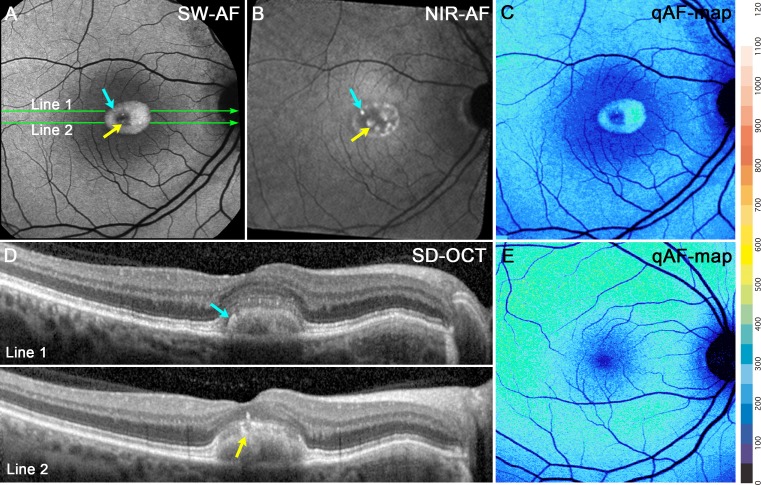
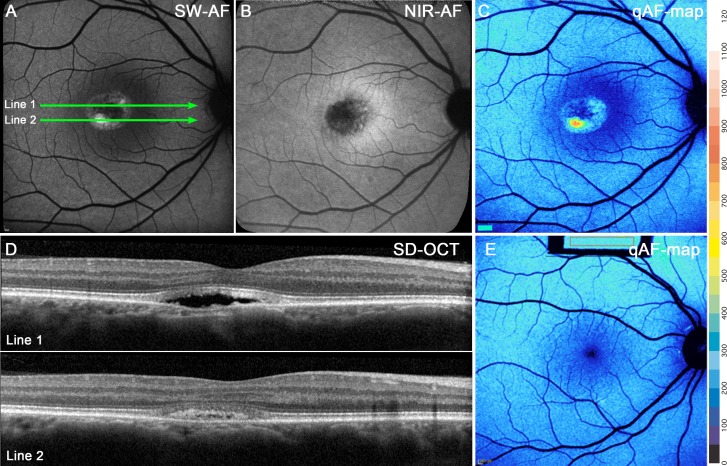
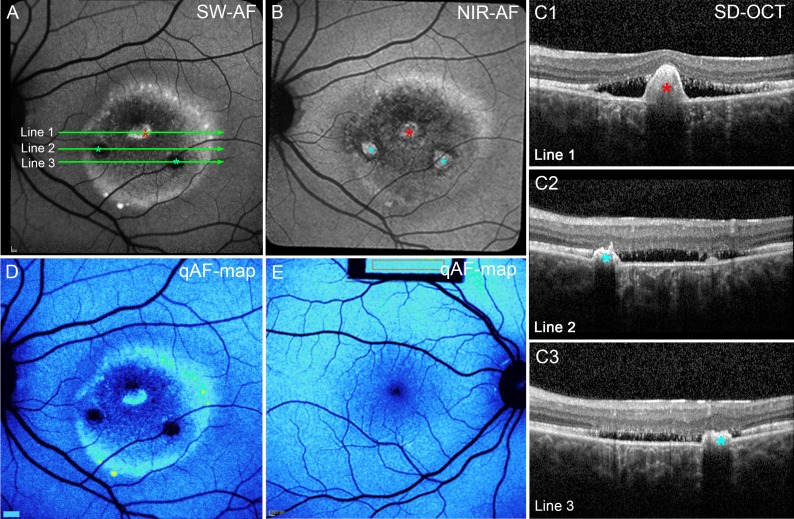
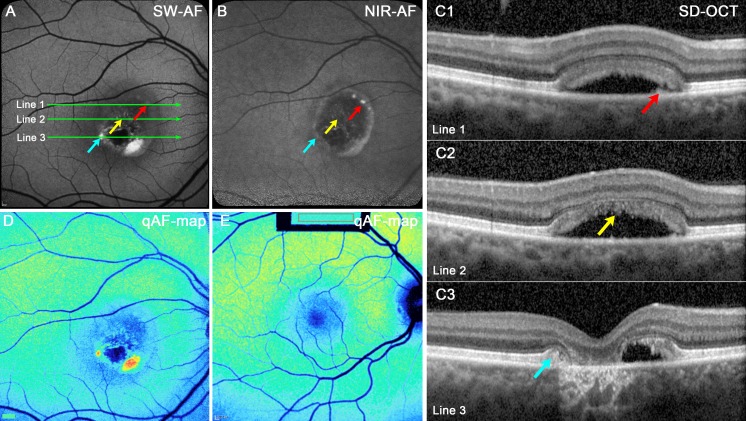
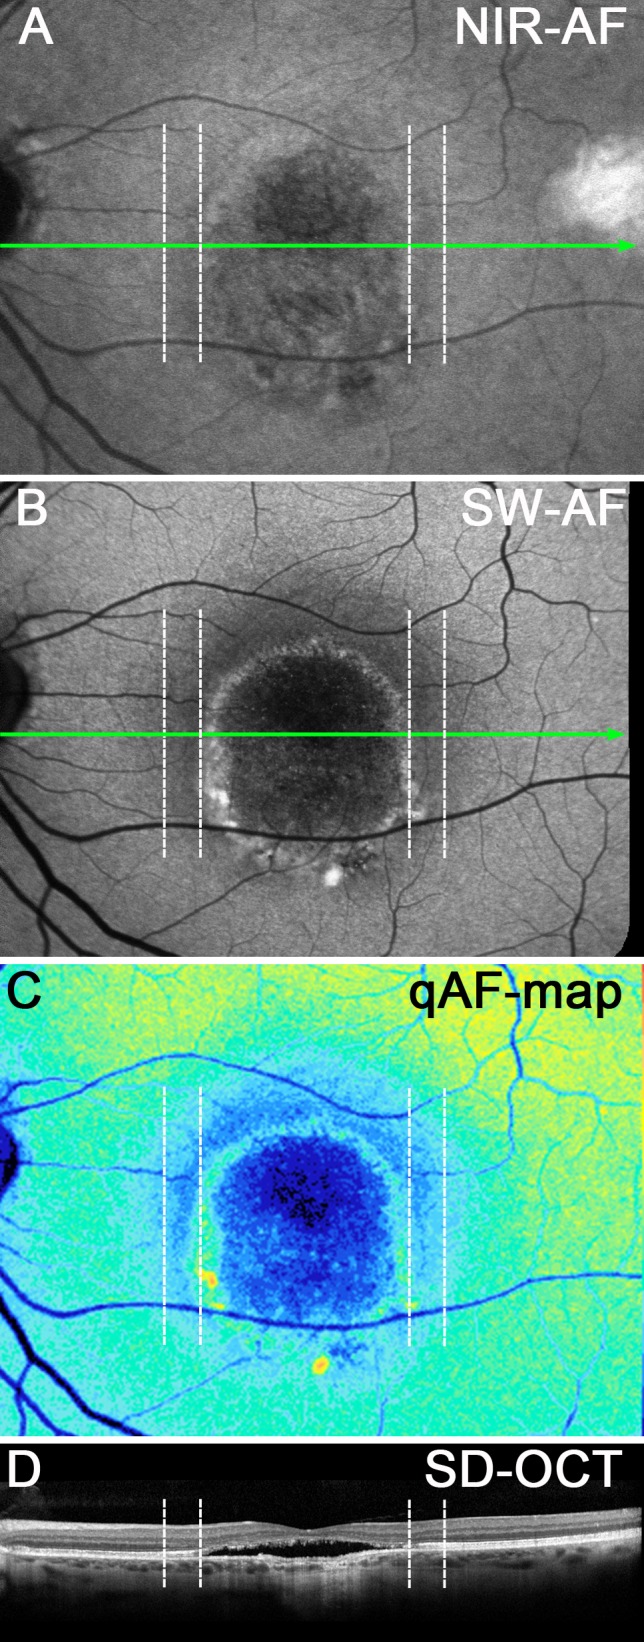
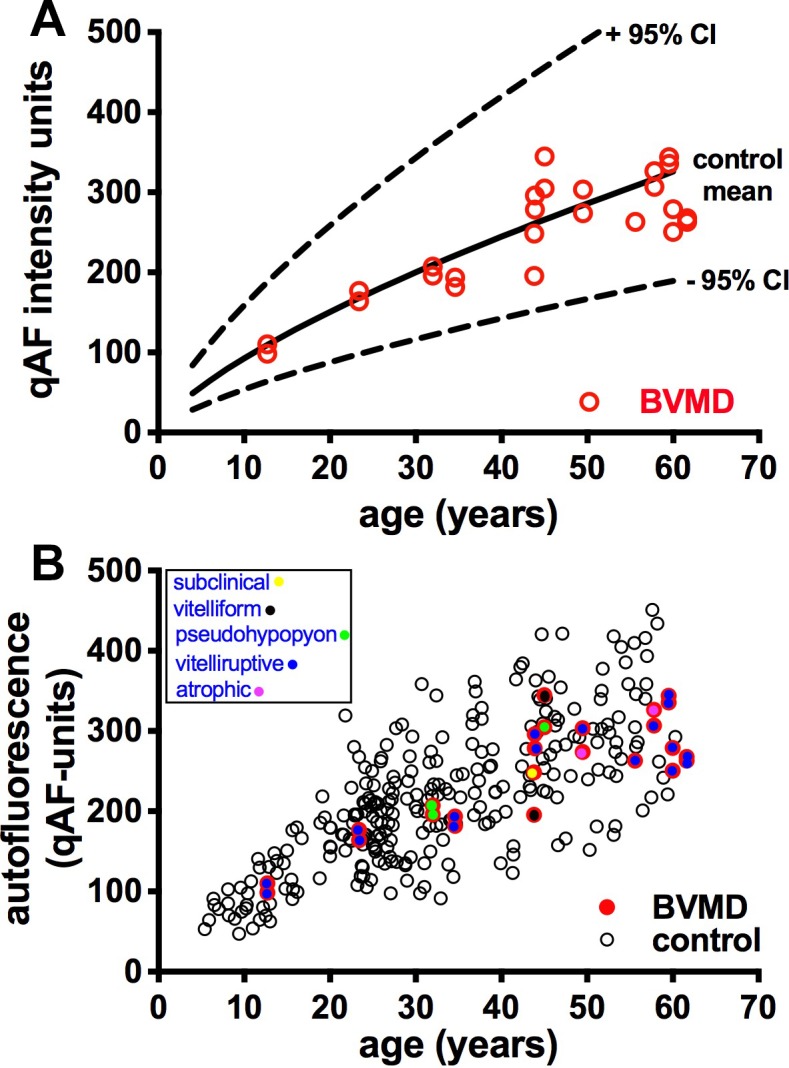
Results: In the pre-vitelliform stage, NIR-AF imaging revealed an area of reduced fluorescence, whereas in the vitelliruptive stage, puncta of elevated NIR-AF signal were present. In both SW-AF and NIR-AF images, the vitelliform lesion in the atrophic stage was marked by reduced signal. At all stages of BVMD, nonlesion qAF was within the 95% confidence intervals for healthy eyes. Similarly, the NIR-AF intensity measurements outside the vitelliform lesion were comparable to the healthy control eye. SD-OCT scans revealed a fluid-filled detachment between the ellipsoid zone and the hyperreflectivity band attributable to RPE/Bruch's membrane.

Conclusions: NIR-AF imaging can identify the pre-vitelliform stage of BVMD. Mutations in BEST1 are not associated with increased levels of SW-AF outside the vitelliform lesion. Elevated SW-AF within the fluid-filled lesion likely reflects the inability of RPE to phagocytose outer segments due to separation of RPE from photoreceptor cells, together with progressive photoreceptor cell impairment.


Figures

Figure 1
Figure 1
Quantitative fundus autofluorescence image analysis. Mean GLs recorded from eight circularly arranged segments (outlined in green) centered on the fovea were used to calculate qAF. (A) Vitelliruptive stage (P7). In this patient, three segments were excluded because they overlapped the lesion area. (B) Vitelliform stage (P14). All eight segments were analyzed in this patient.
Figure 2
Figure 2
Features of SW-AF (A) and NIR-AF (B) and SD-OCT (C) in a healthy eye. The central macula appears dark in SW-AF images due to absorption of the blue excitation wavelength by macular pigment, whereas in the NIR-AF image, the central macula is hyperautofluorescent due to increased optical density of melanin. The foveal depression is visible in the SD-OCT scan (C). Reflectivity layers are defined according to Staurenghi et al. ELM, external limiting membrane; EZ, ellipsoid zone; IZ, interdigitation zone; ONL, outer nuclear layer; RPE/BM, retinal pigment epithelium/Bruch's membrane.
Figure 3
Figure 3
Pre-vitelliform stage. P1. (A) SW-AF. The fundus appearance is normal. (B) NIR-AF imaging reveals foveal hypofluorescence. (C) qAF color-coded image of P1 presents intensities comparable to that in an age-similar healthy eye (E). (D) SD-OCT scan. The green line in A indicates the position of the SD-OCT scan; no abnormalities are noted.
Figure 4
Figure 4
Vitelliform stage. P1. (A) SW-AF. Hyperautofluorescent signal within the lesion is considerably brighter than in surrounding fundus. (B) NIR-AF. Lesion has a dark central area and hyperfluorescent puncta. (C) qAF color-coded image. Hyperautofluorescence is confined to the lesion. qAF is not elevated outside the lesion. (D) Horizontal SD-OCT scans reveal a dome-shaped lesion. At the edge of the lesion the hyperreflective bands attributable to the ELM, EZ, and IZ are displaced anteriorly, separating these bands from the RPE/BM. Within the lesion, the IZ is disorganized. The positions of the scans are indicated by green lines in (A). The AF puncta in (A) and (B) (blue and yellow arrows) correspond to hyperreflective foci in the SD-OCT scans. (E) qAF color map of a healthy eye.
Figure 5
Figure 5
Pseudohypopyon stage. P9. (A) SW-AF discloses a lesion with hyperautofluorescence that is more pronounced inferiorly. (B) NIR-AF presents a dark central lesion with AF foci. The lesion is surrounded by hyperautofluorescence that is typical of the macula. (C) qAF color-coded image reveals an intensely AF punctum within the lesion. (D) The SD-OCT scan. The ELM and EZ bands follow the anterior contours of the lesion. The hyperreflective IZ is disorganized within the lesion. The optical clarity of the lesion is consistent with fluid in the line 1, while photoreceptors outer segment debris are likely the source of the dense deposits in the inferior region (line 2). The positions of the scans are indicated by green lines in (A). (E) qAF color-coded image acquired from an age-similar healthy eye demonstrates that qAF outside the lesion in (C) is within the normal range.
Figure 6
Figure 6
Vitelliruptive stage. P2. (A) SW-AF image. The lesion edge and an interior spot are hyperautofluorescent. Two other round areas are hypoautofluorescent (blue asterisks). (B) The NIR-AF image. Hyperautofluorescence at the superior margin of the lesion, with three round areas of increased fluorescence in the center (asterisks). (C) SD-OCT. The ELM, EZ, and IZ are obliterated. Increased transmission into the choroid is pronounced except at positions of hyperreflective projections (A, B, C1, red asterisks) suggestive of a fibrotic scar within the central lesion (A, B, C1–3, red and blue asterisks). The horizontal axes of the scans are indicated by green lines in (A). (D) qAF color map. Areas of high fluorescence at the lesion edge and normal levels outside the lesion. (E) qAF color-coded image. Healthy eye; age similar to the patient in (D).
Figure 7
Figure 7
Atrophic stage. P5. (A) SW-AF. The lesion is hypoautofluorescent except for punta of hyperautofluorescence inferiorly. (B) NIR-AF. The interior of the lesion is primarily hypoautofluorescent; hyperautofluorescence is present at the lesion edge. (C1–3) SD-OCT scans. A thickening of the RPE/BM reflectivity band in C1 (red arrow) is not autofluorescent in the SW-AF image (A, red arrow) but presents as a bright punctum in the NIR-AF image (B, red arrow). Hyperreflective material corresponding to disorganized IZ in C2 (yellow arrow) is not autofluorescent in the SW-AF (A) and NIR-AF (B) images. The edge of the original lesion, identifiable in (C3) as anterior displacement of EZ, and ELM (blue arrow) presents as autofluorescence in the SW-AF image in (A) but is not visible in the NIR-AF image (B). Increased transmission of OCT signal into the choroid is pronounced in (C3) and inner retina has collapsed into the lesion. The positions of the scans are indicated by green lines in (A). (D, E) qAF color-coded images. Outside the vitelliform lesion in the BVMD patient (D), the qAF levels are similar to that in age-similar healthy eye (E).
Figure 8
Figure 8
Vitelliruptive stage. P13. Corresponding positions are shown as dashed vertical lines in each image. (A) NIR-AF presents a region of faint hypofluorescence surrounding the lesion (dashed lines). (B) SW-AF image. A hypoautofluorescent zone, indicated by the vertical dashed lines, presents as a halo outside the lesion border. (C) qAF color-coded image. The zone between the vertical dashed lines exhibits reduced qAF. (D) SD-OCT. ONL is thinned within the zone indicated by the vertical dashed lines. Green lines in (A) and (B) indicate horizontal axis of SD-OCT scan.
Figure 9
Figure 9
Quantitative fundus autofluorescence; 25 eyes of BVMD patients. (A) Mean nonlesion qAF in BVMD eyes (red circles) are plotted together with mean (solid black line) and 95% confidence levels (dashed lines) acquired from eyes of healthy subjects. (B) qAF values in BVMD (colored circles) and healthy eyes (black circles). Stage of BVMD is indicated.
Figure 10
Figure 10
Semiquantitative NIR-AF intensity profiles. Mean (solid lines) and 95% confidence intervals (dashed lines); 28 eyes. Gray lines represent healthy control eyes and red lines indicate BVMD patients. Black vertical lines are the limits of the lesion, and the yellow vertical lines are the approximate limits of the halo. Upper right, within the halo mean GLs in the control versus BVMD eyes are significantly different (P = 0.031).

References

    1. Marmorstein AD, Marmorstein LY, Rayborn M, Wang XD, Hollyfield JG, Petrukhin K. Bestrophin, the product of the Best vitelliform macular dystrophy gene (VMD2), localizes to the basolateral plasma membrane of the retinal pigment epithelium. Proc Natl Acad Sci U S A. 2000;97:12758–12763. - PMC - PubMed
    1. Johnson AA, Guziewicz KE, Lee CJ, et al. Bestrophin 1 and retinal disease. Prog Retin Eye Res. 2017;58:45–69. - PMC - PubMed
    1. Boon CJ, Klevering BJ, Leroy BP, Hoyng CB, Keunen JE, den Hollander AI. The spectrum of ocular phenotypes caused by mutations in the BEST1 gene. Prog Retin Eye Res. 2009;28:187–205. - PubMed
    1. Marquardt A, Stohr H, Passmore LA, Kramer F, Rivera A, Weber BH. Mutations in a novel gene, VMD2, encoding a protein of unknown properties cause juvenile-onset vitelliform macular dystrophy (Best's disease) Hum Mol Genet. 1998;7:1517–1525. - PubMed
    1. Jun I, Lee JS, Lee JH, et al. Adult-onset vitelliform macular dystrophy caused by BEST1 p.Ile38Ser mutation is a mild form of best vitelliform macular dystrophy. Sci Rep. 2017;7:9146. - PMC - PubMed

Publication types