

Higher dietary acid load potentially increases serum triglyceride and obesity prevalence in adults: An updated systematic review and meta-analysis
- PMID: 31071141
- PMCID: PMC6508739
- DOI: 10.1371/journal.pone.0216547
Higher dietary acid load potentially increases serum triglyceride and obesity prevalence in adults: An updated systematic review and meta-analysis
Abstract
Background: In the current meta-analysis, we aimed to systematically review and summarize the eligible studies evaluating the association between dietary acid load in terms of potential renal acid load (PRAL) and net-endogenous acid production (NEAP) with anthropometric parameters and serum lipids in adult population.
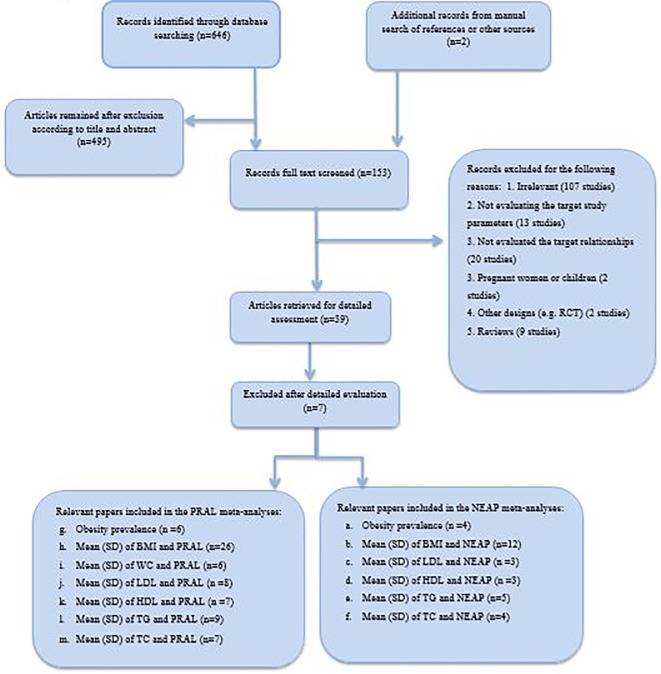
Methods: In a systematic search from PubMed, Scopus, Web of Sciences and Cochrane electronic databases up to December 2018, relevant studies were included. Cross-sectional, case control or cohort studies evaluating the association between PRAL and NEAP with the mean values of body mass index (BMI), waist circumference (WC), low and high density lipoprotein cholesterol (LDL, HDL), triglyceride (TG), total cholesterol (TC) and the prevalence of obesity were included.
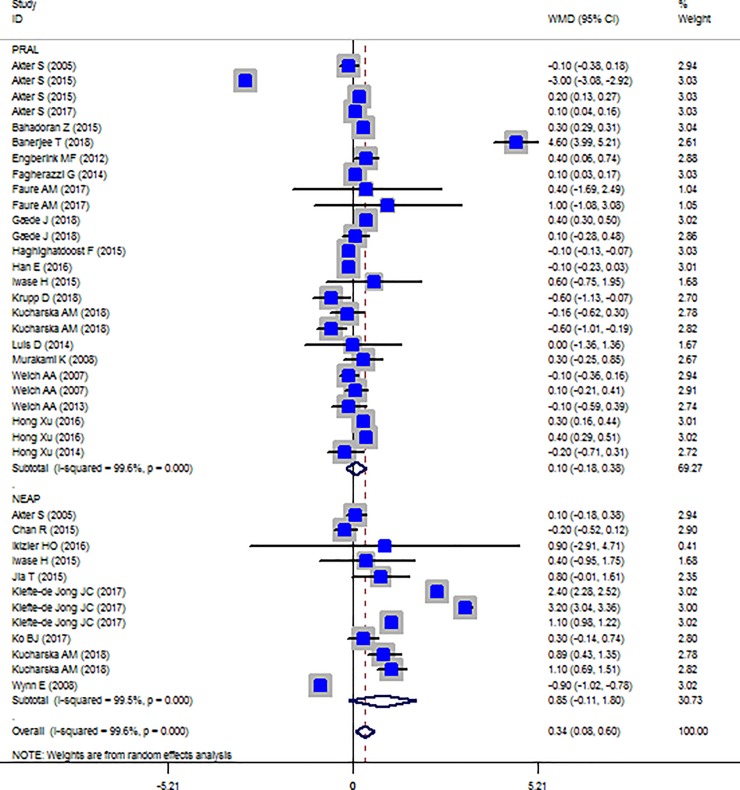
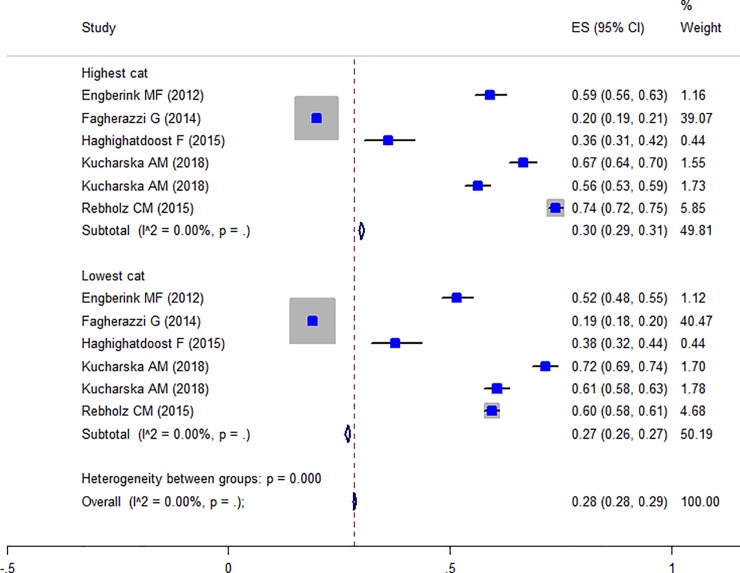
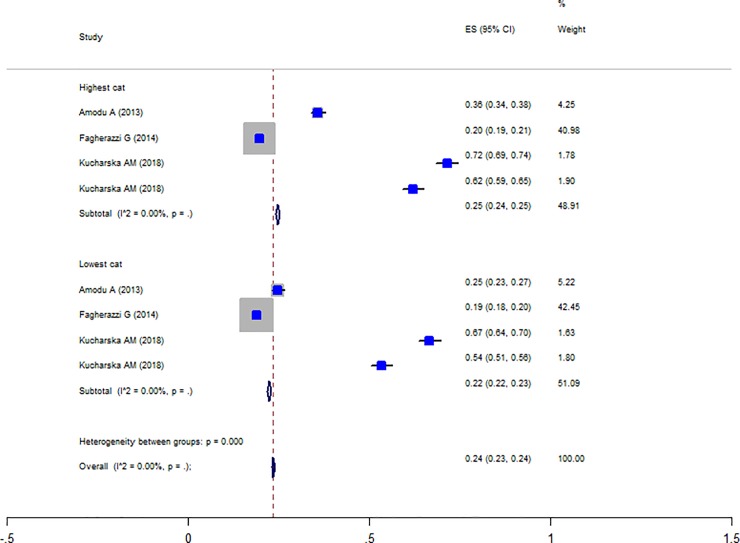
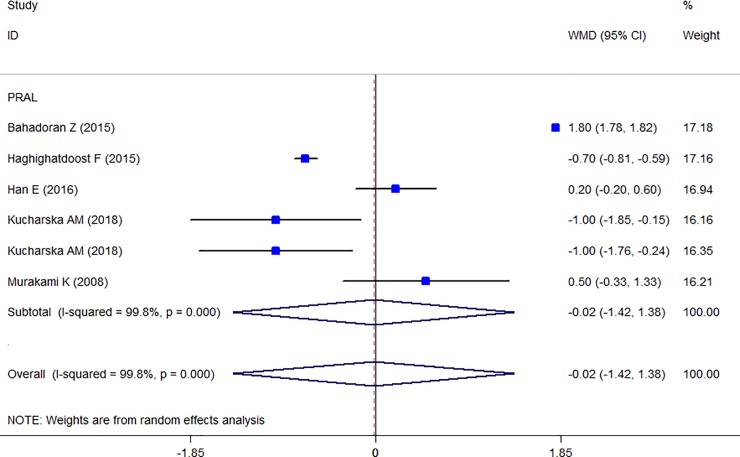
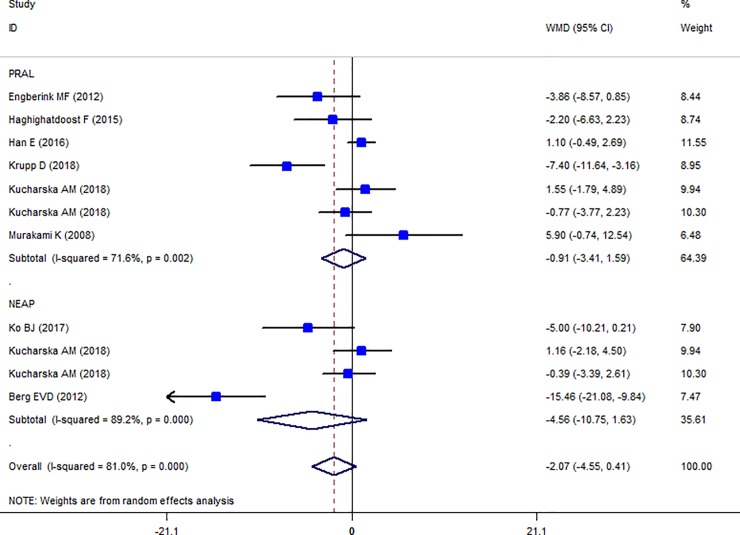
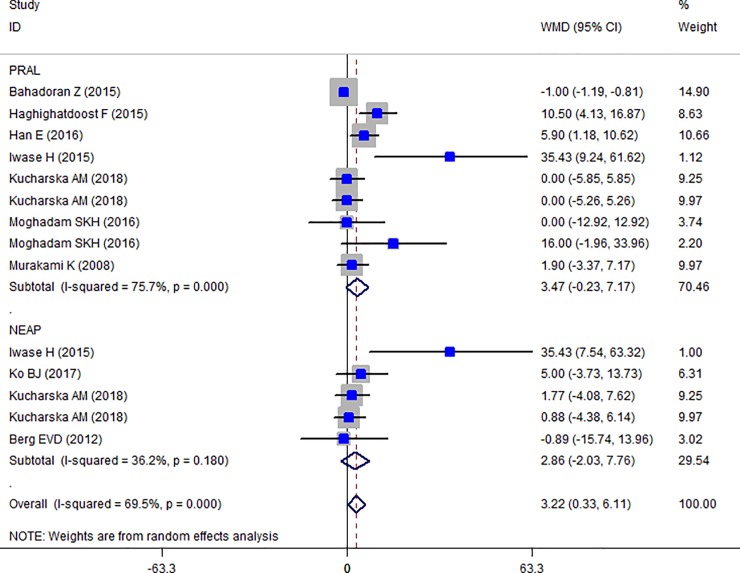
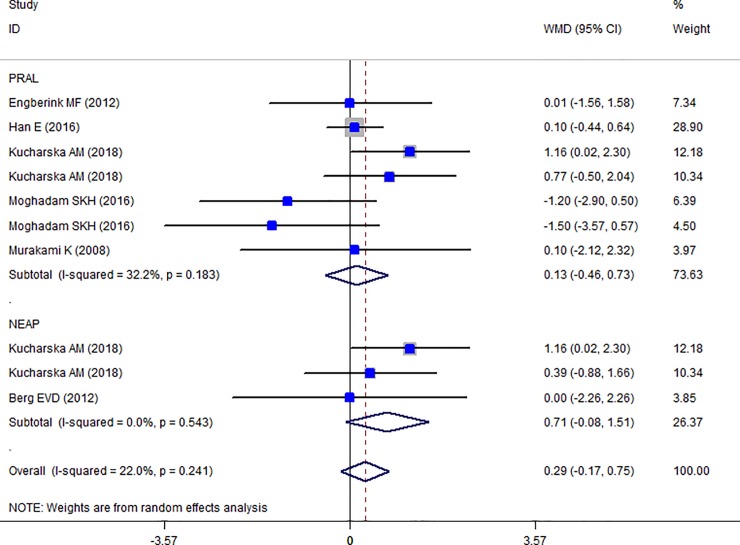
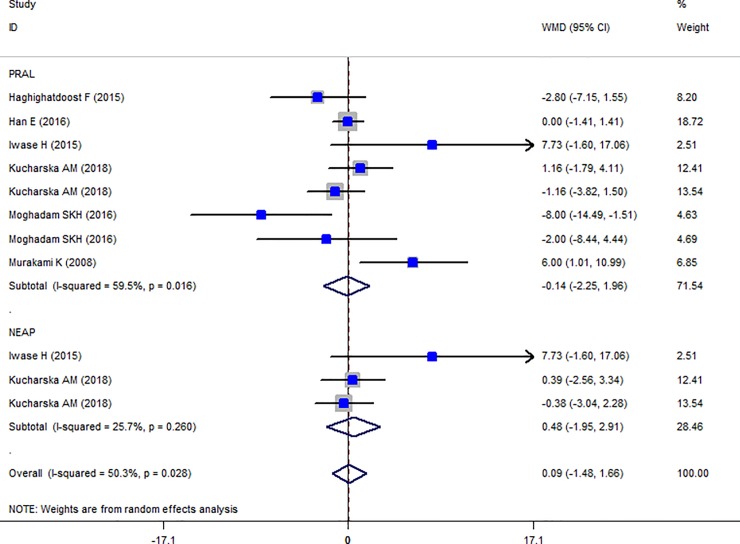
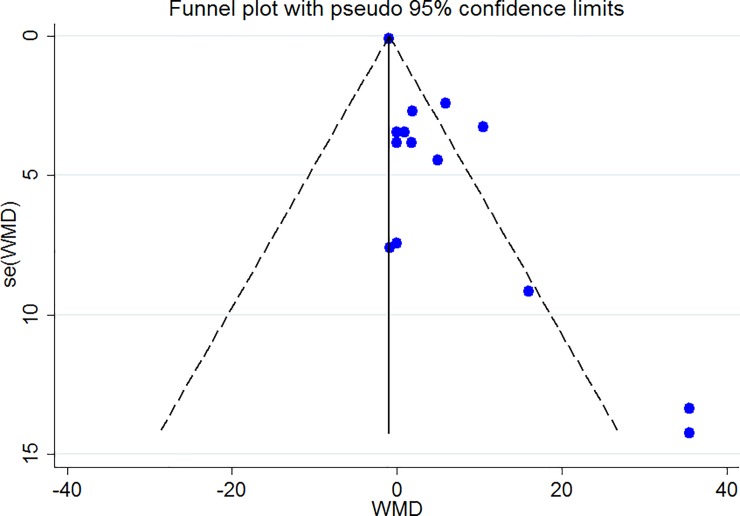
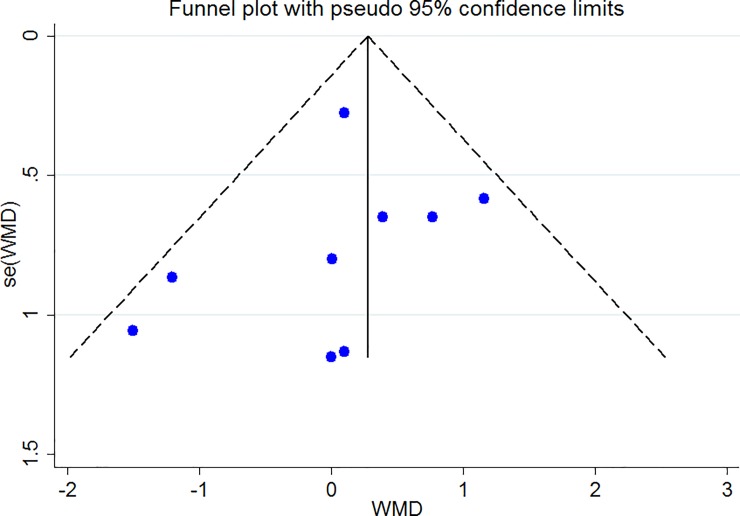
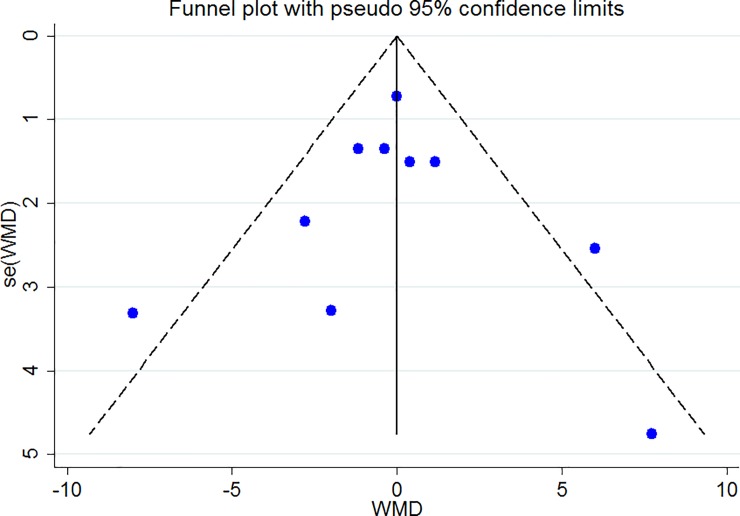
Results: According to our results, having higher dietary acid load content in terms of high PRAL scores was associated with higher triglyceride concentrations (weighted mean difference (WMD): 3.468; confidence interval (CI): -0.231, 7.166, P = 0.04) and higher obesity prevalence (30% and 27% in highest versus lowest categories). Accordingly, being in the highest category of NEAP was associated with higher prevalence of obesity (25% and 22% in highest versus lowest category). In subgroup analysis, higher PRAL scores was associated with higher BMI in women (WMD: 0.122; CI: -0.001, 0.245; P = 0.049) and higher NEAP in men (WMD: 0.890; CI: 0.430, 1.350; P < 0.001). There was no association between dietary acid load and other studied parameters.
Conclusions: In the current meta-analysis, high dietary acid load content was associated with higher serum triglyceride concentrations and higher obesity prevalence. Reducing dietary acid load content might be a useful preventive strategy against obesity and metabolic disorders.
Conflict of interest statement
The authors have declared that no competing interests exist.
Figures
References
-
- Obesity and overweight 2018 [Available from: https://www.who.int/news-room/fact-sheets/detail/obesity-and-overweight.
-
- Colditz G. Economic costs of obesity and inactivity. Medicine and Science in Sport and Exercise. 1999; 31 (11): S663–S7. - PubMed
-
- Khaki Khatibi F, Yaghoubi A, Zarghami N, Rahbani M, Babaie H. Evaluation of hs-CRP, antioxidant markers and MDA in patients of coronary artery disease (CAD) containing non-smokers and non-diabetics. J Cardiovasc Thorac Res 2011; 2(4):13–8.
-
- Akter S, Eguchi M, Kurotani K, Kochi T, Pham NM, Ito R, et al. High dietary acid load is associated with increased prevalence of hypertension: the Furukawa Nutrition and Health Study. Nutrition (Burbank, Los Angeles County, Calif). 2015;31(2):298–303. - PubMed
Publication types
MeSH terms
Substances
LinkOut - more resources
Full Text Sources
Medical
Miscellaneous
