. 2019 Jun 28;70(12):3197-3209.
doi: 10.1093/jxb/erz155.

Evolutionary comparison of competitive protein-complex formation of MYB, bHLH, and WDR proteins in plants

Affiliations

Evolutionary comparison of competitive protein-complex formation of MYB, bHLH, and WDR proteins in plants

Bipei Zhang et al. J Exp Bot. .

Abstract

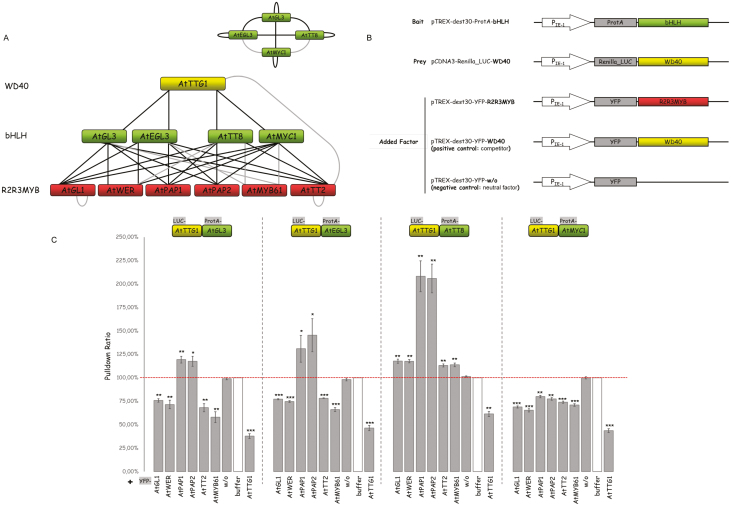
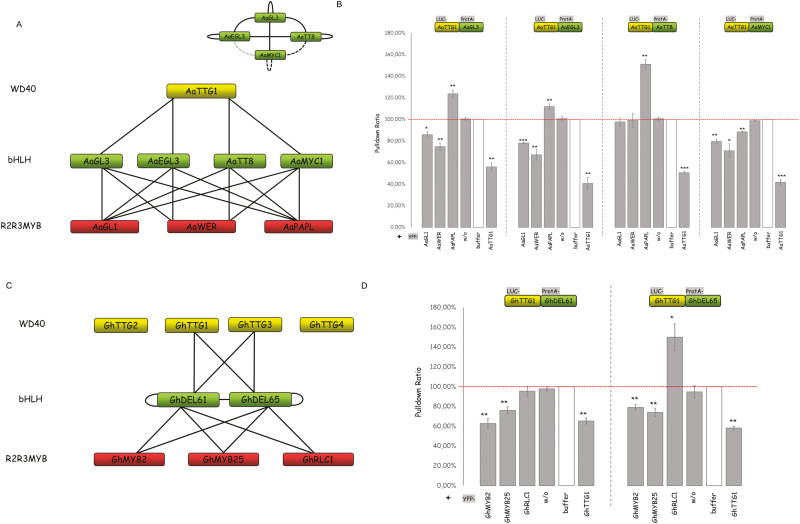
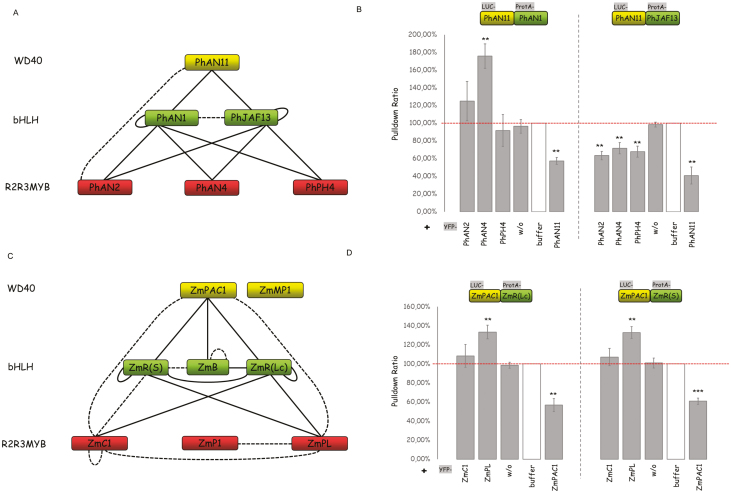
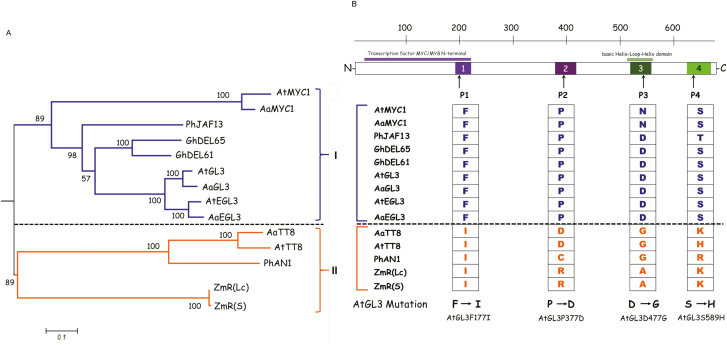
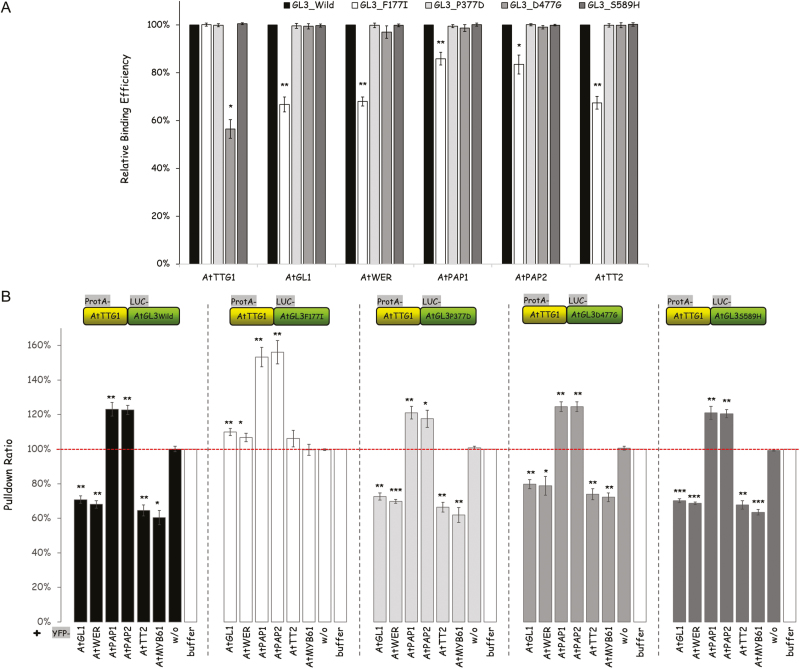
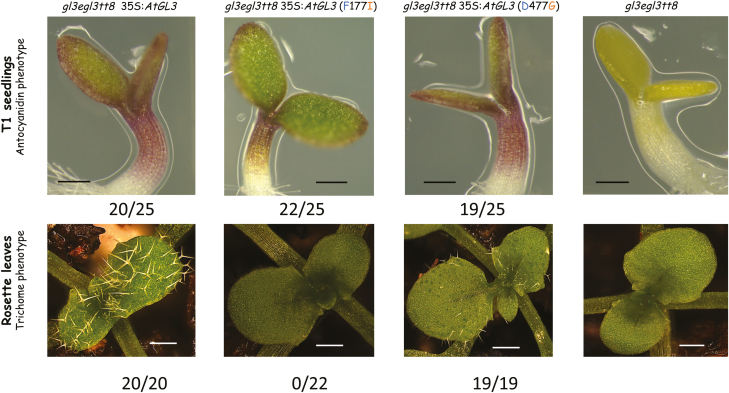
A protein complex consisting of a MYB, basic Helix-Loop-Helix, and a WDR protein, the MBW complex, regulates five traits, namely the production of anthocyanidin, proanthocyanidin, and seed-coat mucilage, and the development of trichomes and root hairs. For complexes involved in trichome and root hair development it has been shown that the interaction of two MBW proteins can be counteracted by the respective third protein (called competitive complex formation). We examined competitive complex formation for selected MBW proteins from Arabidopsis thaliana, Arabis alpina, Gossypium hirsutum, Petunia hybrida, and Zea mays. Quantitative analyses of the competitive binding of MYBs and WDRs to bHLHs were done by pull-down assays using ProtA- and luciferase-tagged proteins expressed in human HEC cells. We found that some bHLHs show competitive complex formation whilst others do not. Competitive complex formation strongly correlated with a phylogenetic tree constructed with the bHLH proteins under investigation, suggesting a functional relevance. We demonstrate that this different behavior can be explained by changes in one amino acid and that this position is functionally relevant in trichome development but not in anthocyanidin regulation.

Keywords: Arabidopsis thaliana; Arabis alpina; Gossypium hirsutum; Petunia hybrida; Zea mays; MBW complex; competitive complex formation; evolution.


Figures

Fig. 1.
Fig. 1.
Interactions and competition between MBW proteins in Arabidopsis. (A) Interaction network of MBW proteins based on yeast two-hybrid and pairwise LUMIER pull-down assays. Grey lines indicate weak interactions among the proteins. The homo- and hetero-dimerization of bHLHs is summarized at the top-right. (B) Schematic representation of the constructs driven by human promoter cytomegalovirus immediate early 1 (IE-1) that were used in the triple LUMIER assays. (C) Competition analysis of R2R3 MYB and bHLH proteins. Triple LUMIER pull-down assays were used to determine the pull-down efficiency of Renilla-tagged AtTTG1 by ProtA-tagged AtbHLH proteins with and without AtR2R3 MYB proteins. The results obtained in the presence of AtR2R3 MYB proteins are presented in relation to the pull-down values without addition of AtR2R3 MYB proteins (the white bar and horizontal dashed line indicates 100%). Yellow fluorescent protein (YFP) was included as a negative control (w/o). YFP-tagged AtTTG1 served as a positive control for competition. Data are means (±SE), n=3 experiments. Significant differences compared to the negative control (w/o) were determined using Student’s t-test: ***P<0.001; **P<0.01; *P<0.05. (This figure is available in color at JXB online.)
Fig. 2.
Fig. 2.
Interactions and competition between MBW proteins in Arabis alpina and Gossypium hirsutum. (A) Interaction network of MBWs in A. alpina based on yeast two-hybrid (Y2H) and pairwise LUMIER pull-down assays. The homo- and hetero-dimerization of AabHLHs are shown at the top-right: solid lines indicate interactions that were supported by both methods, and dashed lines indicate interactions that were supported by either Y2H or LUMIER assays. Grey indicates a weak interaction. (B) Competition analysis of AaR2R3MYBs and AabHLH proteins by triple LUMIER pull-down assays, as detailed in Fig. 1. (C) Interaction network of MBWs in G. hirsutum based on Y2H and pairwise LUMIER pull-down assays. (D) Competition analysis of GhR2R3MYBs and GhbHLH proteins by triple LUMIER pull-down assays, as detailed in Fig. 1. Data in (B, D) are means (±SE), n=3 experiments, and significant differences compared to the negative control (w/o) were determined using Student’s t-test: ***P<0.001; **P<0.01; *P<0.05. (This figure is available in color at JXB online.)
Fig. 3.
Fig. 3.
Interactions and competition between MBW proteins in Petunia hybrid and Zea mays. (A) Interaction network of MBWs in P. hybrid based on yeast two-hybrid (Y2H) and pairwise LUMIER pull-down assays. Solid lines indicate interactions that were supported by both methods, and dashed lines indicate interactions that were supported by either the Y2H or LUMIER assays. (B) Competition analysis of PhR2R3MYBs and PhbHLH proteins by triple LUMIER pulldown assays, as detailed in Fig. 1. (C) Interaction network of MBWs in Z. mays based on Y2H and pairwise LUMIER pull-down assays. Solid lines indicate interactions that were supported by both methods, and dashed lines indicate interactions that were supported by either Y2H or LUMIER assays. (D) Competition analysis of ZmR2R3MYBs and ZmbHLH proteins by triple LUMIER pull-down assays, as detailed in Fig. 1. Data in (B, D) are means (±SE), n=3 experiments, and significant differences compared to the negative control (w/o) were determined using Student’s t-test: ***P<0.001; **P<0.01; *P<0.05. (This figure is available in color at JXB online.)
Fig. 4.
Fig. 4.
Phylogenetic analysis of bHLH proteins used in this study. (A) The phylogenetic tree was constructed using the alignment of full-length bHLH proteins. The tree is drawn to scale with branch lengths measured as the number of substitutions per site, and it was created by mid-point rooting. Bootstrap values are given at the branch nodes, determined from 500 bootstrap repetitions. The interaction behaviors are indicated on the right: clade I, competitive complex formation; clade II, non-competitive complex formation. (B) Analysis of bHLH protein motifs. Four motifs were identified by MEME (http://alternate.meme-suite.org;(Bailey and Gribskov, 1998), shown as numbered boxes in the construct diagram of the bHLH protein. The sequence information for each motif is provided in the Supplementary Fig. S4). The amino acids shared in clade I in the four motifs are shown for the bHLH proteins analysed in this study and compared to those in clade II. The changes in amino acid that were introduced into wild-type AtGL3 are shown at the bottom. (This figure is available in color at JXB online.)
Fig. 5.
Fig. 5.
Analysis of mutant AtGL3 protein variants. (A) Binding analysis of the wild-type and mutant AtGL3 alleles with AtTTG1 or AtR2R3 MYB proteins by pairwise LUMIER assays. Data are shown as relative values compared to the wild-type AtGL3, which was defined as 100% (the inputs of the AtGL3 wild-type and mutant alleles were normalized). (B) Competition behavior of the wild-type and AtGL3 mutants. The interaction strength of the ProtA_ATTG1 and 4 LUC_AtGL3 alleles (as indicated at the top) was analysed in the presence of different AtR2R3 MYB proteins, as detailed in Fig. 1. The data are shown as relative values with reference to the probes without any AtR2R3 MYB proteins (the white bar and horizontal dashed line indicates 100%). Data are means (±SE), n=3 experiments, and significant differences compared to the negative control (w/o) were determined using Student’s t-test: ***P<0.001; **P<0.01; *P<0.05. (This figure is available in color at JXB online.)
Fig. 6.
Fig. 6.
Phenotypic rescue of the Arabidopsis gl3 egl3 tt8 triple-mutant by mutant AtGL3 protein variants. The triple-mutant was transformed with 35S::AtGL3, 35S::AtGL3 (F177I), and 35S::AtGL3 (D477G) and analysed in the T1 generation. The top row shows seedlings grown on half-strength Murashige and Skoog medium with 4% sugar under Basta selection at 4 d after germination. Scale bars are 2 mm. Representative images are shown and the proportions of rescued plants/Basta-resistant plants are indicated below. The bottom row shows rosette leaves of 2-week-old T1 plants that had previously been analysed for the anthocyanidin phenotype at 9 d after germination. The proportion of plants showing trichome rescue in the plants that exhibited anthocyanidin rescue are indicated below. Scale bars are 5 mm.

References

    1. Albert NW, Davies KM, Lewis DH, Zhang H, Montefiori M, Brendolise C, Boase MR, Ngo H, Jameson PE, Schwinn KE. 2014. A conserved network of transcriptional activators and repressors regulates anthocyanin pigmentation in eudicots. The Plant Cell 26, 962–980. - PMC - PubMed
    1. Albert NW, Lewis DH, Zhang H, Schwinn KE, Jameson PE, Davies KM. 2011. Members of an R2R3-MYB transcription factor family in Petunia are developmentally and environmentally regulated to control complex floral and vegetative pigmentation patterning. The Plant Journal 65, 771–784. - PubMed
    1. Altschul SF, Gish W. 1996. Local alignment statistics. Methods in Enzymology 266, 460–480. - PubMed
    1. Bailey TL, Gribskov M. 1998. Combining evidence using p-values: application to sequence homology searches. Bioinformatics 14, 48–54. - PubMed
    1. Baudry A, Caboche M, Lepiniec L. 2006. TT8 controls its own expression in a feedback regulation involving TTG1 and homologous MYB and bHLH factors, allowing a strong and cell-specific accumulation of flavonoids in Arabidopsis thaliana. Plant Journal 46, 768–779. - PubMed

Publication types

MeSH terms

Substances