. 2019 May 8;25(5):668-680.e7.
doi: 10.1016/j.chom.2019.04.002.

Bacteroides-Derived Sphingolipids Are Critical for Maintaining Intestinal Homeostasis and Symbiosis

Affiliations

Bacteroides-Derived Sphingolipids Are Critical for Maintaining Intestinal Homeostasis and Symbiosis

Eric M Brown et al. Cell Host Microbe. .

Abstract

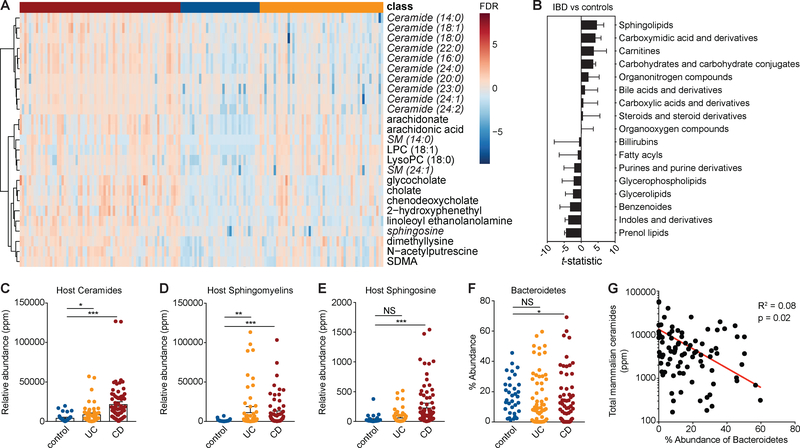
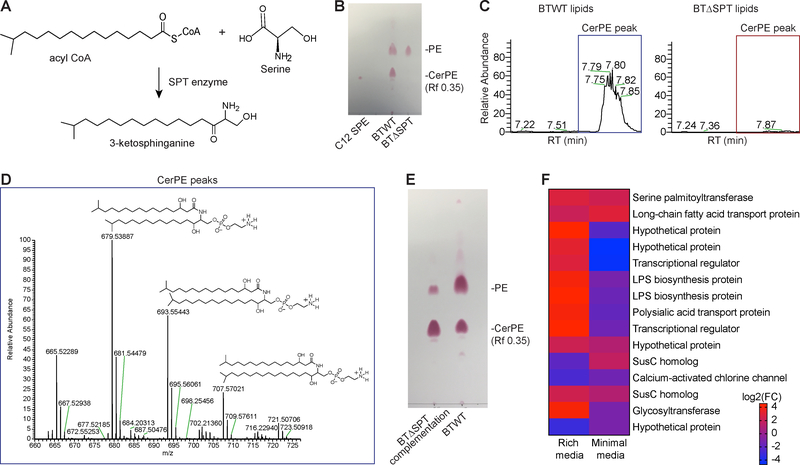
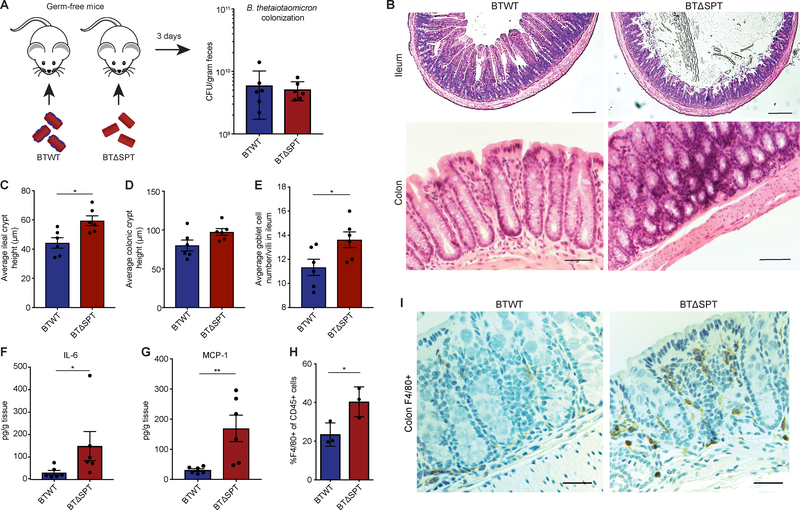
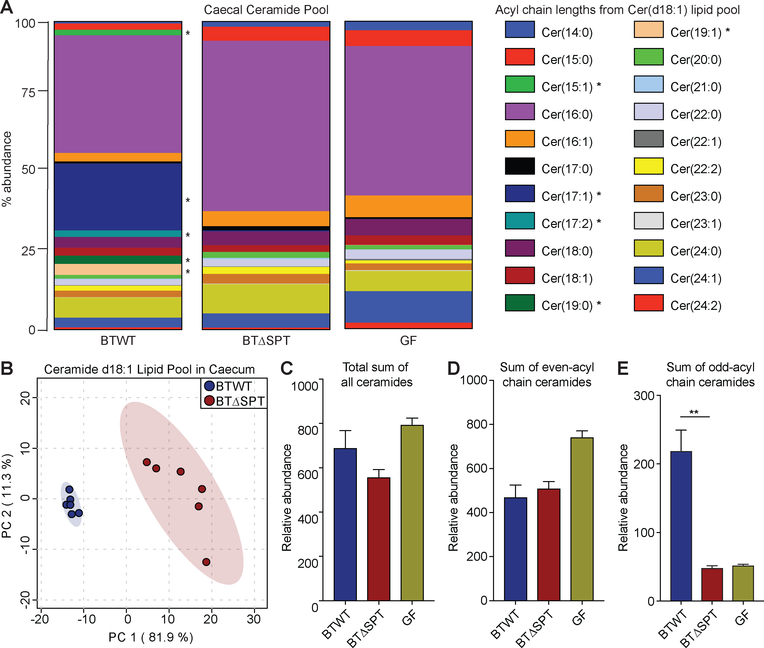
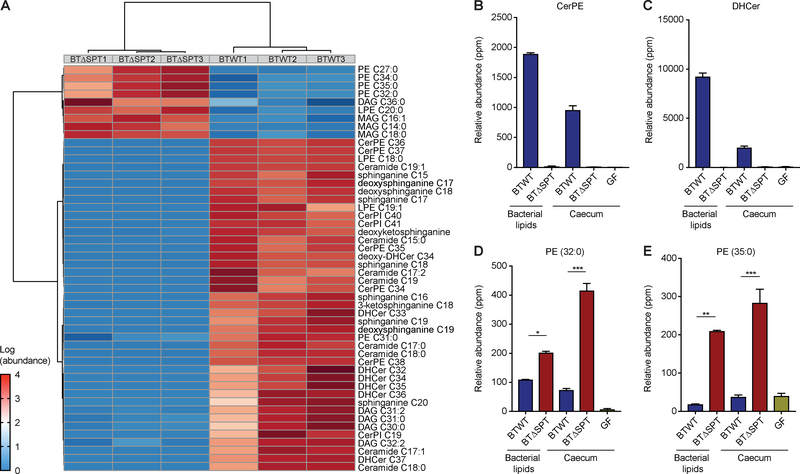
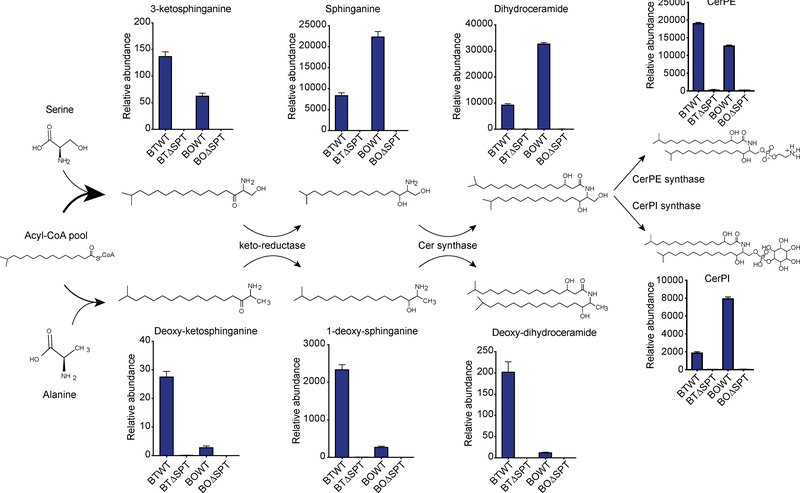
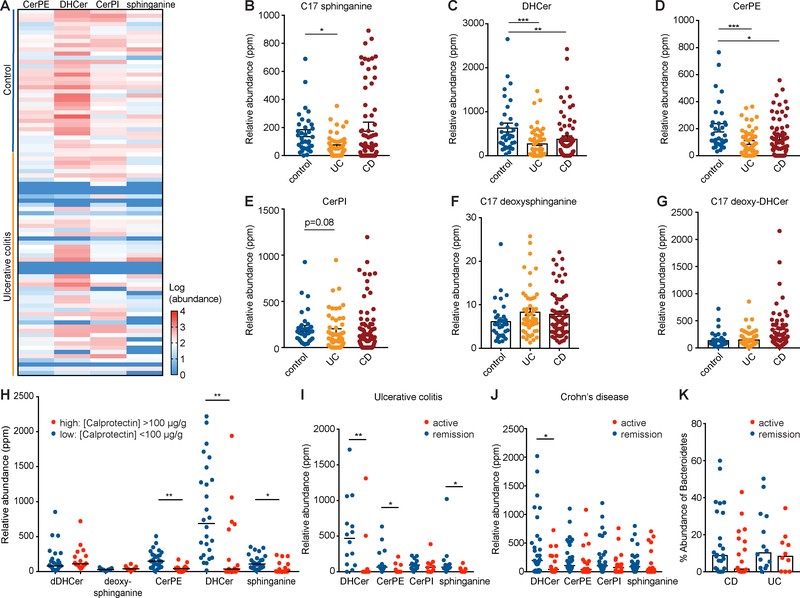
Sphingolipids are structural membrane components and important eukaryotic signaling molecules. Sphingolipids regulate inflammation and immunity and were recently identified as the most differentially abundant metabolite in stool from inflammatory bowel disease (IBD) patients. Commensal bacteria from the Bacteroidetes phylum also produce sphingolipids, but the impact of these metabolites on host pathways is largely uncharacterized. To determine whether bacterial sphingolipids modulate intestinal health, we colonized germ-free mice with a sphingolipid-deficient Bacteroides thetaiotaomicron strain. A lack of Bacteroides-derived sphingolipids resulted in intestinal inflammation and altered host ceramide pools in mice. Using lipidomic analysis, we described a sphingolipid biosynthesis pathway and revealed a variety of Bacteroides-derived sphingolipids including ceramide phosphoinositol and deoxy-sphingolipids. Annotating Bacteroides sphingolipids in an IBD metabolomic dataset revealed lower abundances in IBD and negative correlations with inflammation and host sphingolipid production. These data highlight the role of bacterial sphingolipids in maintaining homeostasis and symbiosis in the gut.

Keywords: Bacteroides; inflammation; inflammatory bowel disease; innate immunity; metabolism; microbiome; sphingolipids.


Figures

Figure 1:
Figure 1:. Increased abundances of host-produced sphingolipids is the most significant metabolite signature in stool during IBD.
(A) A clustered heat-map (Pearson-ward) displaying the 25 most significantly increased metabolites in Crohn’s disease (CD), ulcerative colitis (UC) and non-IBD control stool samples. Red indicates increased and blue indicates decreased relative abundance for each metabolite (rows) and sample (columns). Metabolites classified as sphingolipids are in italics. (B) A list of all 512 metabolites identified in the stool of IBD subjects and non-IBD controls, collapsed into 17 classes using metabolite class identifiers from the Human Metabolome Database. The x-axis indicates the change in the t-statistic for each metabolite class in IBD versus control samples. The relative abundance of host-produced (C) ceramides, (D) sphingomyelins and (E) sphingosine was summed and displayed in box-plots. Relative abundance (ppm) was quantified in UC (yellow), CD (red) and control stool (blue). (F) The total percentage abundance of Bacteroidetes strains identified in controls (blue), CD (red) and UC (yellow) was plotted for each individual in the study. (G) The total abundance of annotated mammalian ceramides was plotted against the total percentage abundance of Bacteroidetes species in each control and UC sample. Correlation and statistical regression analysis was performed using Pearson’s method. Statistical significance in (A) and (C-F) was determined by analysis of the FDR by the Hochberg-Benjamini test. *FDR<0.05; **FDR<0.01; ***FDR<0.001; NS, not significant. See also Figure S1 and Data File S1.
Figure 2:
Figure 2:. Genetic deletion of the serine palmitoyltransferase enzyme in B. thetaiotaomicron results in sphingolipid-deficient bacteria.
(A) Schematic of sphingolipid biosynthesis, in which serine palmitoyltransferase (SPT) catalyzes the addition of amino acids (e.g. serine) to acyl-coenzyme A (CoA) to form an N-acylated sphingoid backbone (e.g. 3-ketosphinganine). (B) Representative TLC plate verifying that ceramide phosphoethanolamine (CerPE) in wild type B. thetaiotaomicron (BTWT) is absent in the B. theta spt mutant (BTΔSPT). CerPE (Rf 0.35) is shown after ninhydrin staining (red) on TLC plates below the phosphorylethanolamine (PE) band and run with a CerPE standard, C12 sphingosyl-PE (C12 SPE). (C) Representative tick plots of the elution peak at the CerPE (679 m/z) retention time (RT) on a C8-column (7.7 min). The CerPE sphingolipid peak present in BTWT lipids (blue box) was absent in BTΔSPT lipids (red box). Data is representative of 3 biological replicates. (D) Isolation of purified CerPE from B. thetaiotaomicron was confirmed using LC-MS/MS. Tail lengths corresponding to the known masses of CerPE (679, 693, and 707m/z) were identified. Structures are shown above. (E) Representative TLC plate stained with ninhydrin (red) showing the CerPE band (Rf 0.35) is present in BTWT and SPT-complemented BTΔSPT strains. (F) Log2 fold-change (FC) difference between each B. thetaiotaomicron gene significantly changed (>2-fold upregulated, FDR<0.01) in the wild-type or mutant strain after growth in minimal and rich media. Genes upregulated in BTWT relative to BTΔSPT are in red and downregulated are in blue. Annotated gene functions, if available, are listed on the right. N=3. Only genes significantly changed in both rich and minimal media are displayed. See also Figure S2, Table S1, and Data File S2.
Figure 3:
Figure 3:. Mono-colonization of germ-free mice with a sphingolipid-deficient B. thetaiotaomicron strain results in intestinal inflammation and barrier dysfunction.
(A) Female, 6-week old, germ-free (GF) C57BL/6N mice were colonized with B. thetaiotaomicron WT (BTWT) and B. thetaiotaomicron spt deletion (BTΔSPT) strains. BTWT (blue) and BTΔSPT (red) colony-forming units (CFU) in fecal pellets were determined after 3 days of colonization. (B) Representative images of H&E stained colon and ileum sections from BTWT- and BTΔSPT-colonized mice. The average crypt height for each (C) ileal and (D) colonic section collected from BTWT- (blue) and BTΔSPT-colonized (red) mice was measured and plotted. (E) The number of goblet cells per villi observed in the ileum of BTWT- (blue) and BTΔSPT-colonized (red) mice was measured and plotted. Concentrations of (F) IL-6 and (G) MCP-1 detected in the colons of BTWT- (blue) and BTΔSPT-colonized (red) mice. (H) Relative abundance of F4/80+ macrophages compared to total lymphocytes (CD45+) from the colonic lamina propria of BTWT-(blue) and BTΔSPT-colonized (red) mice. (I) Representative immunofluorescence images of colon sections stained for macrophages (orange) with an F4/80-specific antibody. Nuclei are stained with DAPI (blue). All data are representative of 2 independent experiments, n=3 or n=6 per group. Scale bars, 100 μm. Statistical analysis was performed using the Mann-Whitney U-test. *p<0.05, **p<0.01. Error bars are +/− SEM. See also Figure S3.
Figure 4:
Figure 4:. B. thetaiotaomicron mono-colonization significantly alters the host ceramide pool.
(A) Normalized relative abundances (% of total) of all annotated host ceramides with a d18:1 backbone found in caecum of BTWT-colonized (left), BTΔSPT-colonized (middle) or GF (right) mice. Colors represent a unique lipid acyl chain annotated based on a d18:1 backbone. Asterisks denote lipids with significant changes. (B) Principal component analysis (PCA) was performed on the total ceramide d18:1 pool of acyl-chains presented in (A) from BTWT- (blue) and BTΔSPT-colonized (red) mouse caecum. The component change between each sample was plotted and values recorded on the x- and y-axes for percentage change. Mouse caecal samples from each group clustered within the 95% confidence intervals (blue and red shading). (C) Log-transformed relative abundance of all annotated host ceramides found in caecum of BTWT-colonized (blue), BTΔSPT-colonized (red) or GF (green) mice. Each ceramide with an (D) even-acyl or (E) odd-acyl chain length in the caecum of BTWT-colonized (blue), BTΔSPT-colonized (red) or GF (green) mice was summed and plotted, with the y-axis denoting the relative abundance of each observed metabolite detected. All data are representative of 2 independent experiments, n=6 for BTWT- and BTΔSPT-colonized mice and n=2 for GF mice. Statistical analysis in panels (A, E) was determined by the Hochberg-Benjamini test. *FDR<0.05; **FDR<0.01. Error bars are +/− SEM. See also Figure S4 and Data Files S3 and S4.
Figure 5:
Figure 5:. Lipidomic analysis reveals expansive shifts and insight into the bacterial lipid content dependent on serine palmitoyltransferase in the intestine.
(A) The top 50 annotated metabolite features by FDR changed in BTWT- and BTΔSPT-colonized mice, clustered using Euclidean distance and Pearson correlation. The most abundant and changed features in BTWT-colonized mice were (B) CerPE and (C) DHCer. Their relative abundances in mouse caecum and culture are compared to those in BTΔSPT-colonized mouse caecum and culture, where they are not detected. The most abundant and changed features in BTΔSPT-colonized mice were (D) PE 32:0 and (E) PE 35:0. Their relative abundances in mouse caecum and culture are compared to those in BTΔWT-colonized mouse caecum and culture, where they are significantly decreased. Statistical analysis was performed using the Mann-Whitney U-test. ***p<0.001; **p<0.01; *p<0.05. Error bars are +/− SEM. See also Table S2 and Data Files S3 and S4.
Figure 6:
Figure 6:. Proposed sphingolipid biosynthesis pathways for the most abundant sphingolipid metabolite features in Bacteroides.
Sphingolipid structures and features enriched in WT Bacteroides as predicted from LC-MS data. Bars represent relative abundances of each lipid in B. thetaiotaomicron and B. ovatus and losses in the corresponding ΔSPT strains. Annotation of SPT-dependent metabolite features reveals SPT can utilize serine (upper panels) or alanine (lower panels) to synthesize complex sphingolipids. From left to right, Spt is required for synthesis of 3-ketosphinganine or deoxy-ketosphinganine, sphinganine or 1-deoxy-sphinganine, dihydroceramide or deoxy-dihydroceramide, and ceramide phosphoethanolamine (CerPE) or ceramide phosphoinositol (CerPI). Chemical structure representations are based on an acyl chain backbone length of 17 carbons (C17) for sphingolipids and 18 carbons (C18) for deoxysphingolipids. See also Figures S5 and S6 and Data Files S3 and S5.
Figure 7:
Figure 7:. Bacteroides sphingolipids are significantly decreased during IBD and negatively correlated with intestinal inflammation.
Relative abundances of Bacteroides-produced sphinganine, DHCer, CerPE, and CerPI were quantified in stool of ulcerative colitis (UC), Crohn’s disease (CD), and non-IBD control subjects. (A) A heat-map displaying the relative abundances found in UC and control samples. Red indicates increased and blue indicates decreased relative abundances for each sample (rows) and metabolite (columns). Relative abundances in control (blue), UC (yellow), and CD (red) stool are shown for (B) C17 sphinganine, (C) DHCer, (D) CerPE, (E) CerPI, (F) C17 deoxysphinganine, and (G) C17 deoxy-DHCer. (H) The relative abundance of each of these sphingolipids was stratified by low-grade inflammation (fecal calprotectin <100 μg/g; blue) and high-grade inflammation (fecal calprotectin >100 μg/g; red). Bacteroides sphingolipid abundances in (I) UC or (J) CD were further stratified by active disease (Harvey-Bradshaw index >3 for CD and SCCI index >5 for UC; red) or remission (blue). (K) The corresponding percentage abundance of Bacteroidetes by metagenomic analysis was plotted to compare samples from patients with active disease versus those in remission. Statistical significance in panels (B, C, D) was determined by analysis of the FDR (*FDR<0.05; **FDR<0.01; ***FDR<0.001). Statistical analysis in (H, I, J, K) was performed using the Mann-Whitney U-test (*p<0.05; **p<0.01). Error bars are +/− SEM. See also Figure S7 and Data File S1.

References

    1. An D, Na C, Bielawski J, Hannun YA & Kasper DL (2011). Membrane sphingolipids as essential molecular signals for Bacteroides survival in the intestine. Proc Natl Acad Sci U S A, 108 Suppl 1, 4666–71. - PMC - PubMed
    1. An D, Oh SF, Olszak T, Neves JF, Avci FY, Erturk-Hasdemir D, Lu X, Zeissig S, Blumberg RS & Kasper DL (2014). Sphingolipids from a symbiotic microbe regulate homeostasis of host intestinal natural killer T cells. Cell, 156, 123–33. - PMC - PubMed
    1. Ananthakrishnan AN, Huang H, Nguyen DD, Sauk J, Yajnik V & Xavier RJ (2014). Differential effect of genetic burden on disease phenotypes in Crohn’s disease and ulcerative colitis: analysis of a North American cohort. Am J Gastroenterol, 109, 395–400. - PMC - PubMed
    1. Bryan PF, Karla C, Edgar Alejandro MT, Sara Elva EP, Gemma F & Luz C (2016). Sphingolipids as Mediators in the Crosstalk between Microbiota and Intestinal Cells: Implications for Inflammatory Bowel Disease. Mediators Inflamm, 2016, 9890141. - PMC - PubMed
    1. Bryksin AV & Matsumura I (2010). Overlap extension PCR cloning: a simple and reliable way to create recombinant plasmids. Biotechniques, 48, 463–5. - PMC - PubMed

Publication types

MeSH terms

LinkOut - more resources