. 2019 Aug;157(2):507-521.e4.
doi: 10.1053/j.gastro.2019.04.022. Epub 2019 May 7.

Effects of Serotonin and Slow-Release 5-Hydroxytryptophan on Gastrointestinal Motility in a Mouse Model of Depression

Affiliations

Effects of Serotonin and Slow-Release 5-Hydroxytryptophan on Gastrointestinal Motility in a Mouse Model of Depression

Narek Israelyan et al. Gastroenterology. 2019 Aug.

Abstract

Background & aims: Mood disorders and constipation are often comorbid, yet their shared etiologies have rarely been explored. The neurotransmitter serotonin (5-HT) regulates central nervous system and enteric nervous system (ENS) development and long-term functions, including gastrointestinal (GI) motility and mood. Therefore, defects in neuron production of 5-HT might result in brain and intestinal dysfunction. Tryptophan hydroxylase 2 (TPH2) is the rate-limiting enzyme in 5-HT biosynthesis. A variant of TPH2 that encodes the R441H substitution (TPH2-R441H) was identified in individuals with severe depression. We studied mice with an analogous mutation (TPH2-R439H), which results in a 60%-80% decrease in levels of 5-HT in the central nervous system and behaviors associated with depression in humans. Feeding chow that contains 5-HTP slow release (5-HTP SR) to TPH2-R439H mice restores levels of 5-HT in the central nervous system and reduces depressive-like behaviors.

Methods: We compared the effects of feeding chow, with or without 5-HTP SR, to mice with the TPH2-R439H mutation and without this mutation (control mice). Myenteric and submucosal plexuses were isolated from all 4 groups of mice, and immunocytochemistry was used to quantify total enteric neurons, serotonergic neurons, and 5-HT-dependent subsets of neurons. We performed calcium imaging experiments to evaluate responses of enteric neurons to tryptamine-evoked release of endogenous 5-HT. In live mice, we measured total GI transit, gastric emptying, small intestinal transit, and propulsive colorectal motility. To measure colonic migrating motor complexes (CMMCs), we isolated colons and constructed spatiotemporal maps along the proximodistal length to quantify the frequency, velocity, and length of CMMCs. We measured villus height, crypt perimeter, and relative densities of enterochromaffin and enteroendocrine cells in small intestinal tissue.

Results: Levels of 5-HT were significantly lower in enteric neurons from TPH2-R439H mice than from control mice. TPH2-R439H mice had abnormalities in ENS development and ENS-mediated GI functions, including reduced motility and intestinal epithelial growth. Total GI transit and propulsive colorectal motility were slower in TPH2-R439H mice than controls, and CMMCs were slower and less frequent. Villus height and crypt perimeter were significantly decreased in colon tissues from TPH2-R439H mice compared with controls. Administration of 5-HTP SR to adult TPH2-R439H mice restored 5-HT to enteric neurons and reversed these abnormalities. Adult TPH2-R439H mice given oral 5-HTP SR had normalized numbers of enteric neurons, total GI transit, and colonic motility. Intestinal tissue from these mice had normal measures of CMMCs and enteric epithelial growth CONCLUSIONS: In studies of TPH2-R439H mice, we found evidence for reduced release of 5-HT from enteric neurons that results in defects in ENS development and GI motility. Our findings indicate that neuron production of 5-HT links constipation with mood dysfunction. Administration of 5-HTP SR to mice restored 5-HT to the ENS and normalized GI motility and growth of the enteric epithelium. 5-HTP SR might be used to treat patients with intestinal dysfunction associated with low levels of 5-HT.

Keywords: CNS; GI Dysfunction; Gut–Brain Disease; Mood Disorders.


Conflict of interest statement

Conflict of Interest Statement: JPRJ and MGC are inventors on US patents pertaining to the adjunct 5-HTP SR method-of-treatment, and hold equity in Evecxia Inc., a company founded to develop a 5-HTP SR drug for the management of serotonin related disorders. The remaining authors do not have any conflicts of interest (financial, professional or personal).

Figures

Figure 1.
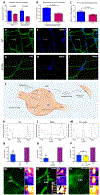
Figure 1.. Levels of 5-HT are diminished in the enteric nervous system of TPH2-R439H mice.
(n = 3-5/group). (A) Total and serotonergic neurons as a proportion of myenteric area (ileum). (B) Percentage of serotonergic neurons as a proportion of total neurons. (C) Mean axonal fluorescence intensity of neurites (myenteric plexus). (D,G) 5-HT immunoreactivity (green). (E,H) Total neurons (blue). (F,I) Coincident immunoreactivity between 5-HT and total neurons. Student’s unpaired t test used to compare groups. Data represent the mean ± SEM. Scale bar: 100μm. (J) Graphical representation of how enteric serotonergic neurons take up tryptamine, which causes 5-HT release, thus eliciting Ca2+ transients in the ENS. (K,L,M) Ca2+ traces of neurons showing tissue responses of tryptamine 1 (T1) and tryptamine 2 (T2), compared to one another and to KCl, in WT, R439H mice and WT mice exposed to 5-HTP superfusion. Arrows indicate delivery of T1, T2, and KCl, respectively. (N,O,P) Fluorescence intensities in ΔF/F of ROIs following drug delivery, as percent of KCl (positive control). (Q,R,S;ROI) Fluorescent micrographs showing changes of Fluo-4 intensities in ROIs after drug delivery of T1 (Q2,R2,S2), T2 (Q3,R3,S3) and KCl (Q4,R4,S4). R5 represents the heat map calibration bar. Scale bar: 50 μm.
Figure 2.
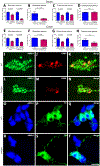
Figure 2.. Numbers of total and late-born enteric neurons are decreased in TPH2-R439H mice.
(n = 3-4/group). (A,E) Total and GABAergic neurons as a proportion of area in myenteric plexus of (A) ileum and (E) colon. (B,F) GABAergic neurons as a proportion of total neurons. (C,G) Total and dopaminergic neurons as a proportion of area in submucosal plexus of (C) ileum and (G) colon. (D,H) Dopaminergic neurons as a proportion of total neurons. Myenteric plexus from ileum of WT (I–K) and R439H (L–N) mice. (I,L) Total neurons (green). (J,M) GABAergic neurons (red). (K,N) Coincident immunoreactivity between total (green) and GABAergic (red) neurons. Submucosal plexus from colon of WT (O–Q) and R439H (R–T) mice. (O,R) Total neurons (blue). (P,S) Dopaminergic neurons (green). (Q,T) Coincident immunoreactivity between total (blue) and dopaminergic (green) neurons. Student’s unpaired t test used to compare groups. Data represent the mean ± SEM. Scale bars: 25μm
Figure 3.
Figure 3.. In vivo and in vitro intestinal motility are slower in TPH2-R439H than WT mice.
(n = 12-14/group; 1-3 trials). (A) Total GI transit. (B) Colonic motility. (C) Gastric emptying. (D) Small intestinal transit. (E–F) Spatiotemporal maps shows CMMCs (white arrows) in isolated colons of WT (E) and TPH2-R439H (F) mice (n = 8-10/group). The ordinate represents time, and the abscissa represents oral-to-anal distance. (G) CMMC frequency and (H) CMMC velocity were measured following construction of spatiotemporal maps. Student’s unpaired t test was used to compare groups. Data represent the mean ± SEM.
Figure 4.
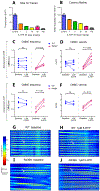
Figure 4.. Immediate-release 5-HTP (5-HTP IR) modulates in vivo motility and in vitro peristaltic contractions.
(n = 6-10/group). (A) Total GI transit and (B) colonic motility after administration of 1, 3, 10, 30 or 100 mg/kg of intraperitoneal 5-HTP. CMMC frequency and velocity before and after receiving a single extraluminal (C,D) or intraluminal (E,F) dose of 1μM 5-HTP (n = 4-6/group). Spatiotemporal maps showing CMMCs (white arrow) in isolated colons in WT and R439H mice before (G,I) and after (H,J) administration of 1μM intraluminal 5-HTP. Student’s unpaired t test and 1-way ANOVA were used to compare groups, respectively, to compare single and multiple means. Data represent the mean ± SEM.
Figure 5.
Figure 5.. Administration of slow-release 5-HTP during adulthood rescues mice from the ENS hypoplasia associated with the TPH2-R439H mutation.
(n = 3-4/group). (A) Total neurons (green) and (B) GABAergic neurons (red) in the myenteric plexus of ileum. (D) Total neurons and (E) dopaminergic neurons in the submucosal plexus of ileum. (C) GABAergic and (F) Dopaminergic neurons as a proportion of total neurons. Myenteric plexus from ileum of (G–I) WT, (J-L) WT+5-HTP SR, (M-O) TPH2-R439H, and (P–R) TPH2-R439H+5-HTP SR. (I, L, O, R) Coincident immunoreactivity between total and GABAergic neurons. 1-way ANOVA and Fisher’s LSD test were used to compare groups. Data represent the mean ± SEM. Scale bars: 25μm.
Figure 6.
Figure 6.. Administration of slow-release 5-HTP during adulthood reverses motility abnormalities associated with the TPH2-R439H mutation.
(n = 10-14/group, 1-3 trials). (A) Total GI transit. (B) Colonic motility. (C) Gastric emptying. (D) Small intestinal transit. (E, F) CMMC frequency and velocity. (n = 5-9/group). (G–J) Spatiotemporal maps showing CMMCs (white arrow) in isolated preparations of colon of (G) control WT and (H) control TPH2-R439H mice and (H) WT and (J) TPH2-R439H mice receiving 5-HTP SR. The ordinate represents time. The abscissa represents oral-to-anal distance. 1-way ANOVA and Fisher’s LSD test were used to compare groups. Data represent the mean ± SEM.
Figure 7.
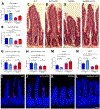
Figure 7.. The TPH2-R439H mutation leads to abnormalities in intestinal epithelial homeostasis that are ameliorated by 5-HTP SR administration.
(n = 4-6/group; 30 sections/mouse) (A) Villus height. (B) Crypt perimeter. (C–F) hematoxylin and eosin-stained ileal sections showing an individual villus and neighboring crypts in (C) WT, (D) WT+5-HTP, (E) TPH2-R439H and (F) TPH2-R439H+5-HTP. (G,H) Numbers of EC (G) and EE (H) cells/villus area. (I–L) Ileal sections stained with bisbenzimide (DNA; blue) and 5-HT (EC cell; red) in (I) WT, (J) WT+5-HTP, (K) TPH2-R439H and (L) TPH2-R439H+5-HTP. (M,N) Transcripts of ileal TPH2 (M) and SERT (N) (n = 14-21/group). 1-way ANOVA and Fisher’s LSD test were used to compare groups. Data represents the mean ± SEM. Scale bars: 25μm.

References

    1. Brody DJ, Pratt LA, Hughes JP. Prevalence of Depression Among Adults Aged 20 and Over: United States, 2013-2016. NCHS Data Brief 2018:1–8. - PubMed
    1. Sanchez MI, Bercik P. Epidemiology and burden of chronic constipation. Can J Gastroenterol 2011;25 Suppl B:11B–15B. - PMC - PubMed
    1. Hosseinzadeh ST, Poorsaadati S, Radkani B, et al. Psychological disorders in patients with chronic constipation. Gastroenterol Hepatol Bed Bench 2011;4:159–63. - PMC - PubMed
    1. Dipnall JF, Pasco JA, Berk M, et al. Into the Bowels of Depression: Unravelling Medical Symptoms Associated with Depression by Applying Machine-Learning Techniques to a Community Based Population Sample. PLoS One 2016;11:e0167055. - PMC - PubMed
    1. Fond G, Loundou A, Hamdani N, et al. Anxiety and depression comorbidities in irritable bowel syndrome (IBS): a systematic review and meta-analysis. Eur Arch Psychiatry Clin Neurosci 2014;264:651–60. - PubMed

Publication types

MeSH terms