. 2019 May 8;20(9):2265.
doi: 10.3390/ijms20092265.

Effect of Drought Stress and Developmental Stages on Microbial Community Structure and Diversity in Peanut Rhizosphere Soil

Affiliations

Effect of Drought Stress and Developmental Stages on Microbial Community Structure and Diversity in Peanut Rhizosphere Soil

Liangxiang Dai et al. Int J Mol Sci. .

Abstract

Background: Peanut (Arachis hypogaea L.), an important oilseed and food legume, is widely cultivated in the semi-arid tropics. Drought is the major stress in this region which limits productivity. Microbial communities in the rhizosphere are of special importance to stress tolerance. However, relatively little is known about the relationship between drought and microbial communities in peanuts.

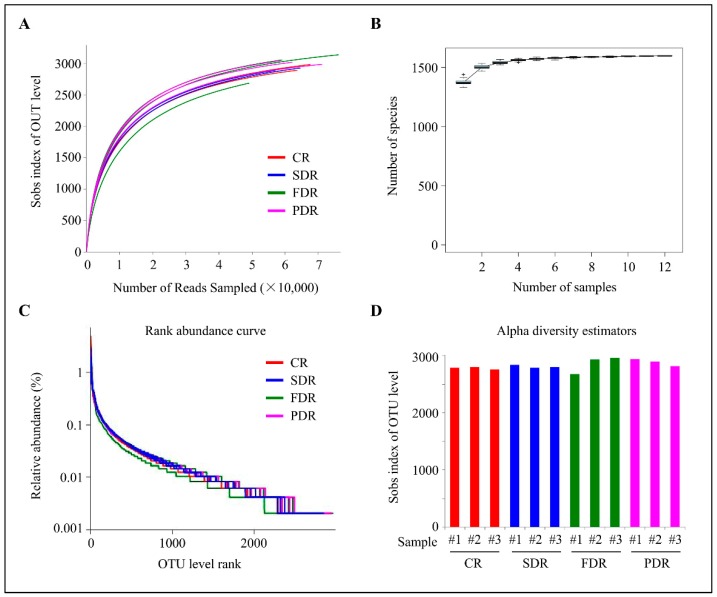
Method: In this study, deep sequencing of the V3-V4 region of the 16S rRNA gene was performed to characterize the microbial community structure of drought-treated and untreated peanuts.

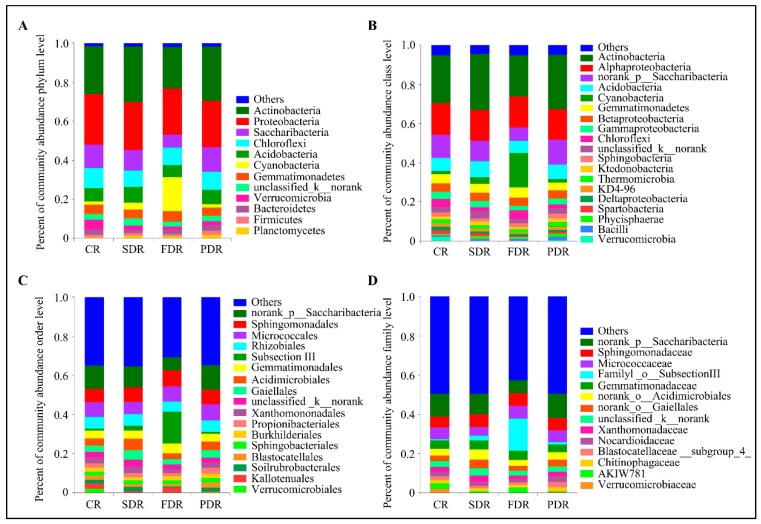
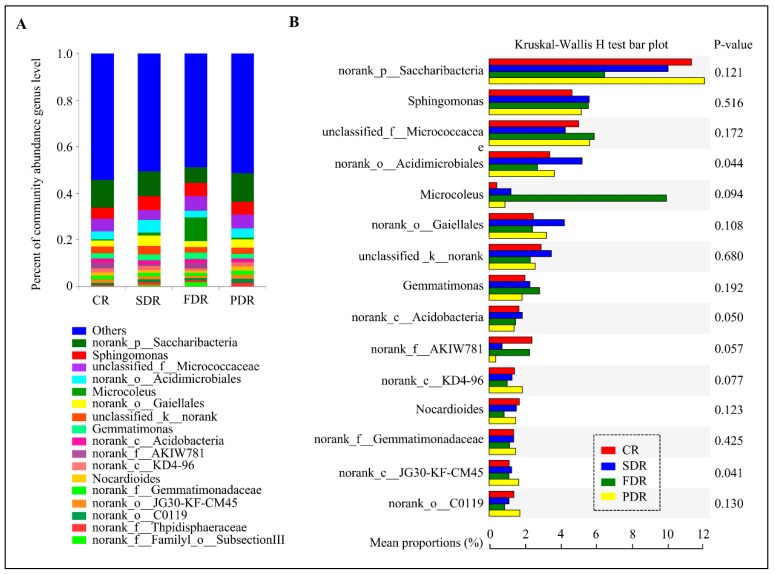
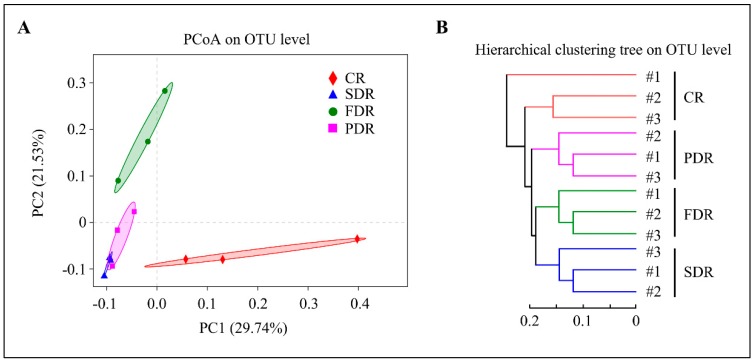
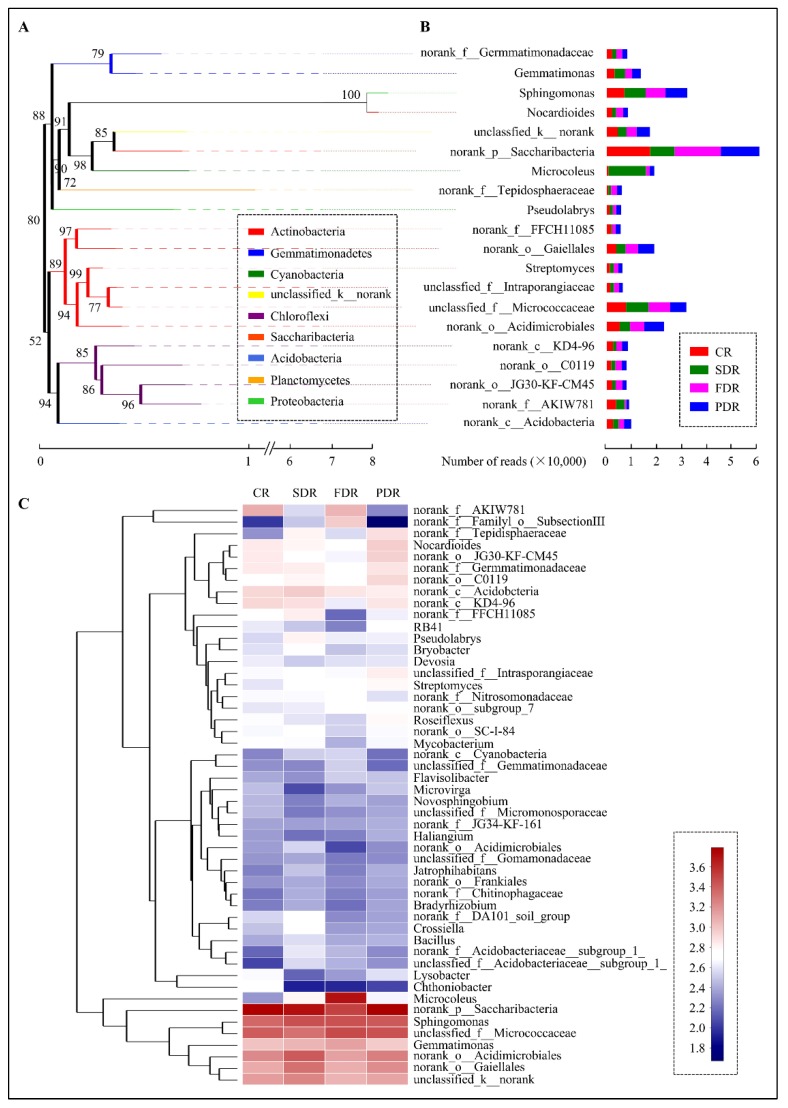
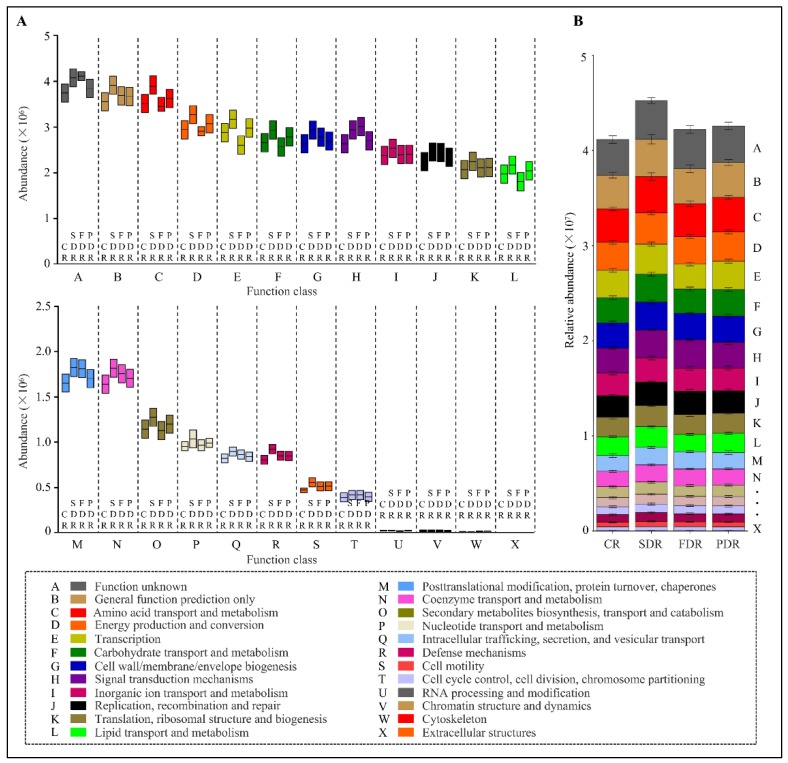
Results: Taxonomic analysis showed that Actinobacteria, Proteobacteria, Saccharibacteria, Chloroflexi, Acidobacteria and Cyanobacteria were the dominant phyla in the peanut rhizosphere. Comparisons of microbial community structure of peanuts revealed that the relative abundance of Actinobacteria and Acidobacteria dramatically increased in the seedling and podding stages in drought-treated soil, while that of Cyanobacteria and Gemmatimonadetes increased in the flowering stage in drought-treated rhizospheres. Metagenomic profiling indicated that sequences related to metabolism, signaling transduction, defense mechanism and basic vital activity were enriched in the drought-treated rhizosphere, which may have implications for plant survival and drought tolerance.

Conclusion: This microbial communities study will form the foundation for future improvement of drought tolerance of peanuts via modification of the soil microbes.

Keywords: drought stress; microbial community structure; peanut (Arachis hypogaea L.); rhizosphere.


Conflict of interest statement

The authors declare that they have no conflict of interest.

Figures

Figure 1
Figure 1
Alpha diversity analysis. (A) Rarefaction curve analysis showing the depth of 16S rRNA gene sequencing of peanut rhizosphere and the possibility of observing microbial community diversity. (B) Species accumulation curves showing the rate of increase of new species with the increase in sample size. (C) Rank abundance curve showing the relative species abundance and evenness. The length of the polyline on the horizontal axis reflects the number of operational taxonomic units (OTUs) in the sample and represents the richness of the microbial community. The flatness of the polyline reflects the evenness of the microbial community composition. (D) OTU levels via sobs index analysis showing the relative species abundance of four soil groups in peanut rhizosphere. #1, #2 and #3 represent three duplicate samples in per soil group.
Figure 2
Figure 2
Microbial community structure in peanut rhizosphere at the phylum, class, order and family level. (A) Percent of microbial community abundance at the phylum level in four soil groups in peanut rhizosphere. The relative abundance is calculated by averaging the abundances of duplicate samples in each soil group in peanut rhizosphere. (B) Percent of microbial community abundance at the class level in four soil groups in peanut rhizosphere. The relative abundance is calculated by averaging the abundances of duplicate samples. (C) Percent of microbial community abundance at the order level in four soil groups in peanut rhizosphere. The relative abundance is calculated by averaging the abundances of duplicate samples. (D) Percent of microbial community abundance at the family level in four soil groups in peanut rhizosphere. The relative abundance is calculated by averaging the abundances of duplicate samples. The names of “norank” and “unidentified” are all unidentified species obtained directly from database via sequence alignment.
Figure 3
Figure 3
Microbial community structure and diversity in drought-treated and untreated peanut rhizosphere. (A) Percent of microbial community abundance at the genus level in four soil groups in peanut rhizosphere. The relative abundance is calculated by averaging the abundances of duplicate samples. (B) Microbial community diversity in drought-treated and untreated peanut rhizosphere via Wilcoxon rank-sum test bar plot. Left image represents the proportions of various genera in four soil groups. Right image represents the difference between proportions in 95% confidence intervals. The names of “norank” and “unidentified” are all unidentified species obtained directly from database via sequence alignment.
Figure 4
Figure 4
Beta diversity analysis. (A) Principal co-ordinates analysis (PCoA) analysis. The same color points belong to the same soil group, and the same soil group points are marked by ellipses. The samples belonging to the same soil group are closer to each other and the samples from different soil groups are farther apart. (B) Hierarchical clustering is clustered according to groups’ similarity. The branch length among soil groups represent the degree of similarity among the four soil groups. #1, #2 and #3 represent three duplicate samples in per soil group.
Figure 5
Figure 5
Taxonomic analysis through phylogenetic tree and heat map. (A) A phylogenetic tree showing the relationship among drought-treated and untreated soil groups. The phylogenetic tree was constructed on the basis of 16S rRNA gene sequences. Bootstrap values were obtained from a search with 1000 replicates and are shown at the nodes. Species names and proportions in four soil groups showing in the right. (B) The heat map visualization with hierarchical clustering of the top 50 most abundant genera was generated according to the similarity among their constituents, and were arranged in a horizontal order according to the clustering results. (C) In the figure, red represents the more abundant genera in the corresponding soil group, and blue represents the less abundant genera. The names of “norank” and “unidentified” are all unidentified species obtained directly from database via sequence alignment.
Figure 6
Figure 6
Cladogram showing specific phylotypes of peanut rhizosphere responding to drought stress. Indicator bacteria with linear discriminant analysis (LDA) scores of 3 or greater in microbial communities associated with soil from drought-treated and untreated soil groups. Circles indicate phylogenetic levels from phylum to genus (from the inner circle to the outer circle). The diameter of each circle is proportional to the abundance of the group. The names of “norank” and “unidentified” are all unidentified species obtained directly from database via sequence alignment.
Figure 7
Figure 7
The microbial functional features in three drought-treated soil groups via Cluster of Orthologous Groups (COG) analysis. (A) Box-plot showing the relative abundance and diversity of various functional groups in drought-treated and untreated soil groups. (B) Bar chart showing the relative abundance and diversity of functional groups in drought-treated and untreated soil groups. The relative abundance is calculated by averaging the abundances of duplicate samples. Different COG groups were displayed in different colors in the bottom.

References

    1. Wang F.P., Wang X.F., Zhang J., Ma F., Hao Y.J. MdMYB58 Modulates Fe Homeostasis by Directly Binding to the MdMATE43 Promoter in Plants. Plant Cell Physiol. 2018;59:2476–2489. doi: 10.1093/pcp/pcy168. - DOI - PubMed
    1. Sui N., Wang Y., Liu S., Yang Z., Wang F., Wan S. Transcriptomic and Physiological Evidence for the Relationship between Unsaturated Fatty Acid and Salt Stress in Peanut. Front. Plant Sci. 2018;9:7. doi: 10.3389/fpls.2018.00007. - DOI - PMC - PubMed
    1. Wan L., Wu Y., Huang J., Dai X., Lei Y., Yan L., Jiang H., Zhang J., Varshney R.K., Liao B. Identification of ERF genes in peanuts and functional analysis of AhERF008 and AhERF019 in abiotic stress response. Funct. Integr. Genom. 2014;14:467–477. doi: 10.1007/s10142-014-0381-4. - DOI - PubMed
    1. Cuc L.M., Mace E.S., Crouch J.H., Quang V.D., Long T.D., Varshney R.K. Isolation and characterization of novel microsatellite markers and their application for diversity assessment in cultivated groundnut (Arachis hypogaea) BMC Plant Biol. 2008;8:55. doi: 10.1186/1471-2229-8-55. - DOI - PMC - PubMed
    1. Krishna G., Singh B.K., Kim E.K., Morya V.K., Ramteke P.W. Progress in genetic engineering of peanut (Arachis hypogaea L.)—A review. Plant Biotechnol. J. 2015;13:147–162. doi: 10.1111/pbi.12339. - DOI - PubMed

MeSH terms

Substances

LinkOut - more resources