. 2019 May 8;20(9):2275.
doi: 10.3390/ijms20092275.

Sonic Hedgehog Signaling Is Required for Cyp26 Expression during Embryonic Development

Affiliations

Sonic Hedgehog Signaling Is Required for Cyp26 Expression during Embryonic Development

Maha El Shahawy et al. Int J Mol Sci. .

Abstract

Deciphering how signaling pathways interact during development is necessary for understanding the etiopathogenesis of congenital malformations and disease. In several embryonic structures, components of the Hedgehog and retinoic acid pathways, two potent players in development and disease are expressed and operate in the same or adjacent tissues and cells. Yet whether and, if so, how these pathways interact during organogenesis is, to a large extent, unclear. Using genetic and experimental approaches in the mouse, we show that during development of ontogenetically different organs, including the tail, genital tubercle, and secondary palate, Sonic hedgehog (SHH) loss-of-function causes anomalies phenocopying those induced by enhanced retinoic acid signaling and that SHH is required to prevent supraphysiological activation of retinoic signaling through maintenance and reinforcement of expression of the Cyp26 genes. Furthermore, in other tissues and organs, disruptions of the Hedgehog or the retinoic acid pathways during development generate similar phenotypes. These findings reveal that rigidly calibrated Hedgehog and retinoic acid activities are required for normal organogenesis and tissue patterning.

Keywords: CRE/LoxP; Cyp26 enzymes; congenital anomalies; hedgehog signaling; mouse models; retinoic acid; smoothened; sonic hedgehog.


Conflict of interest statement

The authors declare no conflict of interest.

Figures

Figure 1
Figure 1
Loss of sonic hedgehog (SHH) signaling generates an abnormally thin and truncated tail lacking the notochord and vertebral chondrogenic condensations. (AG). Representative external tail phenotype (arrows) of mutants relative to controls. Control (A; n = 15), ShhGFPCRE/Smof/f mutant (B; n = 11), and Shhn/n mutant (C; n = 2) newborns (P0). E17.5 control (D; n = 8) and ShhCreERT2/Shhf mutant (E; n = 9) embryos first exposed to tamoxifen (TAM) at E11.5. E14.5 control (F; n = 5) and ShhCreERT2/Shhf mutant (G; n = 6) embryos first exposed to TAM at E10.5. The mutants exhibit severe tail defects. (HO) Tail sections from E15.5 mutants and controls immunostained (dark purple) for Keratin 8 (K8) and Sonic hedgehog (SHH) to visualize the notochord. Tails from a control embryo (H,J) and a ShhGFPCRE/Smof/f embryo (I,K). Tails from a control embryo (L,N) and a ShhCreERT2/Shhf mutant embryo (M,O) first exposed to TAM at E10.5. The control tails display chondrogenic mesenchymal condensations of presumptive vertebrae (asterisks) and a notochord (arrows) in the caudal region, whereas the mutant tails lack these structures. K8-positive (arrows in I and M) remnants of the notochord are visible in the rostral region of the mutant tails. HF, hair follicle. Scale bars: 2 mm (AC), 1 mm (DG) and 200 µm (HO).
Figure 2
Figure 2
Loss of SHH signaling in the developing tail causes loss of Cyp26a1 expression and ectopic activation of retinoic acid signaling. (AG) Representative whole-mount in situ hybridization (ISH) with riboprobes showing Cyp26a1 expression (purple) in developing tails. E9.5-E10 control (A; n = 3) and ShhCreERT2/Shhf mutant (B; n = 4) embryos first exposed to tamoxifen (TAM) at E8-E8.5. Control (C,E) and ShhGFPCRE/Smof/f mutant (D,F,G) embryos at E10.5 (C,D; n = 4 controls and n = 4 mutants) and E11.5 (EG; n = 4 controls and n = 3 mutants). In the control tails, the Cyp26a1 expression domain extends from the tail bud to more rostral levels of the tail (arrowheads in A,C and E). The mutant tails exhibit either a severely reduced domain of Cyp26a1 expression (arrowheads in D and F) or abolished Cyp26a1 expression (arrows in B and G). (H,I) Representative tail sections from E11 control embryos (H; n = 2) and a ShhGFPCRE/Smof/f mutant embryo (I) after ISH for Cyp26a1 with oligonucleotide probes (black). Decreased Cyp26a hybridization signals in the mutant tail as compared to the control tail (arrowheads in H and I). (J,K) RT-qPCR analysis showing the expression levels of RARb and RARg relative to Actb (β-actin). Upregulation of RARb (p = 0.0162) and RARg (p = 0.0261) levels in tails from E13.5 ShhCreERT2/Shhf mutant (n = 3 and n = 4 for RARb and RARg analyses, respectively) as compared to tails from control (n = 3 and n = 4 for RARb and RARb analyses, respectively) embryos first exposed to TAM at E11.5 (J). Upregulation of RARb (p = 0.0476) and RARg (p = 0.0610) levels in tails from E12.5 ShhGFPCRE/Smof/f mutants (n = 3 and n = 4 for RARb and RARg analyses, respectively) as compared to tails from controls (n = 3 and n = 4 for RARb and RARg analyses, respectively) (K). Data are mean values ± standard deviation; *: p < 0.05. (LO) Representative β-galactosidase (β-gal) histochemistry visualizing retinoic acid activity (blue) in control (L,N) and ShhGFPCRE/Smof/f mutant (M,O) embryos carrying the RAREhsplacZ transgene (RARElacZ) at E10 (L,M; n = 3 controls and n = 3 mutants) and at E11 (N,O; n = 7 controls and n = 3 mutants). The mutants exhibit ectopic retinoic acid activity (arrows in M and O) in tail tissues. s, somite. (P,Q) Representative tail explants from E11.5 control embryos treated for 24 h with DMSO (P; n = 5) and 0.2 µM SAG (Q; n = 4) showing expansion of Cyp26a1 expression domain (arrowheads in P and Q) and increased Cyp26a1 hybridization signals in the SAG-treated tail and failure of SAG to induce ectopic Cyp26a1 expression in adjacent structures, including the hindlimb bud (lb). Scale bars: 300 µm (AG,LQ) and 100 µm (H,I).
Figure 3
Figure 3
In vitro inhibition of retinoic acid signaling partially rescues the tail phenotype of SHH-deficient embryos. (A) Timeline representing the induction of CRE-mediated deactivation of Shh in embryos and in tail explants. The tails are from E11 control and ShhCreERT2/Shhf mutant embryos first exposed in utero to tamoxifen (TAM) at E10 (red arrowhead). All tail explants were cultivated in vitro for two days in the presence of 4-hydroxytamoxifen (4-OH-TAM; green arrowheads). During the in vitro cultivation period (three days), the tails were treated with DMSO or 12.5 µM BMS493. The time of harvest of the explants is indicated by a white arrowhead. (BE) Representative Keratin 8 (K8; dark purple) immunostaining visualizing the notochord (no) in sections of tail explants from control and mutant embryos. The tails were treated with DMSO (n = 5 controls and n = 6 mutants) or BMS493 (n = 13 controls and n = 8 mutants). B’E’ are magnified images of the boxed areas in BE. All the control tails treated with DMSO (B,B’) or BMS493 (C,C’) exhibit a notochord and chondrogenic mesenchymal condensations (asterisks in B’ and C’). All the DMSO-treated mutant tails lack a notochord in the posterior region, while in the rostral region they display an abnormally thin notochord (D,D’). The BMS493-treated mutant tails (E,E’) display a notochord (n = 6/8), but fail to exhibit chondrogenic mesenchymal condensations (n = 8/8). (FI) Representative sections of tail explants from control and mutant embryos were immunostained for cleaved Lamin A (dark purple) to visualize apoptotic cells. Massive apoptosis in the DMSO-treated mutant tails (H; n = 6) as compared to the BMS493-treated mutant tails (I; n = 6) and the DMSO-treated (F; n = 3) and BMS493-treated (G; n = 7) control tails. (J) Quantitation of apoptosis in tail explants (the number of explants assessed is described above). The number of apoptotic cells in the DMSO-treated mutant tails is significantly higher than in the DMSO-treated (p < 0.005) and BMS493-treated (p = 0.002) control tails. The BMS493-treated mutant tails show a significant decrease in apoptosis, as compared to the DMSO-treated mutant tails (p < 0.001). BMS493 had no effects on the extent of apoptosis in the control tails (p = 0.59). Data are mean values ± standard deviation; **: p < 0.01; ***: p < 0.001. Scale bars: 500 µm (BE) and 100 µm (B’I).
Figure 4
Figure 4
SHH signaling in the developing secondary palate is required for expression of Cyp26a1 and Cyp26b1 to prevent enhancement of retinoic acid signaling. (AL) Representative developing palates from control and ShhCreERT2/Shhf mutant embryos first exposed to tamoxifen (TAM) at E10-5-E11. The developmental stages are indicated on the panels. Whole-mount in situ hybridization (WMISH) with Dig-labelled riboprobes (C,D) and in situ hybridization in parasagittal sections (anterior palatal region towards the left of the panels) with oligonucleotide probes (A,B,EL). The inter-rugal epithelium and rugae palatinae are indicated by arrowheads and arrows, respectively. (A,B) Cyp26b1 expression in sections of palates (see also Figure S4) from control (A, n = 2) and mutant (B; n = 2) embryos. The mutant palate shows decreased Cyp26b1 hybridization signals (brown) as compared to the control palate. (CH) The mutant palates (D,F,H; n = 3 for WMISH and n = 4 for ISH in sections) show decreased Cyp26a1 hybridization signals (dark purple in whole-mounts and black in sections) as compared to control palates (C,E,G; n = 3 for WMISH and n = 4 for ISH in sections). In control palates Cyp26a1 transcripts are enriched in the inter-rugal epithelium. (I,J) Cyp26c1 (black) is expressed in subsets of cells within the basal layer of rugae palatinae (arrows in I and J) in control (I; n = 2) and mutant (J; n = 2) palates. (K,L) The mutant palate (L; n = 3) shows increased RARg hybridization signals (brown) in the mesenchyme and inter-rugal epithelium as compared to the control palate (K; n = 3). K’ and L’ are magnified views of the boxed areas in K and L, respectively. (M) RT-qPCR assay for RARb and RARg relative to Actb (β-actin) in paired palatal shelves from E13.5 controls (n = 7) and ShhCreERT2/Shhf mutants (n = 7) first exposed to TAM at E10.5 showing upregulation of RARb (p = 0.004) and RARg (p = 0.000) in the mutant palatal shelves as compared to the control palatal shelves. Data are mean values ± standard deviation; **: p < 0.01; ***: p < 0.001. md, mandible; PS, palatal shelf. Scale bars: 500 µm (C,D), 200 µm (K,L), 100 µm (A,B,EH,K’,L’) and 50 µm (I,J).
Figure 5
Figure 5
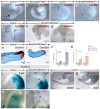
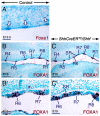
Loss of SHH signaling in the ShhCreERT2/Shhf mutant palate causes mispatterning of rugae palatinae (A) Bright-field view of a frontal section across the palate of an E13.5 control embryo after in situ hybridization with a 35S-UTP-labelled Foxa1 riboprobe showing Foxa1 expression (black dots) in rugae palatinae (arrows). (B,C) Representative FOXA1 immunostaining (dark purple) of para-sagittal sections of palates (anterior palatal region towards the left of the panels) from E15 control (B; n = 3) and ShhCreERT2/Shhf mutant (C; n = 3) embryos first exposed to tamoxifen at E10.5-E11. B’ and C’ are magnified views of the boxed areas in B and C, respectively. In the control palate FOXA1 is detected in the palatal periderm and in a subset of cells of rugae palatinae. The orthotopic rugae (R) are labelled with arabic numerals according to the order of their formation as described previously [91]. In the mutant palate supernumerary rugae (SR) develop between rugae R5 and R6 and between rugae R6 and R7 (C,D). Scale bars: 200 µm (B,C) and 50 µm (A,B’,C’).
Figure 6
Figure 6
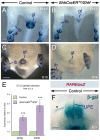
Loss of SHH signaling in the developing genital tubercle causes downregulation of Cyp26b1 expression and enhancement of retinoic acid signaling. (AD) Representative Cyp26b1 whole-mount in situ hybridization with riboprobes (purple). E14.5 control (A; n = 2) and ShhCreERT2/Shhf mutant (B; n = 2) embryos first exposed to tamoxifen (TAM) at E12. E13 control (C; n = 2) and ShhCreERT2/Shhf mutant (D; n = 2) embryos first exposed to TAM at E11.5. Diminished Cyp26b1 hybridization signals in the genital tubercle (gt) of the mutants. Note that Cyp26b1 signals are not altered in chondrogenic condensations within limb buds (lb) of the mutant as these cellular condensations do not express Shh. (E) RT-qPCR analysis for RARb and RARg relative to Actb (β-actin) in genital tubercles from E13.5 control and ShhCreERT2/Shhf mutant embryos first exposed to TAM at E11.5. Upregulation of RARb (p = 0.0009) and RARg (p = 0.0002) in the mutant (n = 8 and n = 7 for RARb and RARg, respectively) as compared to the control (n = 8 and n = 7 for RARb and RARg, respectively) genital tubercles. Data are mean values ± standard deviation; ***: p < 0.001. (F) β-galactosidase (β-gal) histochemistry revealing retinoic acid activity in the genital tubercle of control embryos carrying the RAREhsplacZ transgene (n = 7). Asterisk in F indicates an artefact due to tissue detachment. UPE, urethral plate epithelium. Scale bars: 300 µm (F) and 500 µm (AD).
Figure 7
Figure 7
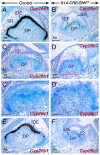
SHH signaling is required for maintenance of the expression of Cyp26a1 and Cyp26c1 in the developing tooth. (AF). Representative Cyp26a1 (A,B; n = 2 controls and n = 2 mutants), Cyp26b1 (C,D; one control and one mutant) and Cyp26c1 (E,F; n = 2 controls and n = 2 mutants) in situ hybridization (black) with oligonucleotide probes in frontal sections across developing first molars from control (A,C,E) and K14-CRE/Shhf/f mutant (B,D,F) newborn (P0) mice. C’ and D’ are magnified views of the boxed areas in C and D, respectively. The mutant molars show severely diminished Cyp26a1 hybridization signals in the inner dental epithelium (IDE) and abolished Cyp26a1 expression in cells of the stellate reticulum (SR). Note also the severely reduced domain of Cyp26c1 expression in the IDE of the mutant tooth (arrow in F). The mutant molars (D) exhibit ectopic expression of Cyp26b1 in the dental papilla mesenchyme (DP). Cyp26b1 expression in cells of the developing alveolar bone (arrowheads in C and D) is unaltered in the mutant. Scale bars: 100 µm (AD,E,F) and 50 µm (C’,D’).

Similar articles

Cited by

References

    1. McMahon A.P., Ingham P.W., Tabin T.J. Developmental roles and clinical significance of hedgehog signaling. Curr. Top. Dev. Biol. 2003;53:1–114. - PubMed
    1. Duester G. Retinoic acid synthesis and signaling during early organogenesis. Cell. 2008;134:921–931. doi: 10.1016/j.cell.2008.09.002. - DOI - PMC - PubMed
    1. Niederreither K., Dollé P. Retinoic acid in development: Towards an integrated view. Nat. Rev. Genet. 2008;9:541–553. doi: 10.1038/nrg2340. - DOI - PubMed
    1. Briscoe J., Thérond P. The mechanisms of hedgehog signaling and its roles in development and disease. Nat. Rev. Mol. Cell Biol. 2013;14:416–429. doi: 10.1038/nrm3598. - DOI - PubMed
    1. Mark M., Teletin M., Vernet N., Ghyselinck N. Role of retinoic acid receptor (RAR) signaling in postnatal male germ cell differentiation. Biochim. Biophys. Acta. 2015;1849:84–93. doi: 10.1016/j.bbagrm.2014.05.019. - DOI - PubMed

MeSH terms