. 2019 May 9;19(1):193.
doi: 10.1186/s12870-019-1798-7.

Transcriptome and physiological analyses for revealing genes involved in wheat response to endoplasmic reticulum stress

Affiliations

Transcriptome and physiological analyses for revealing genes involved in wheat response to endoplasmic reticulum stress

Xing Yu et al. BMC Plant Biol. .

Abstract

Background: Wheat production is largely restricted by adverse environmental stresses. Under many undesirable conditions, endoplasmic reticulum (ER) stress can be induced. However, the physiological and molecular responses of wheat to ER stress remain poorly understood. We used dithiothreitol (DTT) and tauroursodeoxycholic acid (TUDCA) to induce or suppress ER stress in wheat cells, respectively, with the aim to reveal the molecular background of ER stress responses using a combined approach of transcriptional profiling and morpho-physiological characterization.

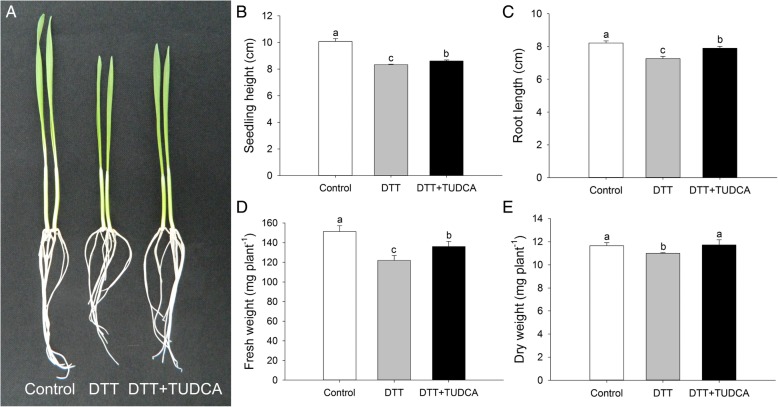
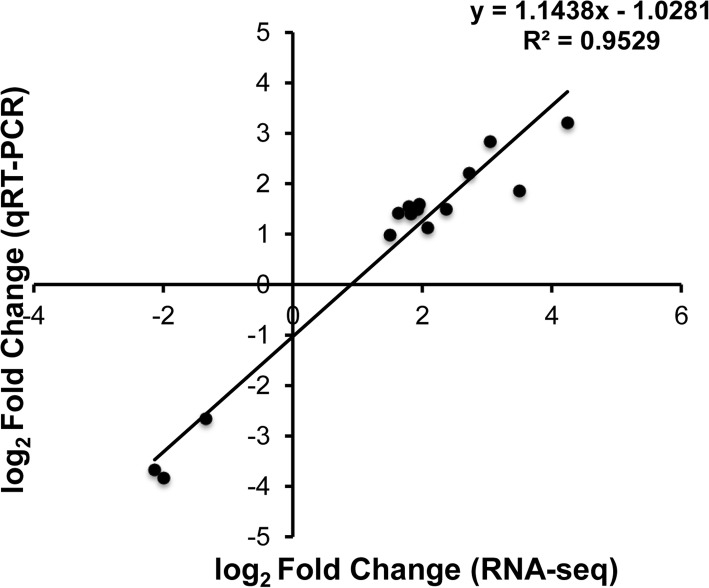
Methods: To understand the mechanism of wheat response to ER stress, three wheat cultivars were used in our pre-experiments. Among them, the cultivar with a moderate stress tolerance, Yunong211 was used in the following experiments. We used DTT (7.5 mM) to induce ER stress and TUDCA (25 μg·mL- 1) to suppress the stress. Under three treatment groups (Control, DTT and DTT + TUDCA), we firstly monitored the morphological, physiological and cytological changes of wheat seedlings. Then we collected leaf samples from each group for RNA extraction, library construction and RNA sequencing on an Illumina Hiseq platform. The sequencing data was then validated by qRT-PCR.

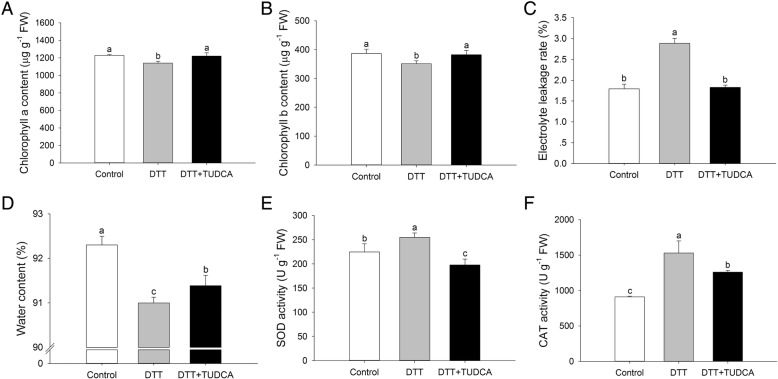
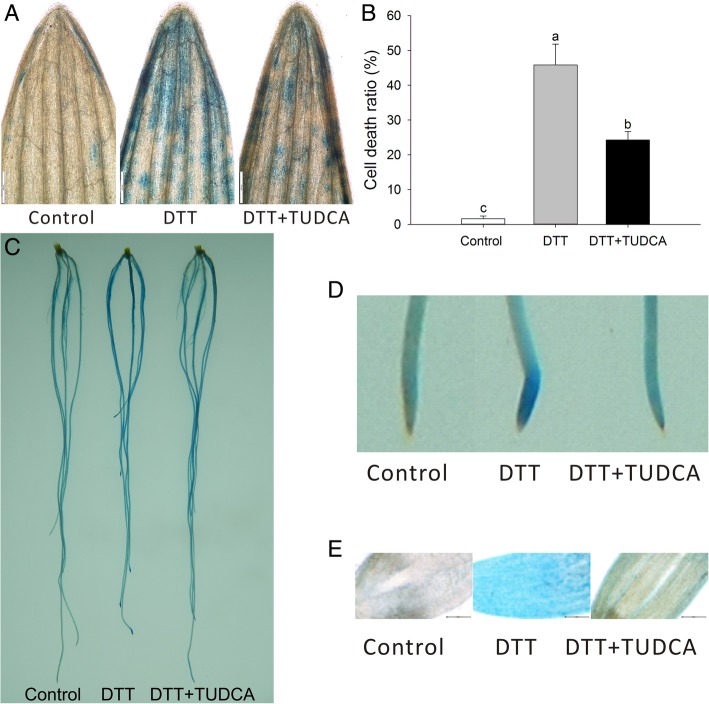
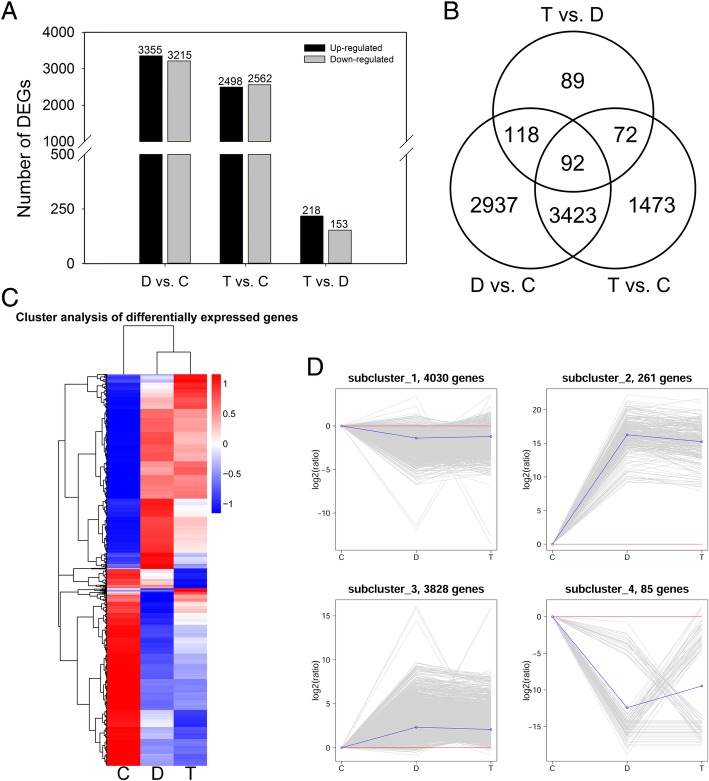
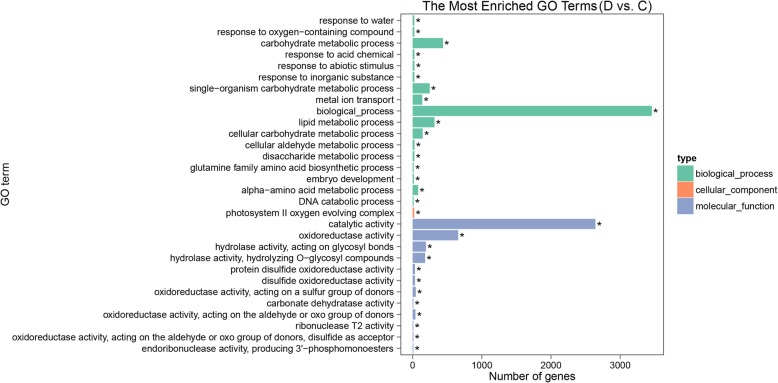
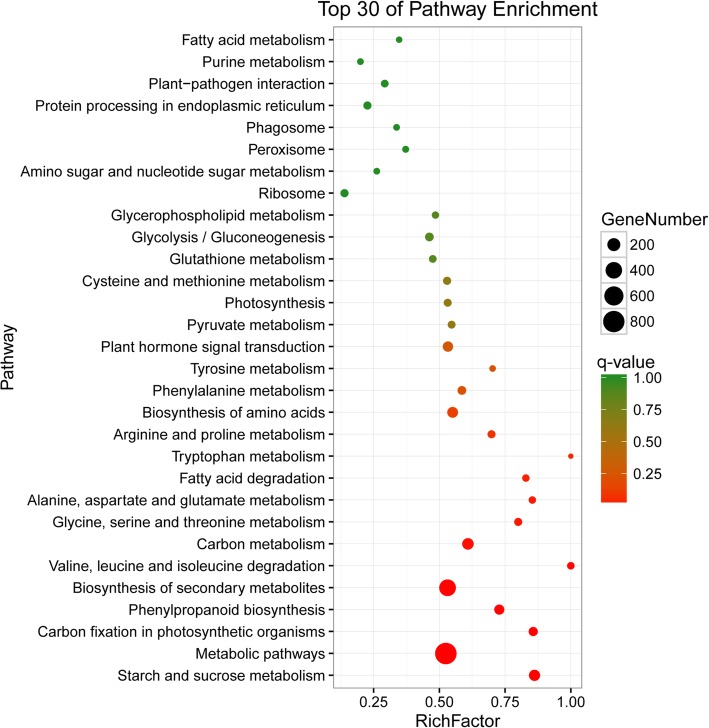
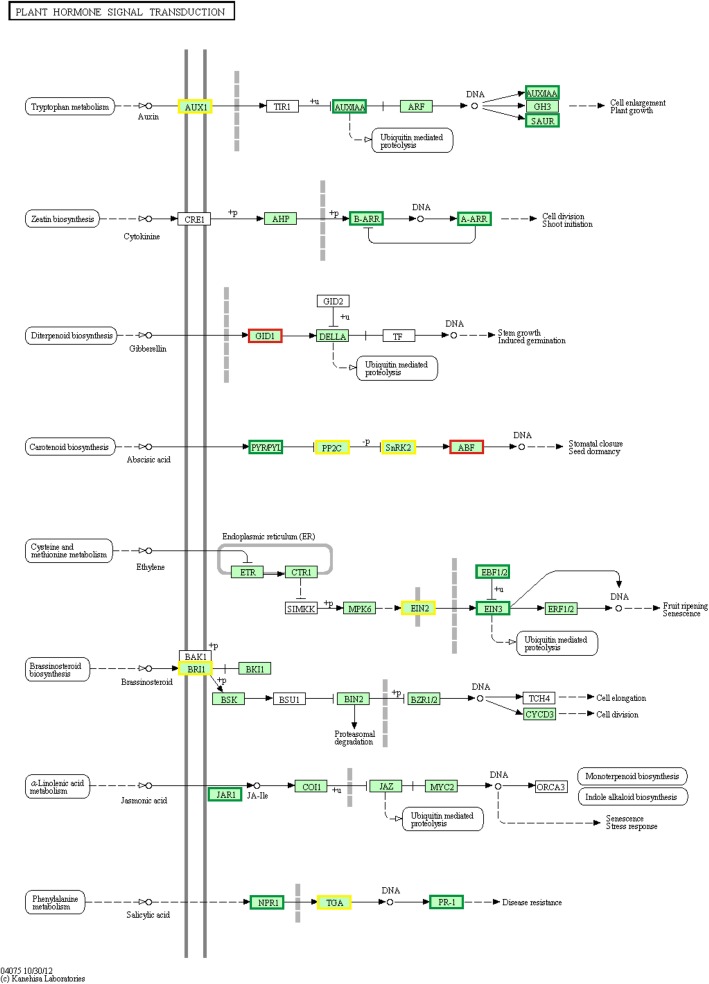
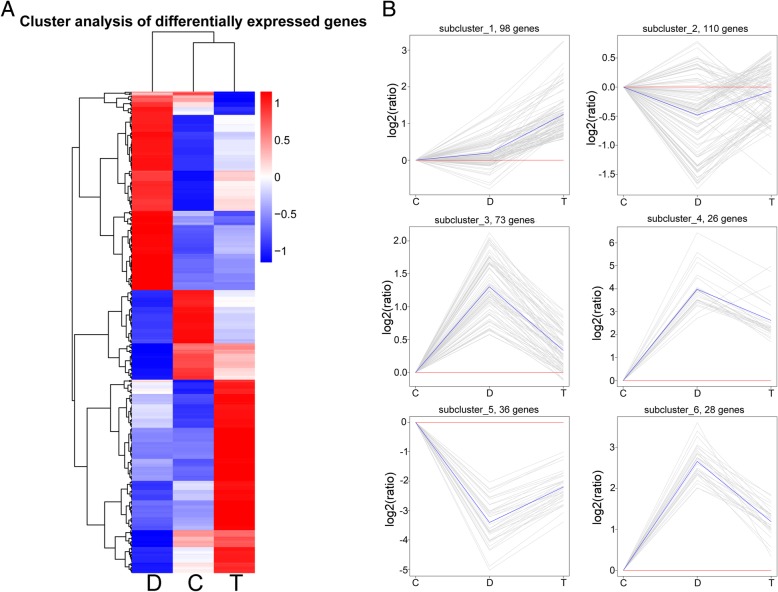
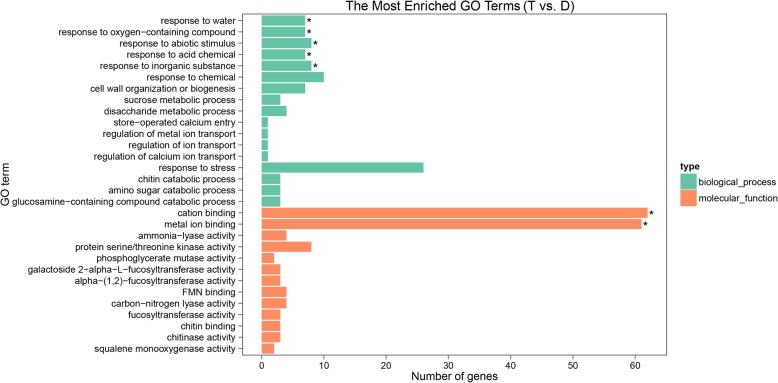
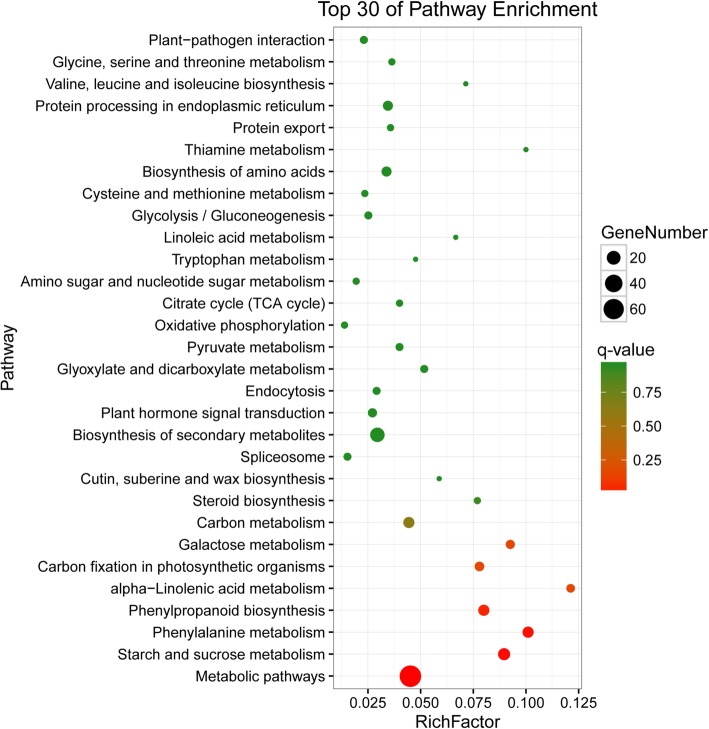
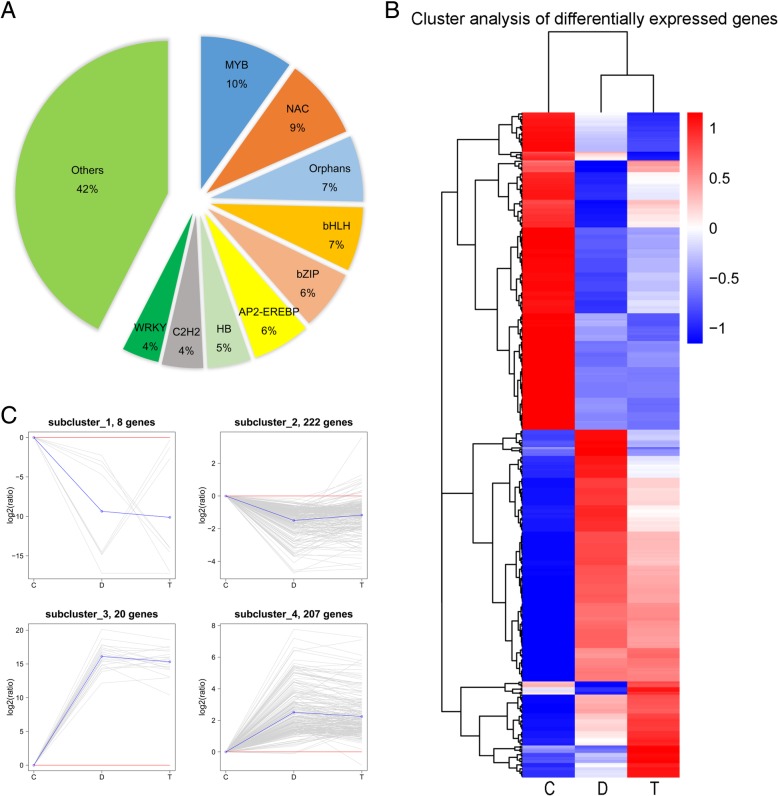
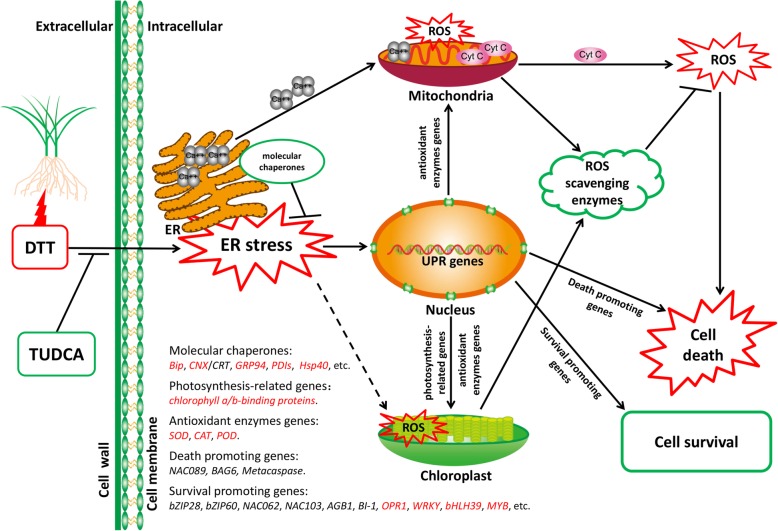
Results: Morpho-physiological results showed DTT significantly reduced plant height and biomass, decreased contents of chlorophyll and water, increased electrolyte leakage rate and antioxidant enzymes activity, and accelerated the cell death ratio, whereas these changes were all remarkably alleviated after TUDCA co-treatment. Therefore, RNA sequencing was performed to determine the genes involved in regulating wheat response to stress. Transcriptomic analysis revealed that 8204 genes were differentially expressed in three treatment groups. Among these genes, 158 photosynthesis-related genes, 42 antioxidant enzyme genes, 318 plant hormone-related genes and 457 transcription factors (TFs) may play vital roles in regulating wheat response to ER stress. Based on the comprehensive analysis, we propose a hypothetical model to elucidate possible mechanisms of how plants adapt to environmental stresses.

Conclusions: We identified several important genes that may play vital roles in wheat responding to ER stress. This work should lay the foundations of future studies in plant response to environmental stresses.

Keywords: Antioxidant enzymes; Chlorophyll; DTT; RNA-seq; TUDCA; Transcription factors.


Conflict of interest statement

Ethics approval and consent to participate

Not applicable.

Consent for publication

Not applicable.

Competing interests

The authors declare that they have no competing interests.

Publisher’s Note

Springer Nature remains neutral with regard to jurisdictional claims in published maps and institutional affiliations.

Figures

Fig. 1
Fig. 1
Morphological changes of wheat seedlings under different treatments after two days. (a) Whole view of wheat seedlings. (b, c) Seedling height and root length. (d, e) Fresh weight and dry weight. Different letters indicate significant difference among treatments at the 0.05 significance level based on Duncan’s multiple range tests. Bars represent the mean ± SD (n = 3)
Fig. 2
Fig. 2
Physiological and biochemical changes under different treatments after two days. (a) Chlorophyll a content. (b) Chlorophyll b content. (c) Electrolyte leakage rate. (d) Water content. (e) SOD activity. (f) CAT activity. Different letters indicate significant difference among treatments at the 0.05 significance level based on Duncan’s multiple range tests. Bars represent the mean ± SD (n = 3)
Fig. 3
Fig. 3
Comparison of wheat leaf and root under different treatments by trypan blue staining. (a) Trypan blue staining in leaf after 4-day’s treatment under microscope (X4). (b) Cell death ratio of leaf after 4-day’s treatment. (c, d) Trypan blue staining in seedling root after 1-day’s treatment under digital camera (c) Root system; (d) Root tip. (e) Root tip under microscope (X10). Bar = 500 μm in A and bar = 200 μm in E. Different letters of B indicate significant difference among treatments at the 0.05 significance level based on Duncan’s multiple range tests. Bars represent the mean ± SD (n = 3)
Fig. 4
Fig. 4
Summary of RNA sequencing data. (a) Histogram of DEGs number under different groups. (b) Venn diagram showing the number of DEGs between every two groups and the number of joint DEGs. (c) Hierarchical clustering of DEGs, using the RNA sequencing data derived from three treatments based on log10 (FPKM+ 1) values. The red bands indicate the higher expression, and the blue bands show the lower expression. (d) Gene expression pattern analysis of DEGs. The four subclusters obtained by K-means algorithm. Expression ratios are expressed as log2 values. The X-axis represents different treatments and the Y-axis represents the relative gene expression. C, control; D, DTT; T, DTT + TUDCA
Fig. 5
Fig. 5
GO classification of DEGs under group “D vs. C”. The top 30 GO terms were determined by the corrected P-values. The X-axis indicates the number of genes, and the Y-axis is the enriched GO terms. Different colors are used to distinguish biological process, cell component, and molecular function, with “*” as the significantly enriched GO terms. C, control; D, DTT
Fig. 6
Fig. 6
KEGG pathway classification of DEGs under group “D vs. C”. The Y-axis represents the pathway name, and the X-axis represents the rich factor. The size of the dot represents the number of DEGs in the pathway, and the color of the dot corresponds to a differently q-value (corrected P-value) range. The senior bubble was obtained by OmicShare tools, a free online platform for data analysis (www.omicshare.com/tools)
Fig. 7
Fig. 7
DEGs relevant to the “protein processing in endoplasmic reticulum” pathway under group “D vs. C”. Red boxes refer to genes whose associated DEGs were un-regulated under DTT treatment, and green boxes refer to genes whose associated DEGs were down-regulated. Boxes with yellow color indicate genes that might have isoforms
Fig. 8
Fig. 8
DEGs relevant to the “plant hormone signal transduction” pathway under group “D vs. C”. Red boxes refer to genes whose associated DEGs were un-regulated under DTT treatment, and green boxes refer to genes whose associated DEGs were down-regulated. Boxes with yellow color indicate genes that might have isoforms
Fig. 9
Fig. 9
Cluster analysis of 371 DEGs under group “T vs. D” among three treatments. (a) Hierarchical clustering of 371 DEGs under group “T vs. D”, using the RNA sequencing data derived from three treatments based on log10 (FPKM+ 1) values. The red bands indicate the higher expression, and the blue bands show the lower expression. (b) Gene expression pattern analysis of 371 DEGs between DTT and DTT + TUDCA under different treatments. The 6 subclusters obtained by h-cluster algorithm. Expression ratios are expressed as log2 values. The X-axis represents different treatments and the Y-axis represents the relative gene expression. C, control; D, DTT; T, DTT + TUDCA
Fig. 10
Fig. 10
GO classification of DEGs under group ‘T vs. D’. The top 30 GO terms were determined by the corrected P-values. The X-axis indicates the number of genes, and the Y-axis is the enriched GO terms. Different colors are used to distinguish biological process, cell component, and molecular function, with “*” as the significantly enriched GO terms. D, DTT; T, DTT + TUDCA
Fig. 11
Fig. 11
KEGG pathway classification of DEGs under group “T vs. D”. The Y-axis represents the pathway name, and the X-axis represents the rich factor. The size of the dot represents the number of DEGs in the pathway, and the color of the dot corresponds to a different q-value (a corrected P-value) range. The senior bubble was obtained by OmicShare tools, a free online platform for data analysis (www.omicshare.com/tools)
Fig. 12
Fig. 12
Summary of transcription factor data. (a) Pie chart showing top 9 TF families which contain more than 50% of differentially expressed TFs. (b) Hierarchical clustering of TFs, using the RNA sequencing data derived from three treatments based on log10 (FPKM+ 1) values. The red bands indicate the higher expression, and the blue bands show the lower expression. (c) Gene expression pattern analysis of TFs. The 4 subclusters obtained by K-means algorithm. Expression ratios are expressed as log2 values. The X-axis represents different treatments and the Y-axis represents the relative gene expression. C, control; D, DTT; T, DTT + TUDCA
Fig. 13
Fig. 13
Validation of RNA sequencing data using qRT-PCR. The log2 fold changes between group “D vs. C” or group “T vs. D” (Y-axis), were plotted against the log2 fold changes of the same comparison, and determined through RNA-seq (X-axis). The function of the regression line and the R2 are given
Fig. 14
Fig. 14
A hypothetical model for wheat response to ER stress

References

    1. Jelitto-van Dooren EP, Vidal S, Denecke J. Anticipating endoplasmic reticulum stress: a novel early response before pathogenesis-related gene induction. Plant Cell. 1999;11:1935–1943. doi: 10.1105/tpc.11.10.1935. - DOI - PMC - PubMed
    1. Liu JX, Srivastava R, Che P, Howell SH. Salt stress responses in Arabidopsis utilize a signal transduction pathway related to endoplasmic reticulum stress signaling. Plant J. 2007;51:897–909. doi: 10.1111/j.1365-313X.2007.03195.x. - DOI - PMC - PubMed
    1. Liu JX, Howell SH. Endoplasmic reticulum protein quality control and its relationship to environmental stress responses in plants. Plant Cell. 2010;22:2930–2942. doi: 10.1105/tpc.110.078154. - DOI - PMC - PubMed
    1. Deng Y, Humbert S, Liu JX, Srivastava R, Rothstein SJ, Howell SH. Heat induces the splicing by IRE1 of a mRNA encoding a transcription factor involved in the unfolded protein response in Arabidopsis. Proc Natl Acad Sci. 2011;108:7247–7252. doi: 10.1073/pnas.1102117108. - DOI - PMC - PubMed
    1. Xu H, Xu W, Xi H, Ma W, He Z, Ma M. The ER luminal binding protein (BiP) alleviates Cd2+-induced programmed cell death through endoplasmic reticulum stress-cell death signaling pathway in tobacco cells. J Plant Physiol. 2013;170:1434–1441. doi: 10.1016/j.jplph.2013.05.017. - DOI - PubMed

MeSH terms