. 2019 May 9;9(5):e022450.
doi: 10.1136/bmjopen-2018-022450.

Estimates of the 2016 global burden of kidney disease attributable to ambient fine particulate matter air pollution

Affiliations

Estimates of the 2016 global burden of kidney disease attributable to ambient fine particulate matter air pollution

Benjamin Bowe et al. BMJ Open. .

Abstract

Objective: To quantitate the 2016 global and national burden of chronic kidney disease (CKD) attributable to ambient fine particulate matter air pollution ≤ 2.5 μm in aerodynamic diameter (PM2.5).

Design: We used the Global Burden of Disease (GBD) study data and methodologies to estimate the 2016 burden of CKD attributable to PM2.5 in 194 countries and territories. Population-weighted PM2.5 levels and incident rates of CKD for each country were curated from the GBD study publicly available data sources.

Setting: GBD global and national data on PM2.5 and CKD.

Participants: 194 countries and territories.

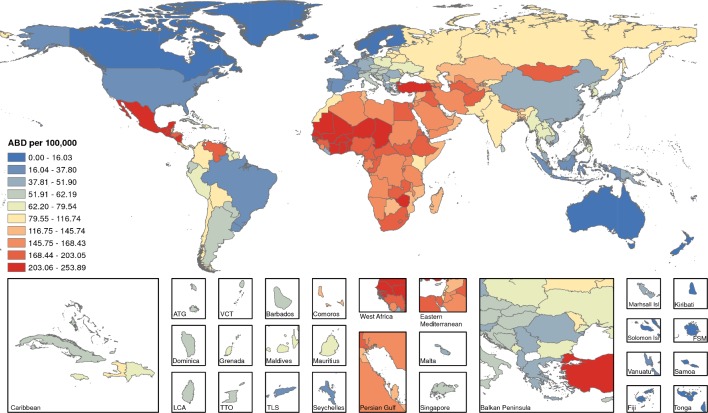
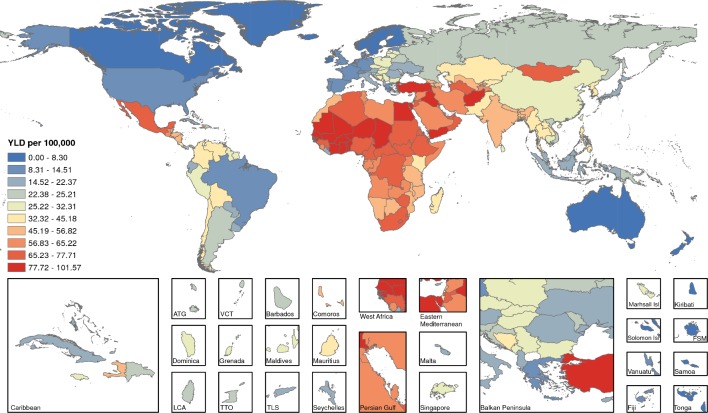
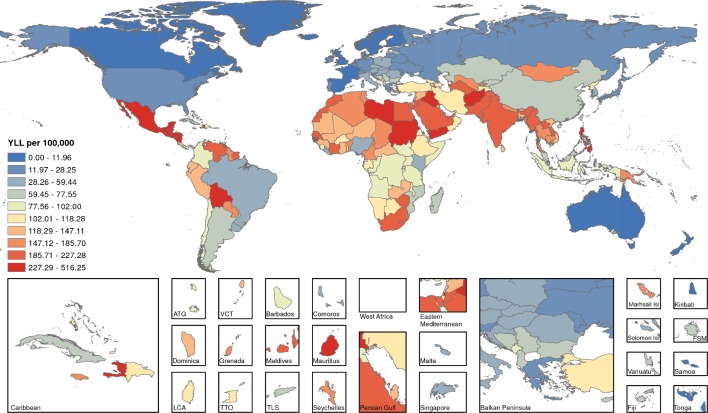
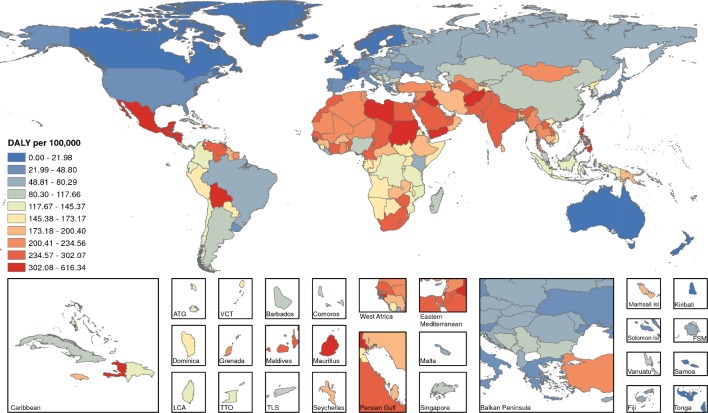
Main outcome measures: We estimated the attributable burden of disease (ABD), years living with disability (YLD), years of life lost (YLL) and disability-adjusted life-years (DALYs).

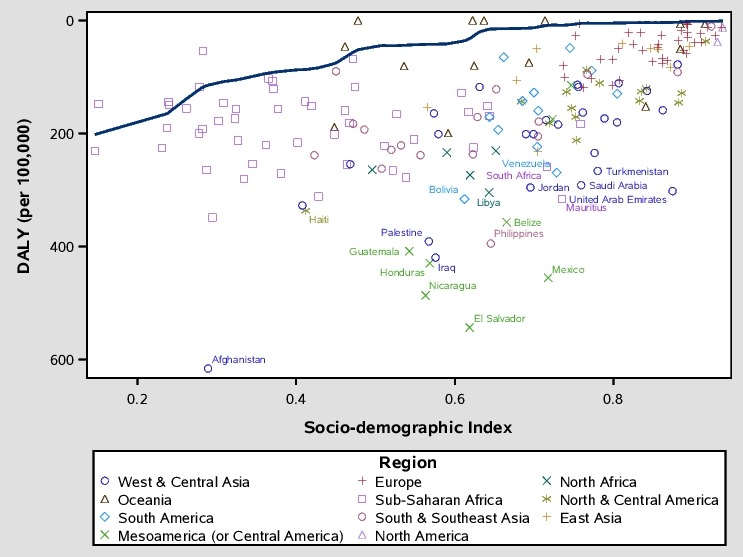
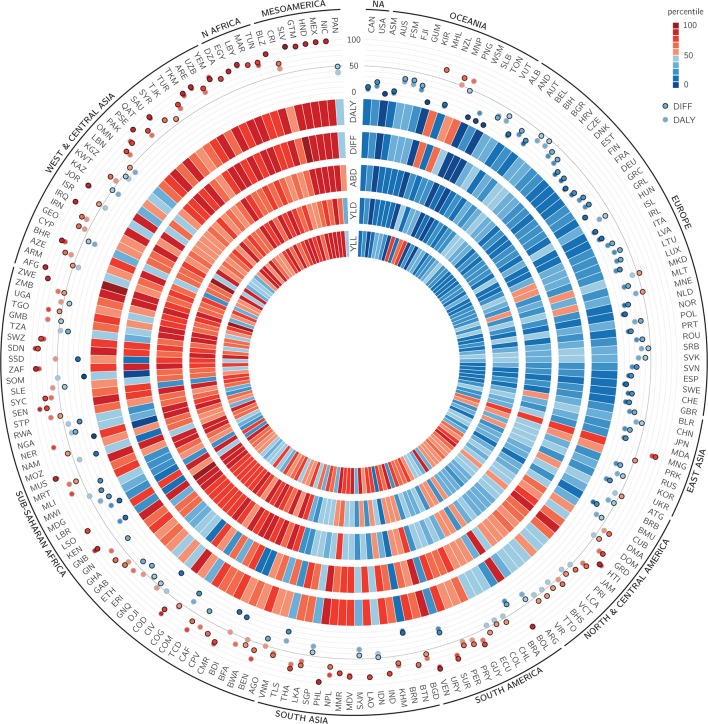
Results: The 2016 global burden of incident CKD attributable to PM2.5 was 6 950 514 (95% uncertainty interval: 5 061 533-8 914 745). Global YLD, YLL and DALYs of CKD attributable to PM2.5 were 2 849 311 (1 875 219-3 983 941), 8 587 735 (6 355 784-10 772 239) and 11 445 397 (8 380 246-14 554 091), respectively. Age-standardised ABD, YLL, YLD and DALY rates varied substantially among geographies. Populations in Mesoamerica, Northern Africa, several countries in the Eastern Mediterranean region, Afghanistan, Pakistan, India and several countries in Southeast Asia were among those with highest age-standardised DALY rates. For example, age-standardised DALYs per 100 000 were 543.35 (391.16-707.96) in El Salvador, 455.29 (332.51-577.97) in Mexico, 408.41 (283.82-551.84) in Guatemala, 238.25 (173.90-303.98) in India and 178.26 (125.31-238.47) in Sri Lanka, compared with 5.52 (0.82-11.48) in Sweden, 6.46 (0.00-14.49) in Australia and 12.13 (4.95-21.82) in Canada. Frontier analyses showed that Mesoamerican countries had significantly higher CKD DALY rates relative to other countries with comparable sociodemographic development.

Conclusions: Our results demonstrate that the global toll of CKD attributable to ambient air pollution is significant and identify several endemic geographies where air pollution may be a significant driver of CKD burden. Air pollution may need to be considered in the discussion of the global epidemiology of CKD.

Keywords: chronic renal failure; nephrology; public health.


Conflict of interest statement

Competing interests: None declared.

Figures

Figure 1
Figure 1
Age-standardised burden (ABD) of incident chronic kidney disease attributable to PM2.5 per 100 000 population. ATG, Antigua and Barbuda; FSM, Federated States of Micronesia; Isl, island; LCA, Saint Lucia; PM2.5, fine particulate matter <2.5 µm; TLS, Timor-Leste; TTO, Trinidad and Tobago; VCT, Saint Vincent and the Grenadines.
Figure 2
Figure 2
Age-standardised years living with disability (YLD) due to incident chronic kidney disease attributable to PM2.5 per 100 000 population. ATG, Antigua and Barbuda; FSM, Federated States of Micronesia; Isl, island; LCA, Saint Lucia; PM2.5, fine particulate matter <2.5 µm; TLS, Timor-Leste; TTO, Trinidad and Tobago; VCT, Saint Vincent and the Grenadines.
Figure 3
Figure 3
Age-standardised years of life lost (YLL) due to incident chronic kidney disease attributable to PM2.5 per 100 000 population. ATG, Antigua and Barbuda; FSM, Federated States of Micronesia; Isl, island; LCA, Saint Lucia; PM2.5, fine particulate matter <2.5 µm; TLS, Timor-Leste; TTO, Trinidad and Tobago; VCT, Saint Vincent and the Grenadines.
Figure 4
Figure 4
Age-standardised disability-adjust life-years (DALYs) due to incident chronic kidney disease attributable to PM2.5 per 100 000 population. ATG, Antigua and Barbuda; FSM, Federated States of Micronesia; Isl, island; LCA, Saint Lucia; PM2.5, fine particulate matter <2.5 µm; TLS, Timor-Leste; TTO, Trinidad and Tobago; VCT, Saint Vincent and the Grenadines.
Figure 5
Figure 5
Frontier analysis of age-standardised disability-adjusted life-years (DALYs) rate per 100 000 population by Sociodemographic Index. Countries with the top 10% effective difference are labelled. Countries are coloured by region.
Figure 6
Figure 6
Plot showing burden of CKD attributable to PM2.5 in 194 countries and territories. Heat map tracks show percentiles, which from inside to outside represent the YLL, YLD, ABD, effective difference and DALY. Scatter plot represents the DALYs (in open circles) and effective difference (in closed circles) percentile, with a reference line at the median. Values are graded, from low to high, as blue to red (on the Brewer palette). Countries are represented by their three-character country code. Regions are ordered from low to high burden clockwise. ABD, attributable burden of disease; DALY, disability-adjusted life-years; DIFF, effective difference; CKD, chronic kidney disease; NA, North America; PM2.5, fine particulate matter <2.5 µm; YLD, years living with disability; YLL, years of life lost.
Figure 7
Figure 7
Age-standardised CKD DALYs (per 100 000) attributable to PM2.5 by World Bank income classification. CKD, chronic kidney disease; DALY, disability-adjusted life-years; PM2.5, fine particulate matter <2.5 µm.

References

    1. Mills KT, Xu Y, Zhang W, et al. . A systematic analysis of worldwide population-based data on the global burden of chronic kidney disease in 2010. Kidney Int 2015;88:950–7. 10.1038/ki.2015.230 - DOI - PMC - PubMed
    1. Bowe B, Xie Y, Xian H, et al. . Geographic variation and us county characteristics associated with rapid kidney function decline. Kidney Int Rep 2017;2:5–17. 10.1016/j.ekir.2016.08.016 - DOI - PMC - PubMed
    1. Brück K, Stel VS, Gambaro G, et al. . CKD prevalence varies across the European General Population. J Am Soc Nephrol 2016;27:2135–47. 10.1681/ASN.2015050542 - DOI - PMC - PubMed
    1. Xie Y, Bowe B, Mokdad AH, et al. . Analysis of the Global Burden of Disease study highlights the global, regional, and national trends of chronic kidney disease epidemiology from 1990 to 2016. Kidney Int 2018;94:567–81. 10.1016/j.kint.2018.04.011 - DOI - PubMed
    1. Black C, van der Veer SN. Unlocking the value of variation in CKD prevalence. J Am Soc Nephrol 2016;27 10.1681/ASN.2015111280 - DOI - PMC - PubMed

Publication types

Substances