. 2019 May 10;364(6440):552-557.
doi: 10.1126/science.aaw5188.

Structures of the M1 and M2 muscarinic acetylcholine receptor/G-protein complexes

Affiliations

Structures of the M1 and M2 muscarinic acetylcholine receptor/G-protein complexes

Shoji Maeda et al. Science. .

Abstract

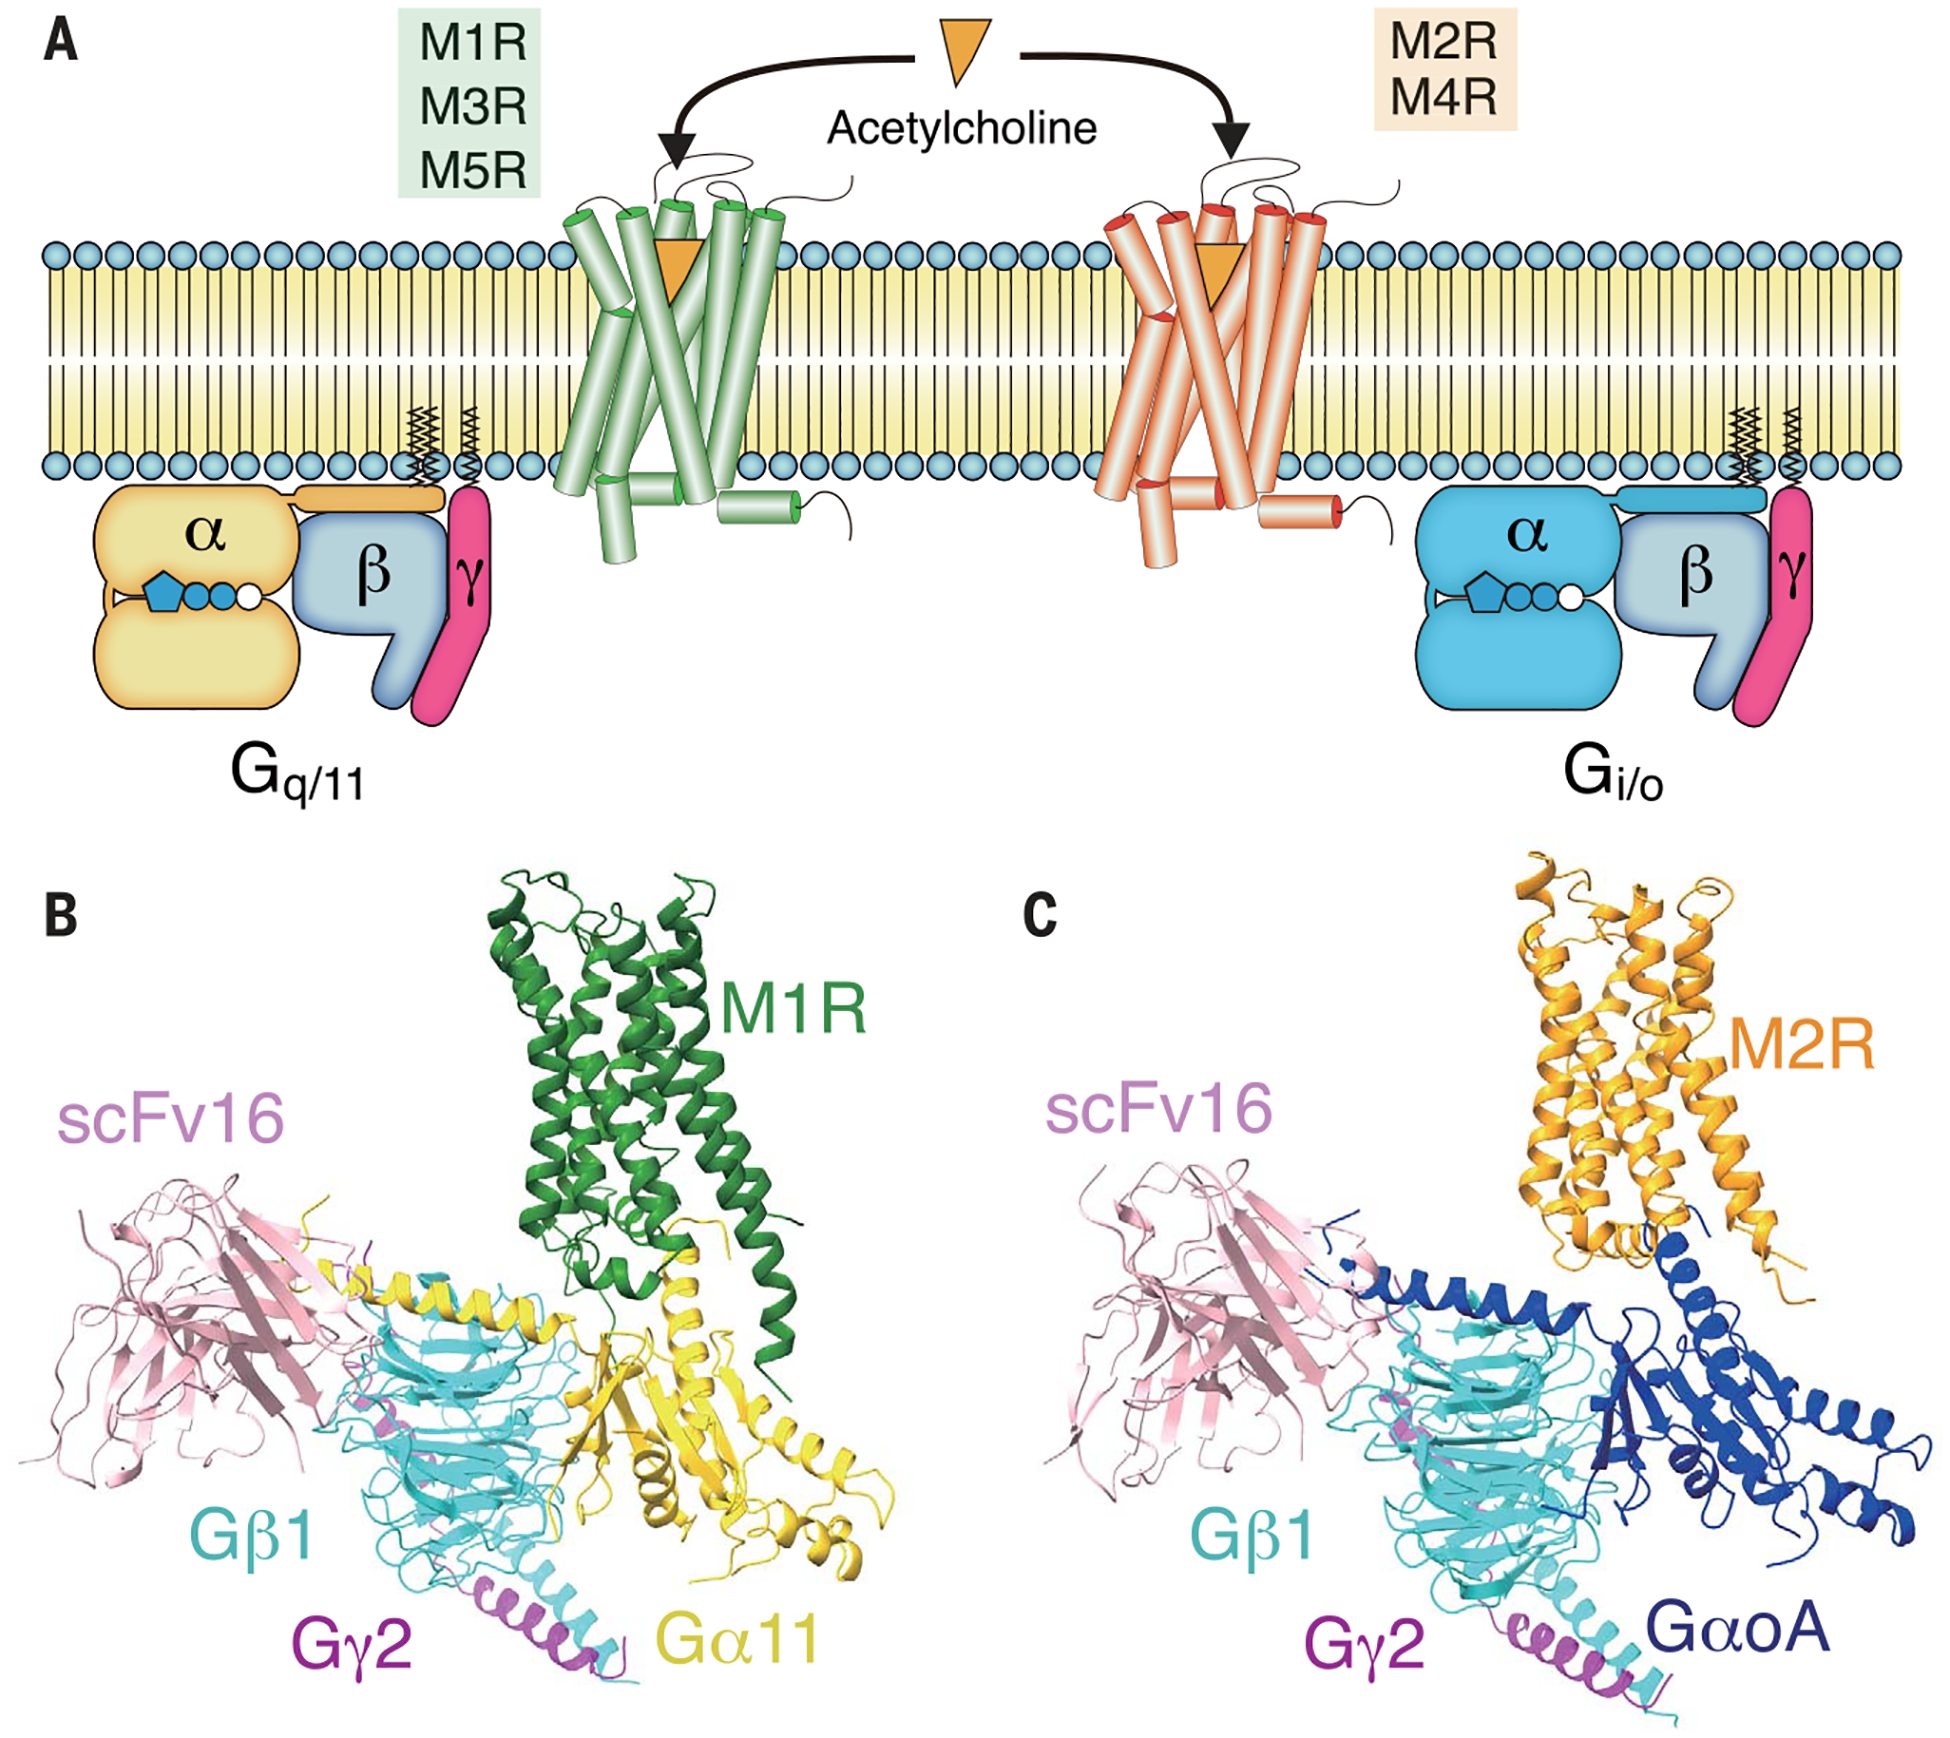
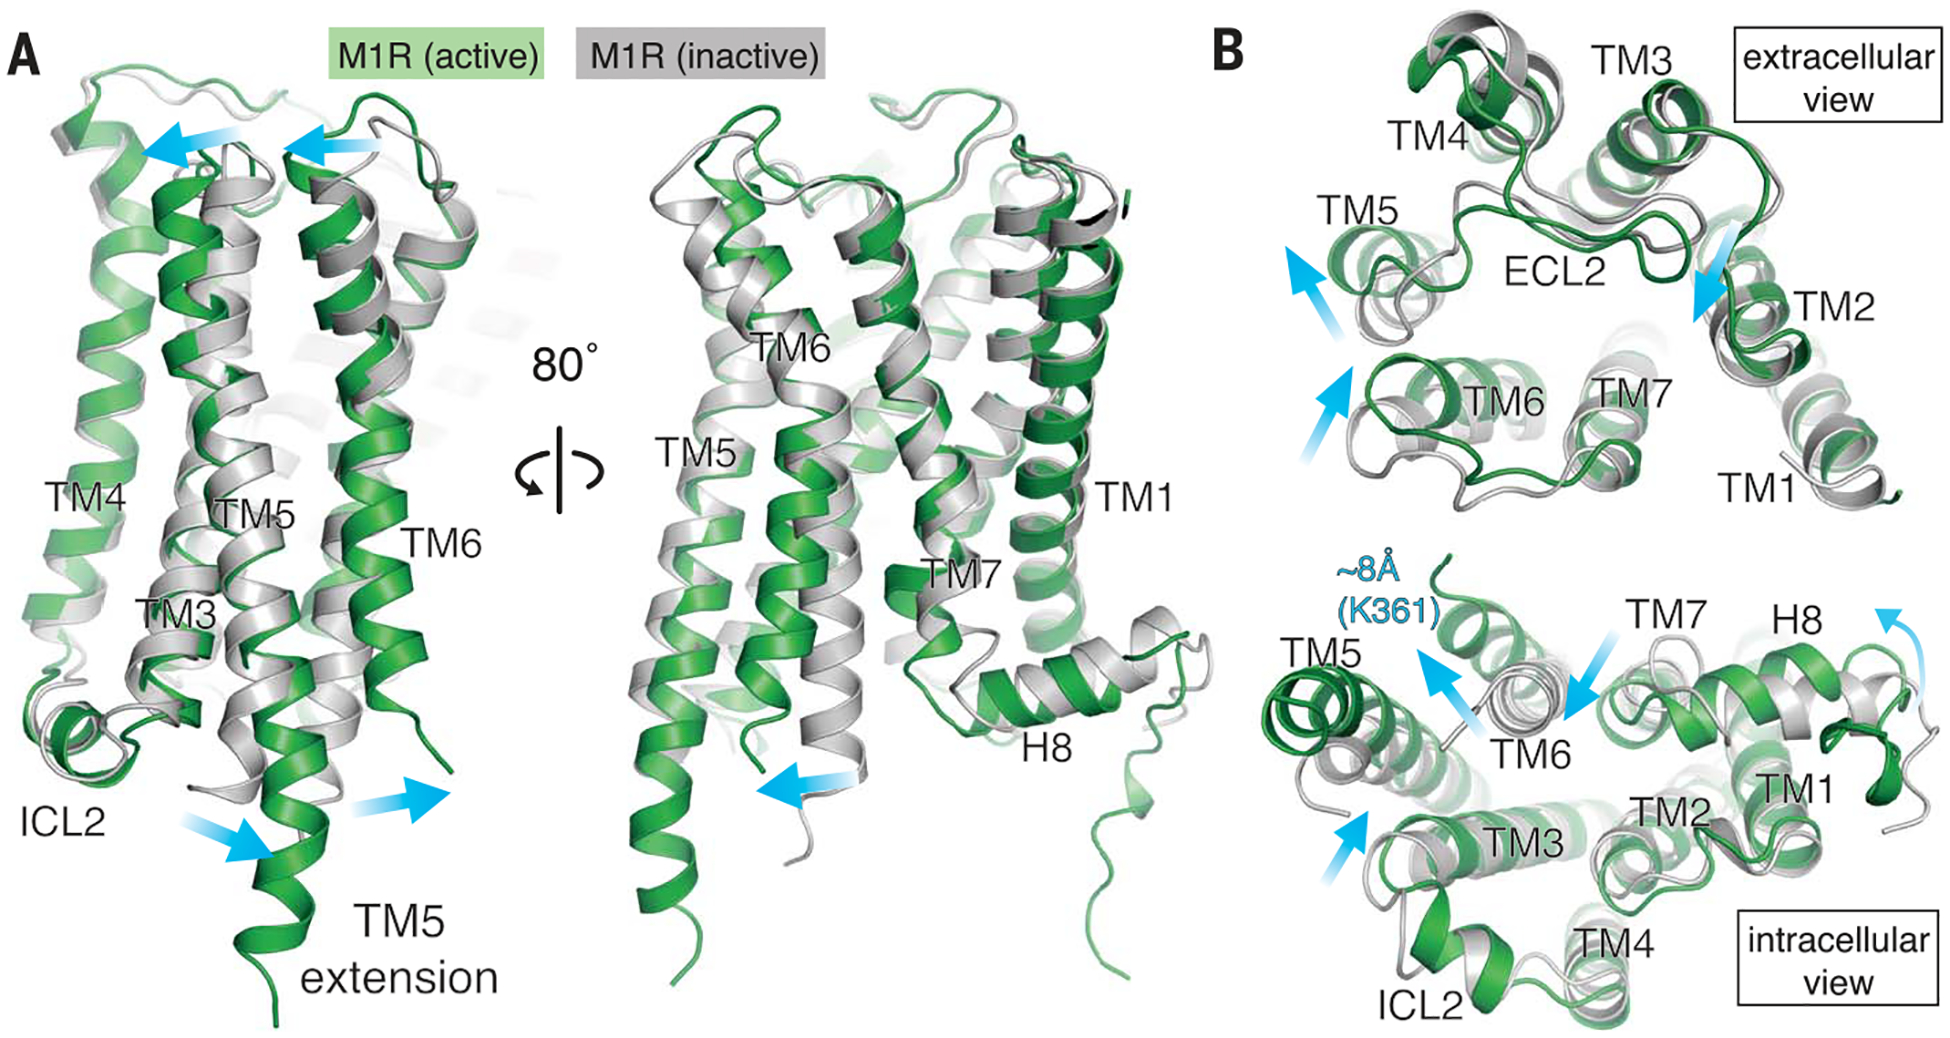
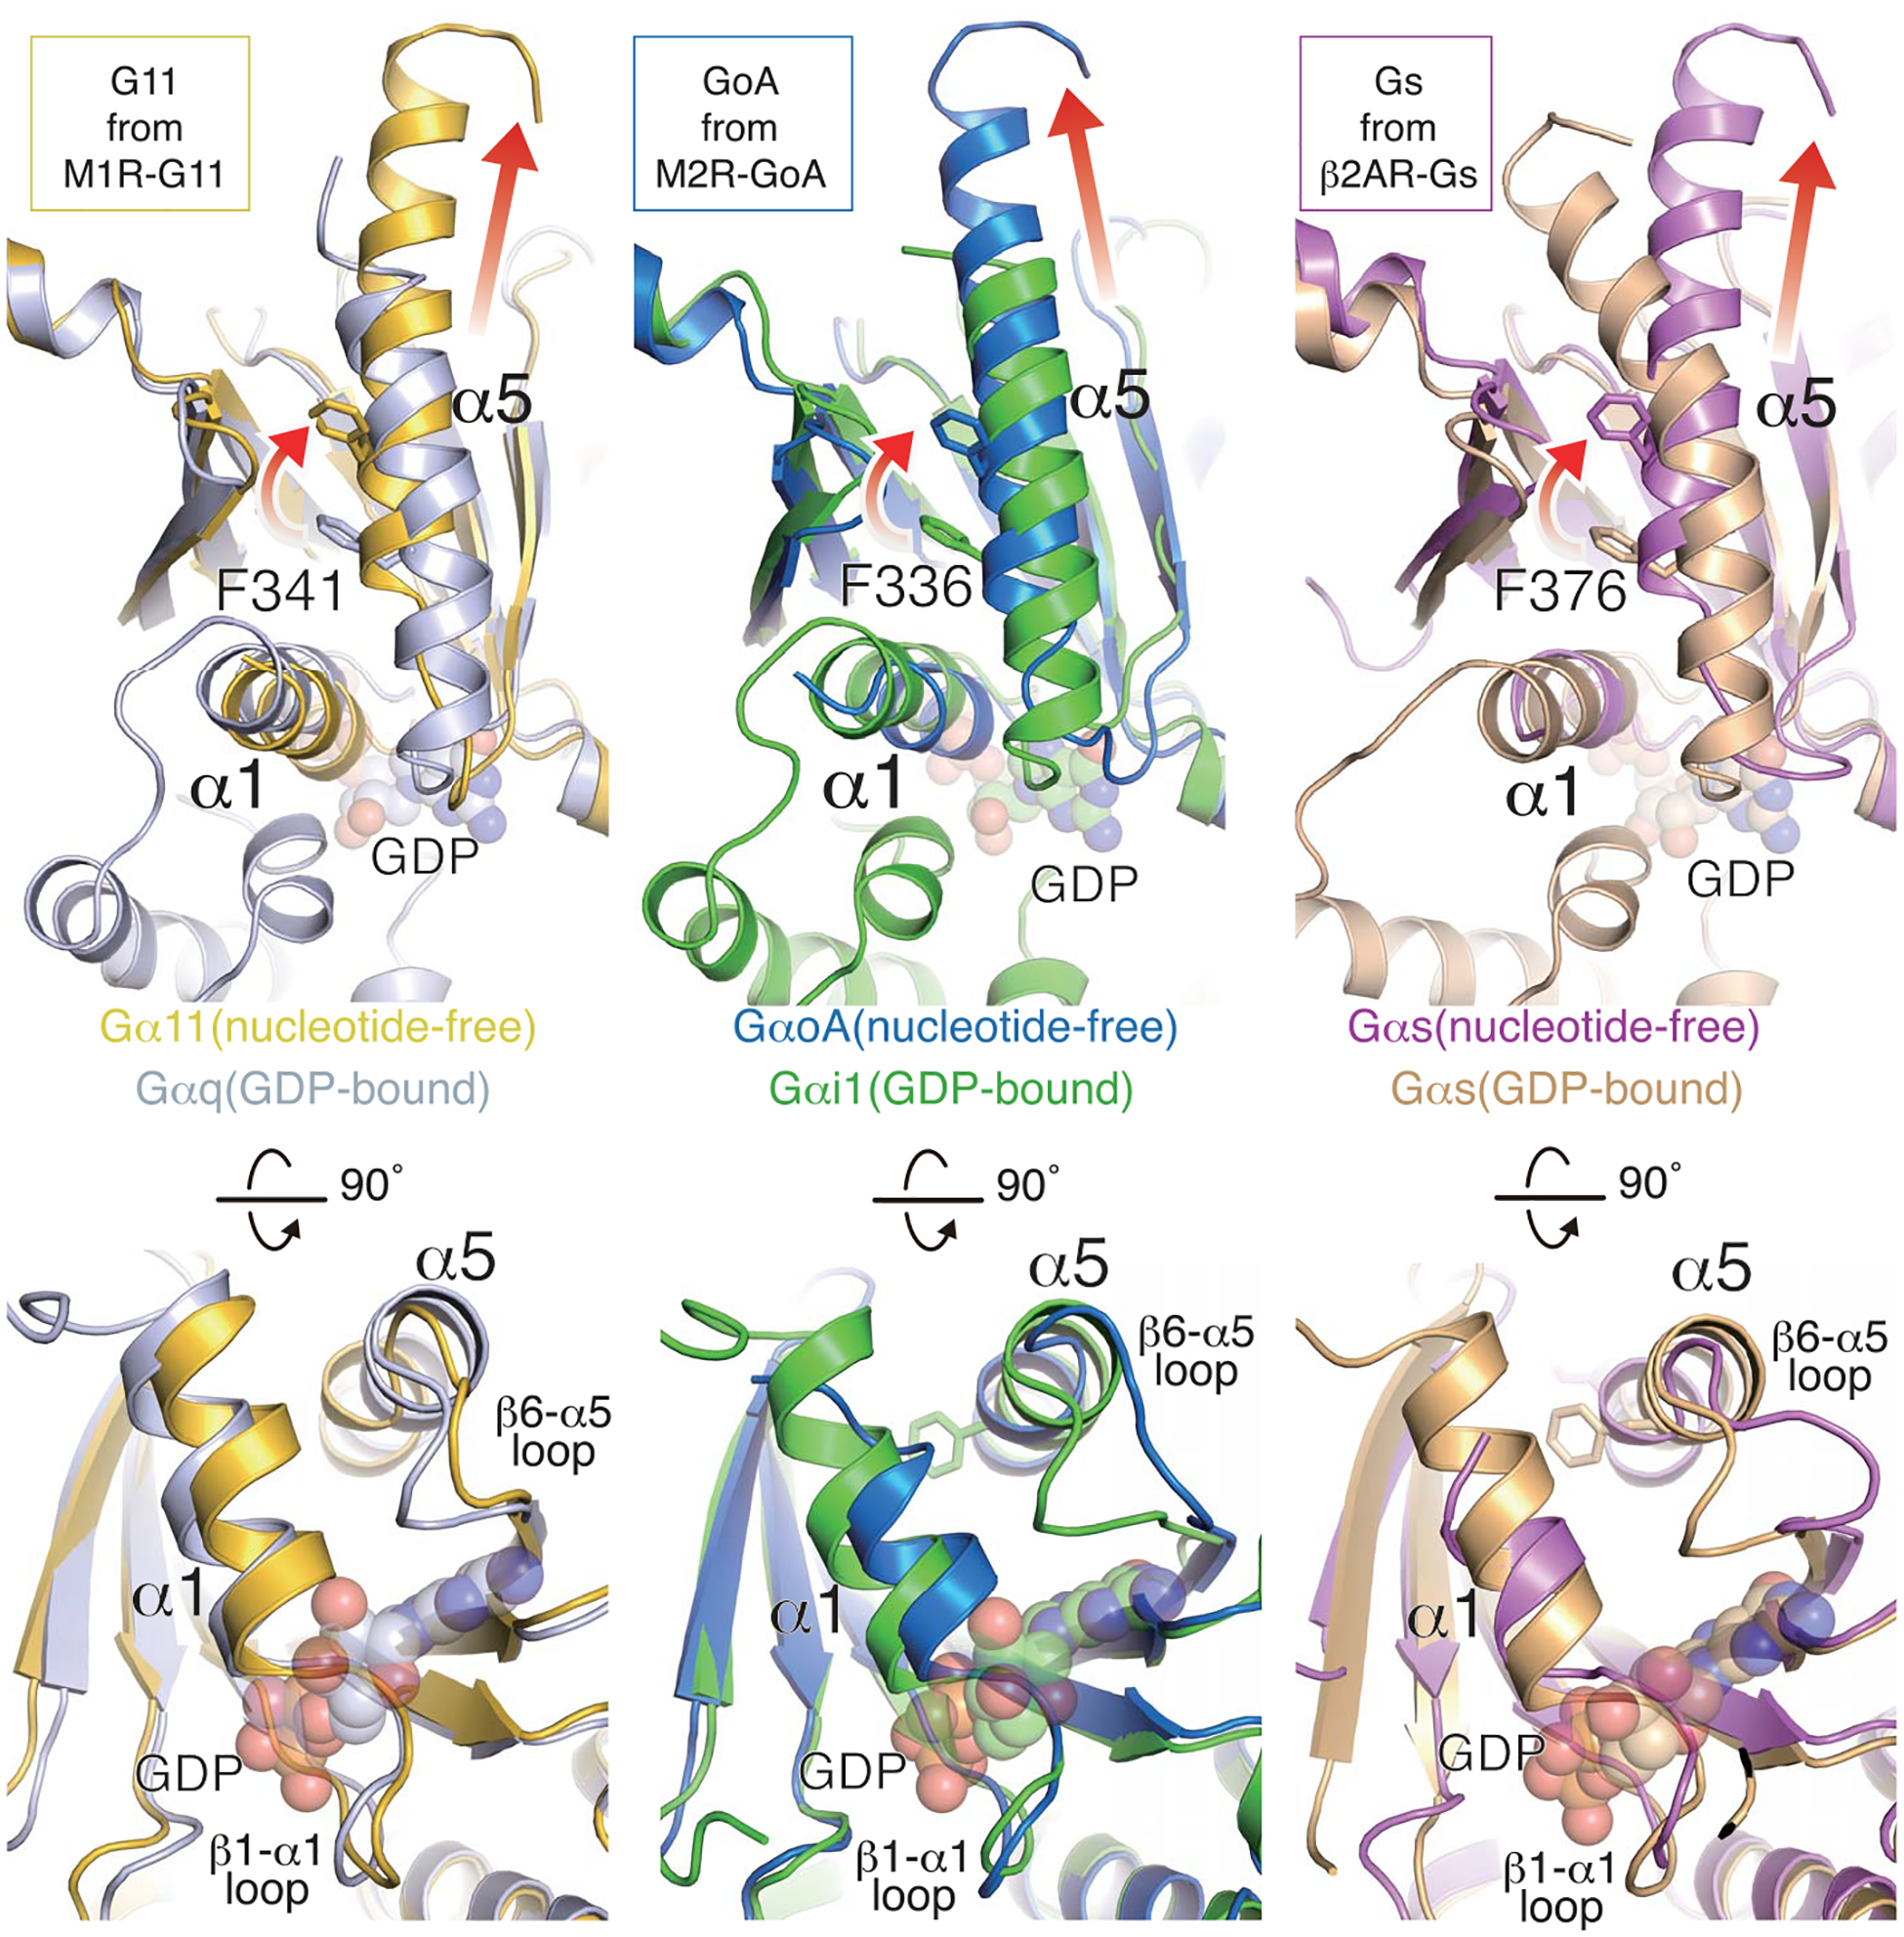
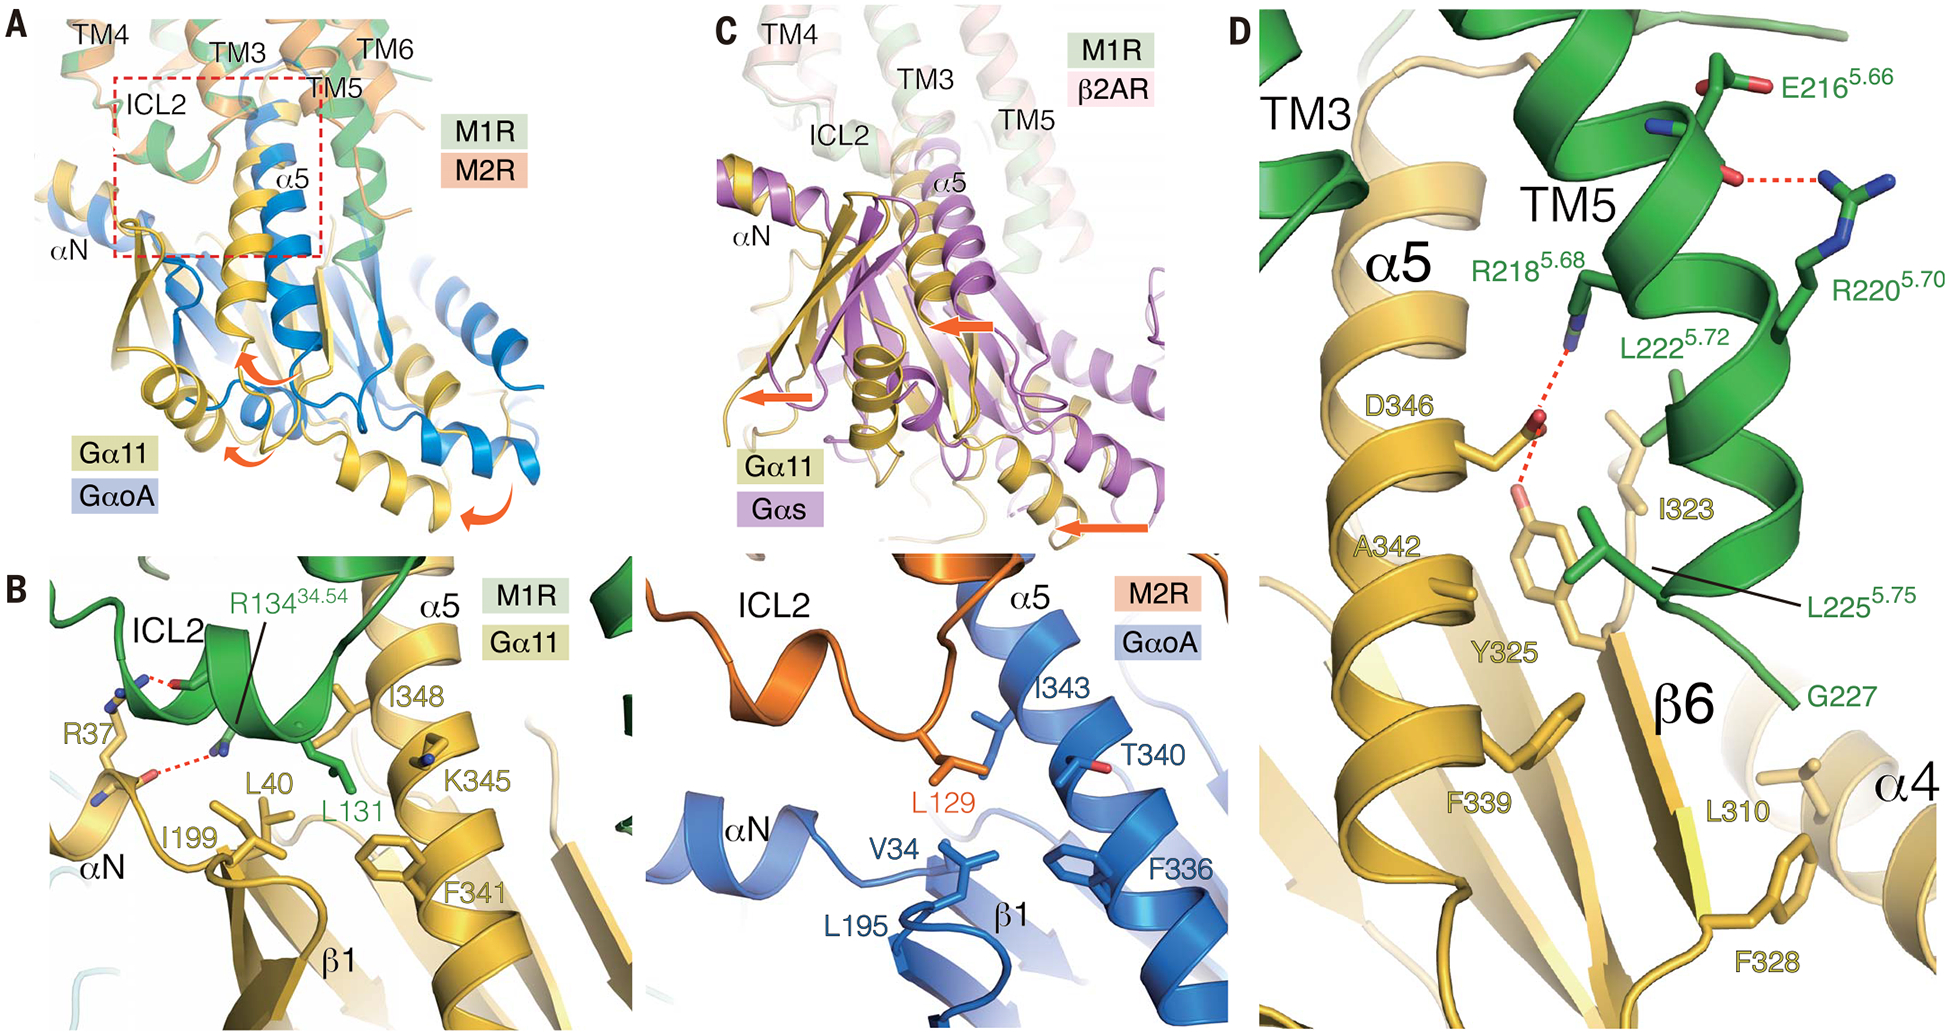
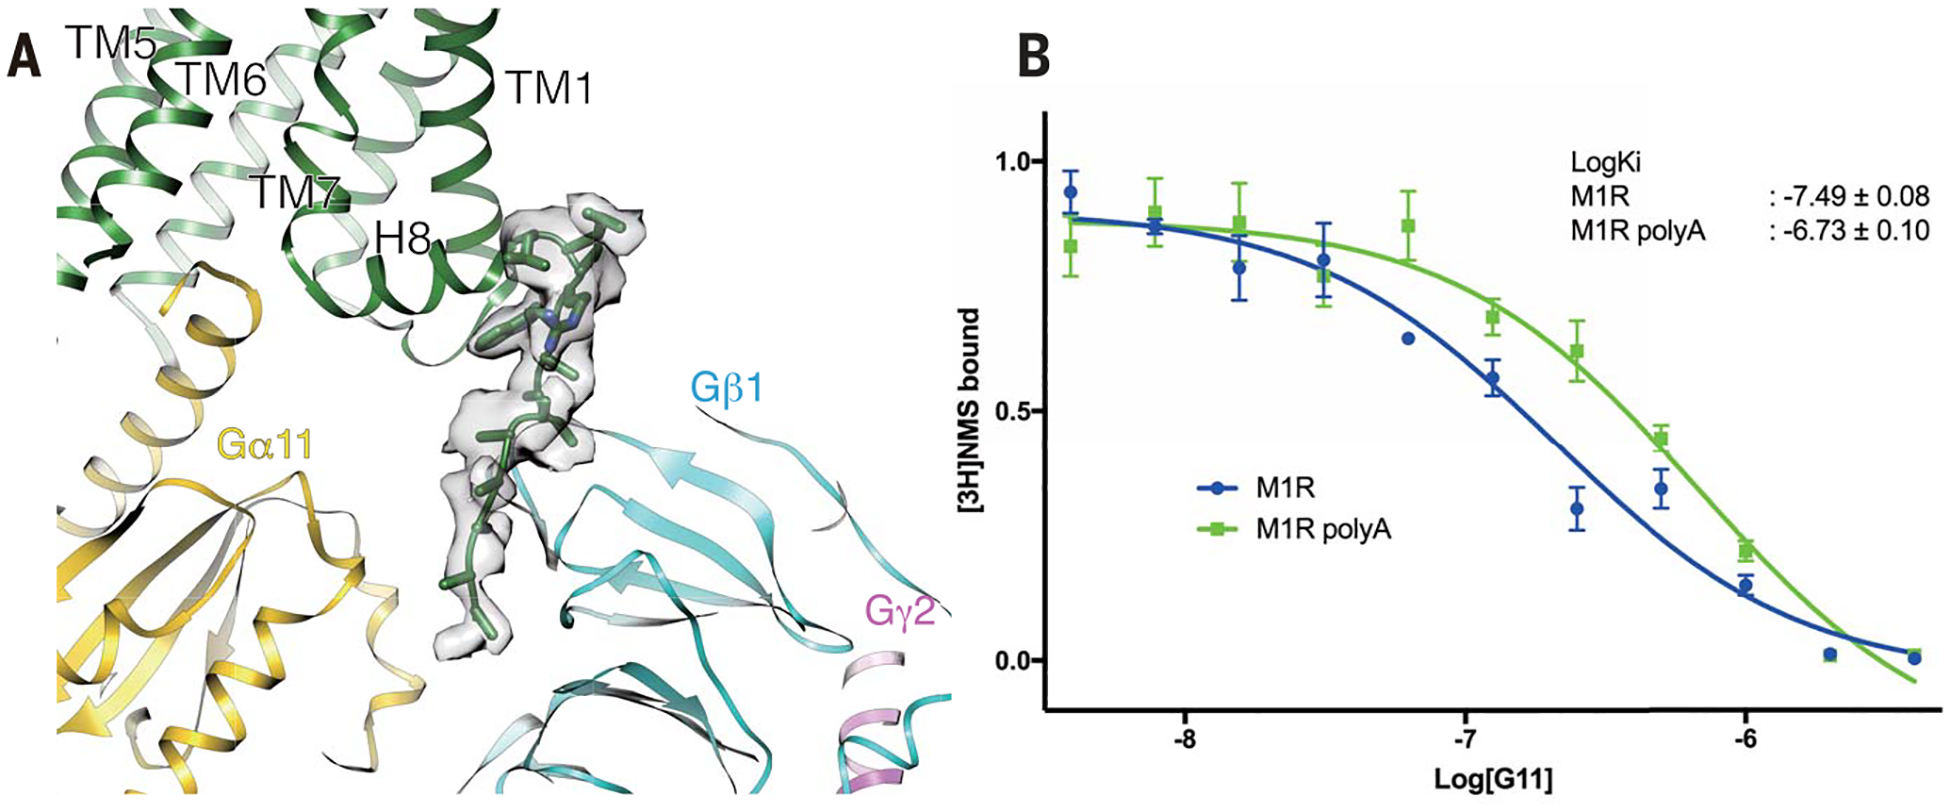
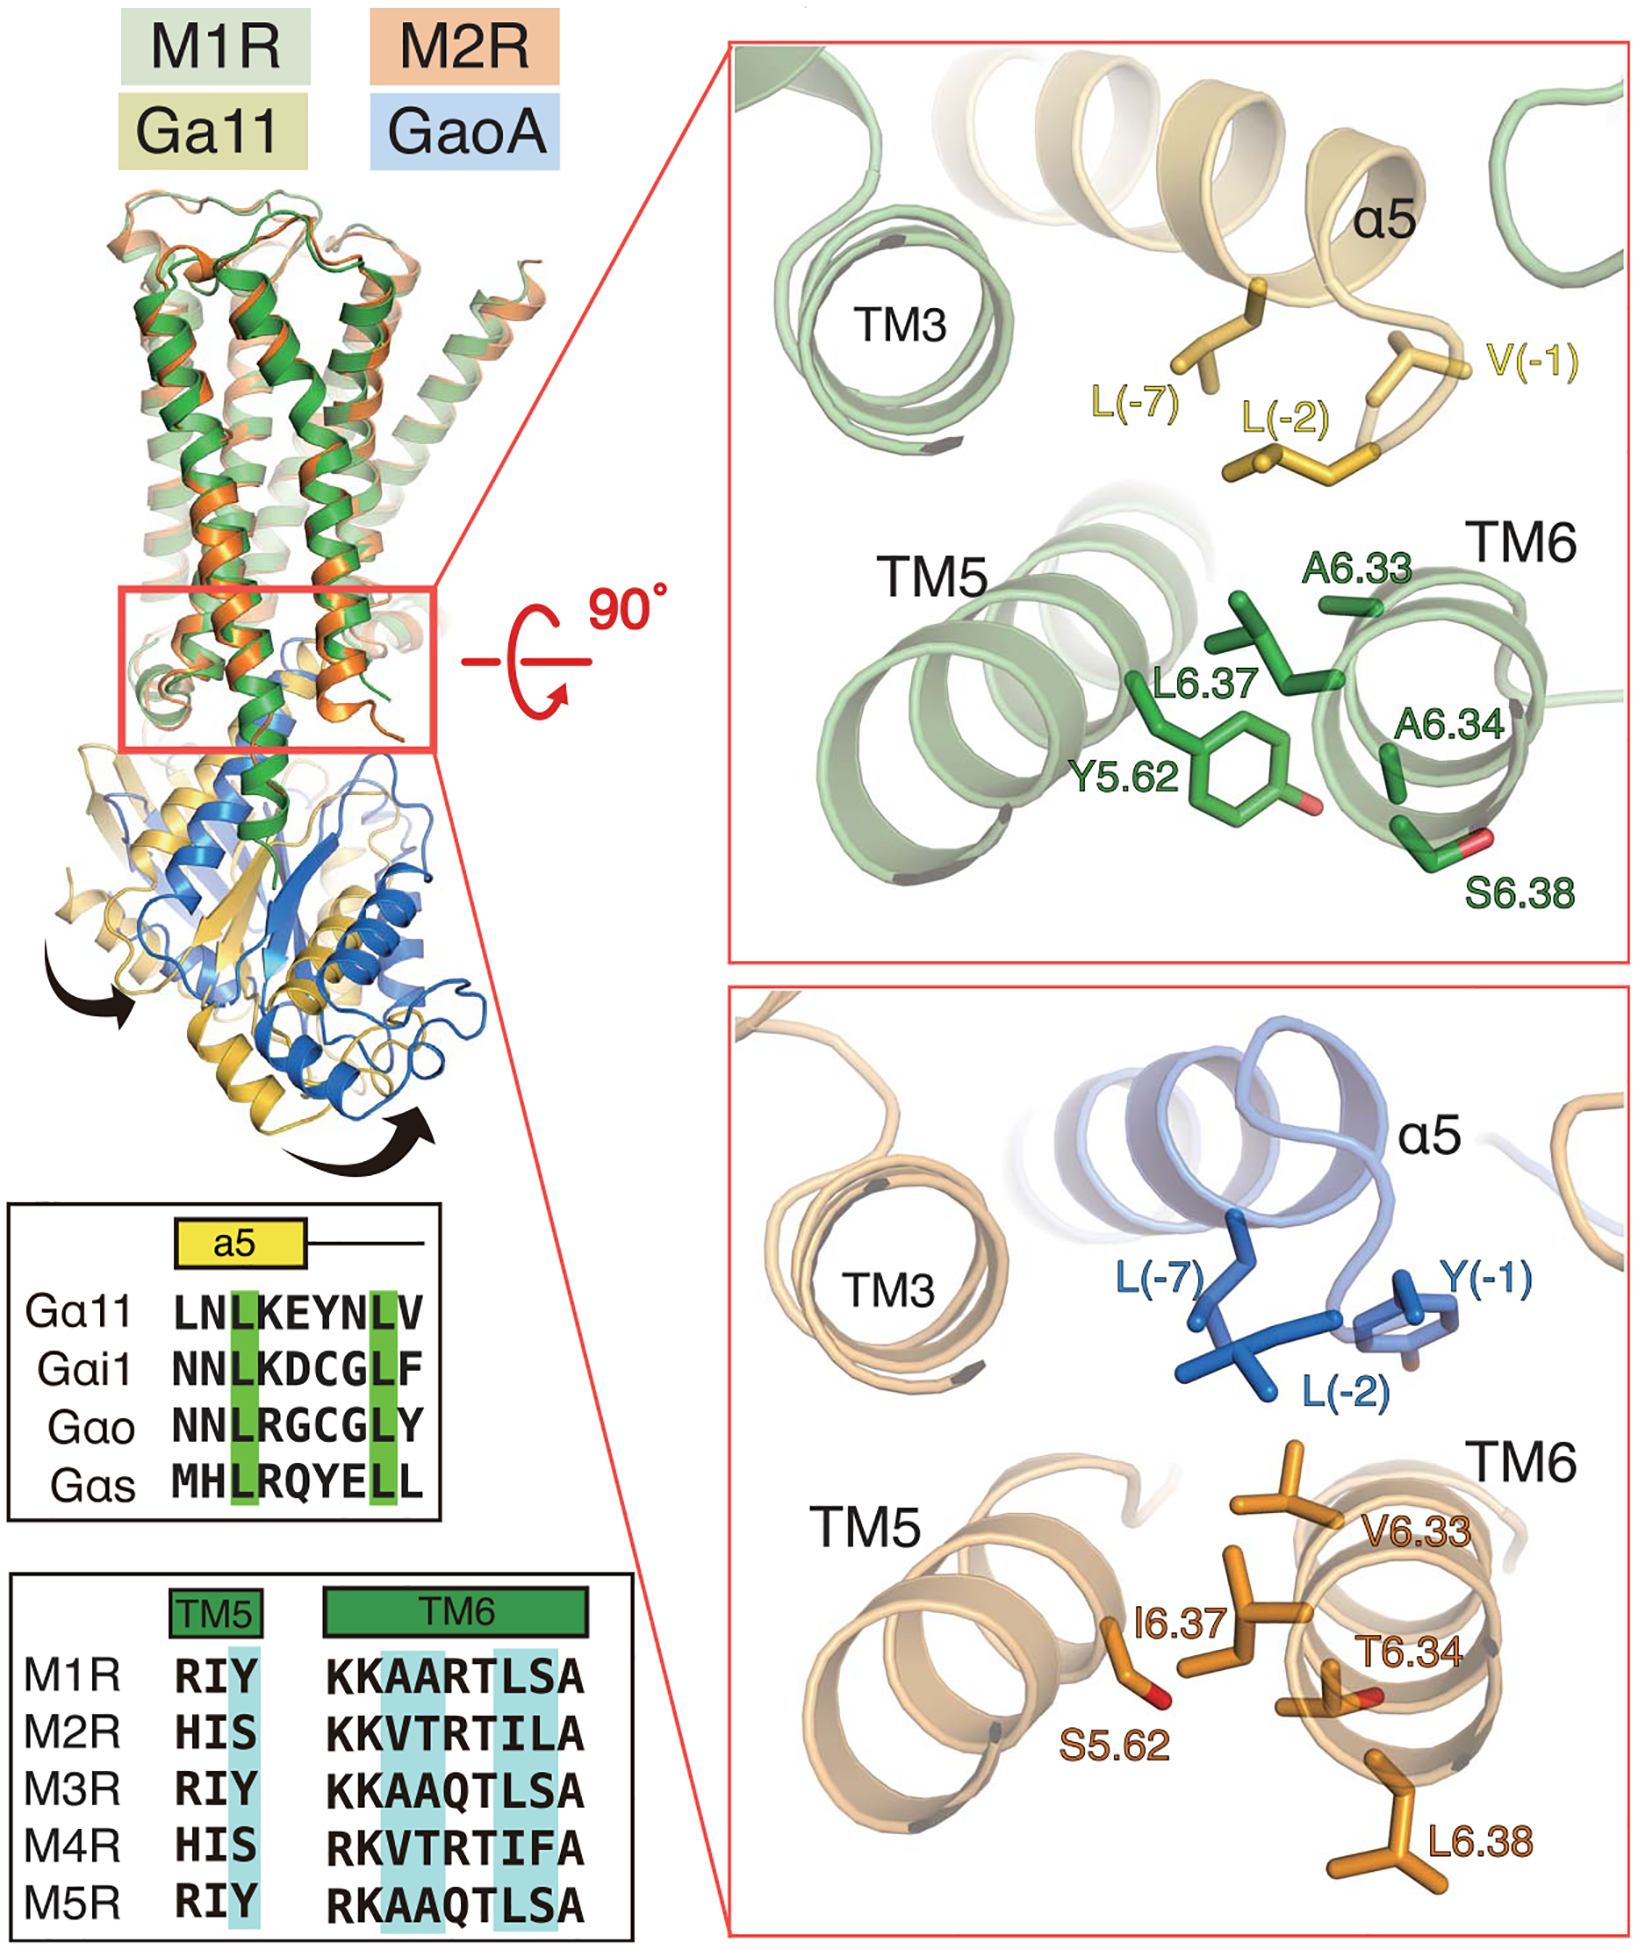
Muscarinic acetylcholine receptors are G protein-coupled receptors that respond to acetylcholine and play important signaling roles in the nervous system. There are five muscarinic receptor subtypes (M1R to M5R), which, despite sharing a high degree of sequence identity in the transmembrane region, couple to different heterotrimeric GTP-binding proteins (G proteins) to transmit signals. M1R, M3R, and M5R couple to the Gq/ 11 family, whereas M2R and M4R couple to the Gi/ o family. Here, we present and compare the cryo-electron microscopy structures of M1R in complex with G11 and M2R in complex with GoA The M1R-G11 complex exhibits distinct features, including an extended transmembrane helix 5 and carboxyl-terminal receptor tail that interacts with G protein. Detailed analysis of these structures provides a framework for understanding the molecular determinants of G-protein coupling selectivity.


Conflict of interest statement

Competing interests: B.K.K. is a cofounder of and consultant for ConfometRx. The remaining authors declare no competing interests.

Figures

Fig. 1.
Fig. 1.. Overall architectures of M1R-G11iN-scFv16 and M2R-GoAiN-scFv16 complexes.
(A) Signaling selectivity among muscarinic receptors. M1R, M3R, and M5R predominantly signal through Gq/11-type G protein, whereas M2R and M4R couple to Gi/o (B and C). Cryo-EM structures of M1R-G11iN-scFv16 and M2R-GoAiN-scFv16 complex. Color code for the proteins is as follows: M1R (green), M2R (orange), Gα11iN (gold), GaoAiN (blue), Gβ1 (cyan), Gg2 (magenta), scFv16 (pink).
Fig. 2.
Fig. 2.. Comparison between inactive and active M1R.
(A) Comparison of M1R between inactive (PDB code 5CXV) and active form viewed from the side. (B) Extracellular view (top), and intracellular view (bottom) of superposed M1Rs. Active and inactive M1R are colored in green and gray, respectively. Conformational changes are shown with blue arrows.
Fig. 3.
Fig. 3.. Structural comparison of G proteins.
Structural changes upon receptor engagement and nucleotide release in Gαq/11, Gαi1, and Gαs. The GDP-bound structure is superimposed onto the nucleotide-free state for each family member. Rotation and translation of the α5 helix is shown in the upper panels, and a1 helix and β6-α5 loop displacements are shown in the lower panels. The PDB code for each structure is as follows: GDP-bound Gαq (3AH8), GDP-bound Gαi1 (1GP2), nucleotide-free Gαi1 (6DDE), GDP-bound Gs (6EG8), nucleotide-free Gs (3SN6).
Fig. 4.
Fig. 4.. Comparison of the structures of M1R-G11 and M2R-GoA.
(A) Superposition of M1R-G11 and M2R-GoA complexes with the alignment based on the receptor. Rotational shift from GoA to G11 is depicted with curved arrows. Enlarged area in the panel (B) is shown as a broken rectangle. (B) View of ICL2 interface between the G protein on M1R-G11 (left) and M2R-GoA (right). (C) Superposition of β2AR-Gs and M1R-G11 complexes with the alignment based on the receptor. A translational shift is shown by straight arrows. (D) The extended helical structure from TM5 interacts with G11; interface residues are depicted as sticks.
Fig. 5.
Fig. 5.. Interaction of the M1R C terminus with G-protein α/β interface.
(A) Density of the C terminus of M1R positioned at the interface between Gα11 and Gβ subunit. (B) Titration of G11 in the competition ligand-binding assay using iperoxo and [3H]NMS as probes. Coupling of M1R to G11 increases the affinity for iperoxo, which displaces [3H]NMS. G11 couples to the poly(A) mutant of the C-terminal basic region of M1R with lower affinity. Data points represent the mean ± SEM of three experiments performed in triplicate.
Fig. 6.
Fig. 6.. Comparison of α5/TM5/TM6 interactions in M1R-G11 and M2R-GoA complexes.
The right panels show a rotated view of the α5/TM5/TM6 interface for M1R-G11 and M2R-GoA complexes indicated in the red box on the left panel. Residues in M1R and M2R that have been indicated by mutagenesis to be important for G-protein coupling specificity are shown as sticks on the receptor structure and are highlighted in blue in the sequence alignments of TM5 and TM6 (lower left).

References

    1. Wess J, Annu. Rev. Pharmacol. Toxicol 44, 423–450 (2004). - PubMed
    1. Langmead CJ, Watson J, Reavill C, Pharmacol. Ther 117, 232–243 (2008). - PubMed
    1. Lebois EP, Thorn C, Edgerton JR, Popiolek M, Xi S, Neuropharmacology 136, 362–373 (2018). - PubMed
    1. Thomsen M, Sørensen G, Dencker D, Neuropharmacology 136, 411–420 (2018). - PMC - PubMed
    1. Haga K et al., Nature 482, 547–551 (2012). - PMC - PubMed

Publication types

MeSH terms

Substances