. 2019 May 9;10(1):2120.
doi: 10.1038/s41467-019-09925-0.

Mortality causes universal changes in microbial community composition

Affiliations

Mortality causes universal changes in microbial community composition

Clare I Abreu et al. Nat Commun. .

Abstract

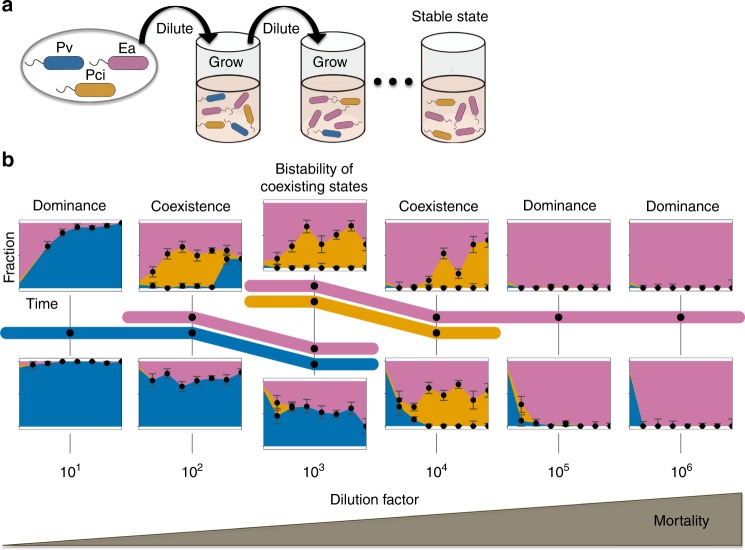
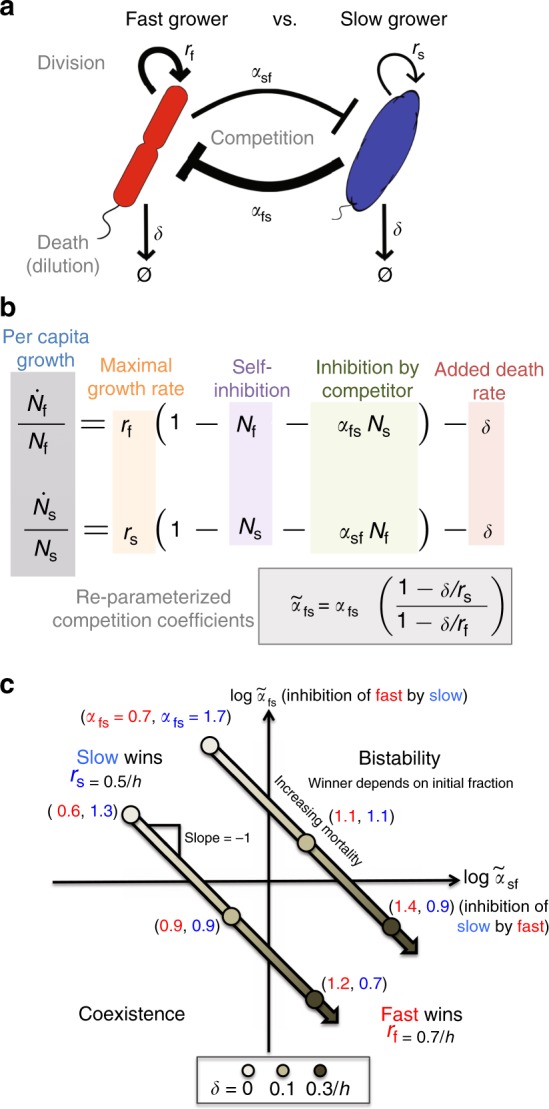
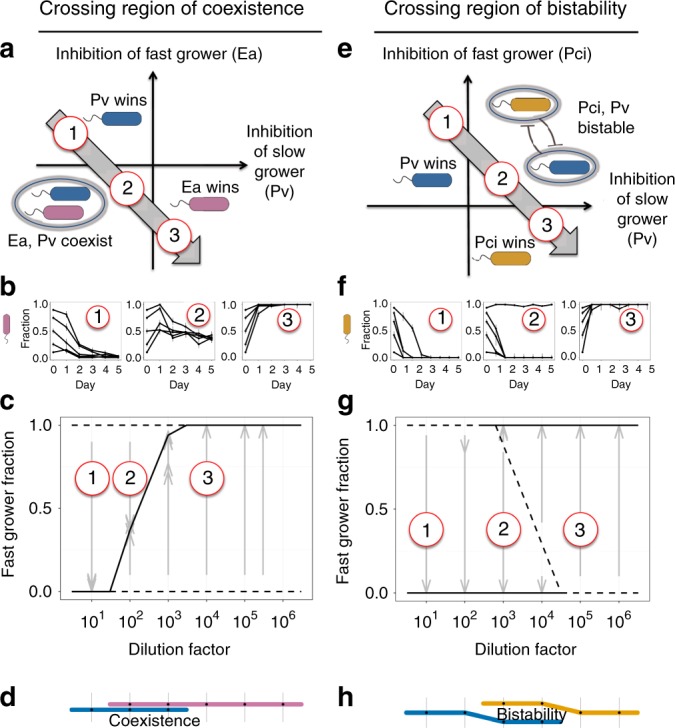
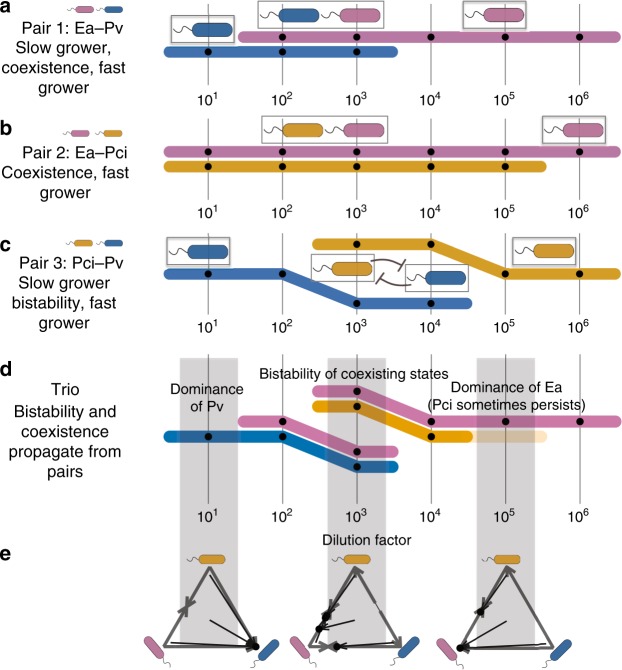
All organisms are sensitive to the abiotic environment, and a deteriorating environment can cause extinction. However, survival in a multispecies community depends upon interactions, and some species may even be favored by a harsh environment that impairs others, leading to potentially surprising community transitions as environments deteriorate. Here we combine theory and laboratory microcosms to predict how simple microbial communities will change under added mortality, controlled by varying dilution. We find that in a two-species coculture, increasing mortality favors the faster grower, confirming a theoretical prediction. Furthermore, if the slower grower dominates under low mortality, the outcome can reverse as mortality increases. We find that this tradeoff between growth and competitive ability is prevalent at low dilution, causing outcomes to shift dramatically as dilution increases, and that these two-species shifts propagate to simple multispecies communities. Our results argue that a bottom-up approach can provide insight into how communities change under stress.


Conflict of interest statement

The authors declare no competing interests.

Figures

Fig. 1
Fig. 1
Increasing dilution causes striking shifts in a three-species community. a To probe how added mortality changes community composition, we cocultured three soil bacteria over a range of dilution factors. Cells were inoculated and allowed to grow for 24 h before being diluted into fresh media. This process was continued for 7 days, until a stable equilibrium was reached. The magnitude of the dilution factor (10–106) determines the fraction of cells discarded, and thus the amount of added mortality. b We began with a three-species community (Enterobacter aerogenes (Ea), Pseudomonas citronellolis (Pci), and Pseudomonas veronii (Pv)), initialized from four starting fractions at each dilution factor. The outcomes of two of the starting fractions are shown (see Supplementary Fig. 8b for remaining starting fractions), along with a subway map, where survival of species is represented with colors assigned to each species. Black dots indicate where data were collected, while colors indicate the range over which a given species is inferred to survive. Species Pv dominates at the lowest dilution factor, and Ea dominates at the highest dilution factors. The grouping of two colors represents coexistence of two species, whereas the two levels at dilution factor 103 indicate bistability, where both coexisting states, EaPv and EaPci, are stable and the starting fraction determines which stable state the community reaches. Error bars are the SD of the beta distribution with Bayes' prior probability (see “Methods”). Source data are provided as a Source Data file
Fig. 2
Fig. 2
An increasing global mortality rate is predicted to favor the fast grower. a, b Here we illustrate the parameters of the Lotka–Volterra (LV) interspecific competition model with added mortality: population density N, growth r, death δ, and the strengths of inhibition αsf and αfs (subscript f for fast grower and s for slow grower). Here we assume a continuous death rate, but in the model, the outcome is the same for a discrete process, such as our daily dilution factor (Supplementary Note 2). The width of arrows in a corresponds to an interesting case that we observe experimentally, in which the fast grower is a relatively weak competitor. c The outcomes of the LV model without mortality depend solely upon the competition coefficients α, and the phase space is divided into one quadrant per outcome. If the slow grower is a strong competitor, it can exclude the fast grower. Imposing a uniform mortality rate δ on the system, however, favors the faster grower by making the re-parameterized competition coefficients α~ depend on r and δ. Given that a slow grower dominates at low or no added death, the model predicts that coexistence or bistability will occur at intermediate added death rates before the outcome transitions to dominance of the fast grower at high added death (Supplementary Note 1). Two numerical examples show that the values of α (in the absence of added mortality) determine whether the trajectory crosses the bistability or coexistence region as mortality increases
Fig. 3
Fig. 3
In pairwise coculture experiments, increasing dilution favors the faster grower. a Experimental results are shown from a coculture experiment with Pv (blue) and Ea (pink). b Left panel: Despite its slow growth rate, Pv excludes faster grower Ea at the lowest dilution factor. Middle panel: Increasing death rate causes the outcomes to traverse the coexistence region of the phase space. Right panel: As predicted, fast-growing Ea dominates at high dilution factor. Error bars are the SD of the beta distribution with Bayes' prior probability (see “Methods”). c An experimental bifurcation diagram shows stable points with a solid line and unstable points with a dashed line. The stable fraction of coexistence shifts in favor of the fast grower as dilution increases. Gray arrows show experimentally measured time trajectories, beginning at the starting fraction and ending at the final fraction. d A “subway map” denotes survival/extinction of a species at a particular dilution factor with presence/absence of the species color. e, f Pv outcompeted another fast grower Pci (yellow) at low dilution factors, but the pair became bistable instead of coexisting as dilution increased; the unstable fraction can be seen to shift in favor of the fast grower (g). h Two levels in the subway map show bistability. Source data are provided as a Source Data file
Fig. 4
Fig. 4
Tradeoff between growth and competitive ability leads to dependence of experimental outcome on dilution factor. The LV model predicts that increasing dilution will favor faster-growing species over slower-growing ones. If fast growers dominate at low dilution factors, though, no changes in outcome will be expected. Changes in outcome are therefore most dramatic when slow growers are strong competitors at low dilution, exhibiting a tradeoff between growth rate and competitive ability. a This tradeoff was pervasive in our system: slower growth rates resulted in higher competitive scores at the lowest dilution factor. Growth rate was calculated with OD600 measurements of the time taken for monocultures to reach a threshold density within the exponential phase; error bars represent the SEM of replicates (n = 21, per species) (Supplementary Fig. 3). Competitive score was calculated by averaging fraction of a given species across all pairwise competitive outcomes; error bars were calculated by bootstrapping, where replicates of mean experimental outcomes of a given pair were sampled 5000 times with replacement (n = 34, per species, per dilution factor). b The competitive scores in a are extended to all dilution factors. The slowest grower’s score monotonically decreases with dilution, while the fast growers’ scores increase, and an intermediate grower peaks at intermediate dilution factor. A similar pattern was seen in data from experiments in a complex growth medium (Supplementary Fig. 7). c At high dilution factors, the order of scores is reversed. d At low dilution factors 10 and 102, competitive ability is negatively correlated with growth rate; the correlation becomes positive above dilution factor 103. Error bars are the standard error coefficients given by the linear regression function lm in R. Source data are provided as a Source Data file
Fig. 5
Fig. 5
Coexistence and bistability propagate from pair to trio, as predicted by assembly rules. ac Subway maps show pairwise outcome trajectories across changing dilution factor (DF), as explained in Figs. 1 and 3. The fast grower’s line is always plotted above the slow grower’s line. Of the three pairs that make up the community EaPciPv, two are coexisting (a, b) and one is bistable (c). d The pairwise assembly rules state that a species will survive in a community if it survives in all corresponding pairs. At DF 10, Ea and Pci coexist, but both are excluded by Pv. The rules correctly predict that Pv will dominate in the trio. Because both species can be excluded in a bistable pair, a bistable pairwise outcome propagates to the trio as more than one allowed state. Each of the bistable species can be seen separately coexisting with Ea at DF 103, as they do in pairs. The assembly rules failed at DF 105 for three out of four starting conditions: Pci usually goes extinct when it should coexist with Ea. e Three-species competition results are shown in simplex plots. Arrows begin and end at initial and final fractions, respectively. Edges represent pairwise results, and black dots represent trio results

References

    1. Tilman, D. Resource Competition and Community Structure (Princeton University Press, Princeton, NJ, 1982).
    1. Wellborn GA, Skelly DK, Werner EE. Mechanisms creating community structure across a freshwater habitat gradient. Annu. Rev. Ecol. Syst. 1996;27:337–363. doi: 10.1146/annurev.ecolsys.27.1.337. - DOI
    1. DÍez I, Secilla A, Santolaria A, Gorostiaga JM. Phytobenthic intertidal community structure along an environmental pollution gradient. Mar. Pollut. Bull. 1999;38:463–472. doi: 10.1016/S0025-326X(98)90161-8. - DOI
    1. Yergeau E, et al. Size and structure of bacterial, fungal and nematode communities along an Antarctic environmental gradient. FEMS Microbiol. Ecol. 2007;59:436–451. doi: 10.1111/j.1574-6941.2006.00200.x. - DOI - PubMed
    1. Lessard JP, Sackett TE, Reynolds WN, Fowler DA, Sanders NJ. Determinants of the detrital arthropod community structure: the effects of temperature and resources along an environmental gradient. Oikos. 2011;120:333–343. doi: 10.1111/j.1600-0706.2010.18772.x. - DOI

MeSH terms

LinkOut - more resources