. 2019 May 9;10(1):2119.
doi: 10.1038/s41467-019-10146-8.

Targeted removal of epigenetic barriers during transcriptional reprogramming

Affiliations

Targeted removal of epigenetic barriers during transcriptional reprogramming

Valentin Baumann et al. Nat Commun. .

Abstract

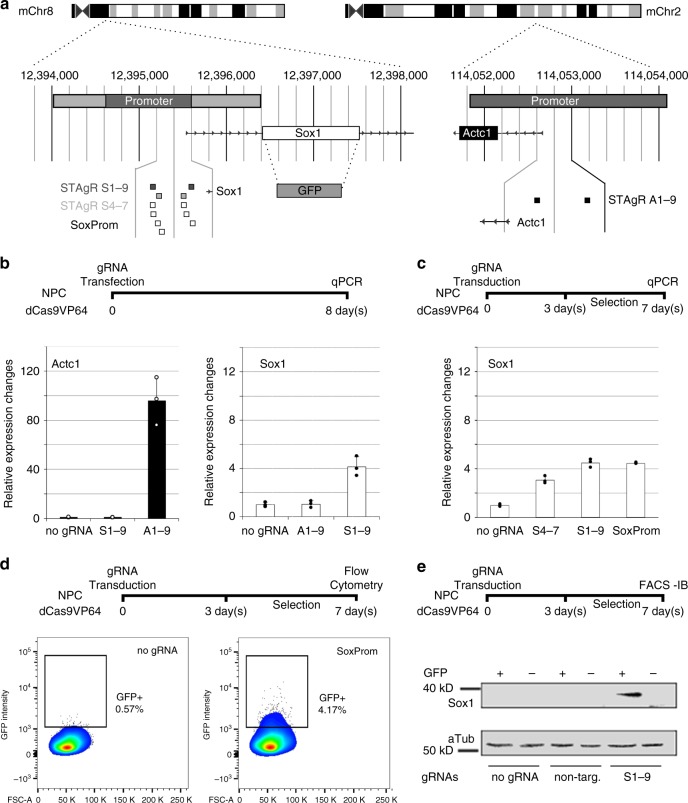
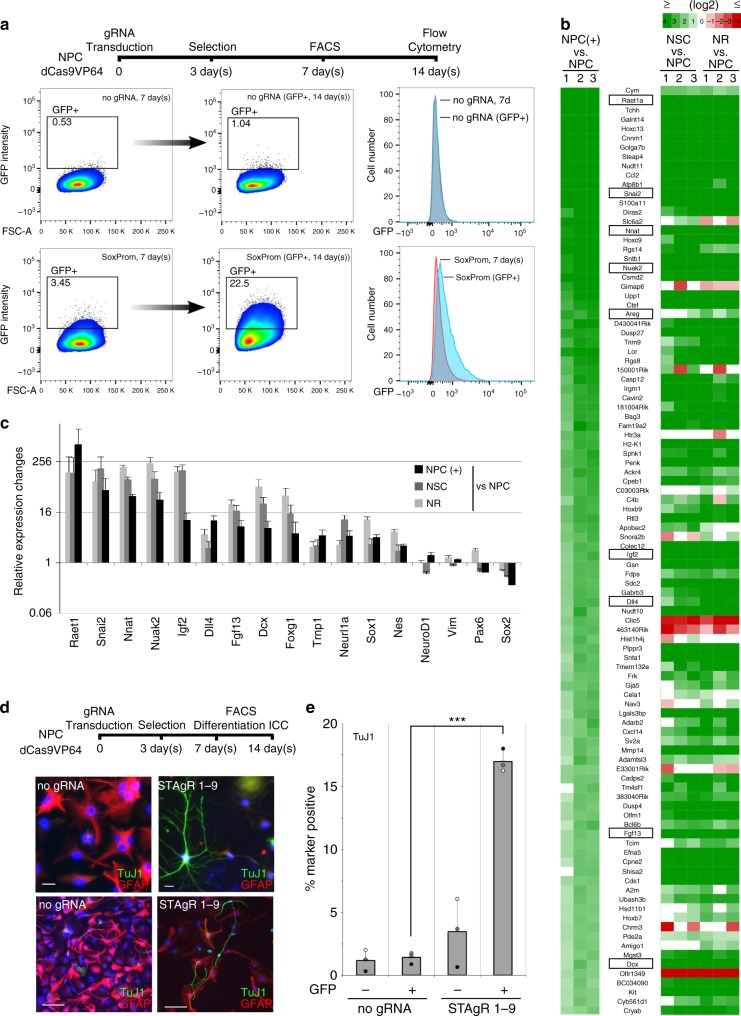
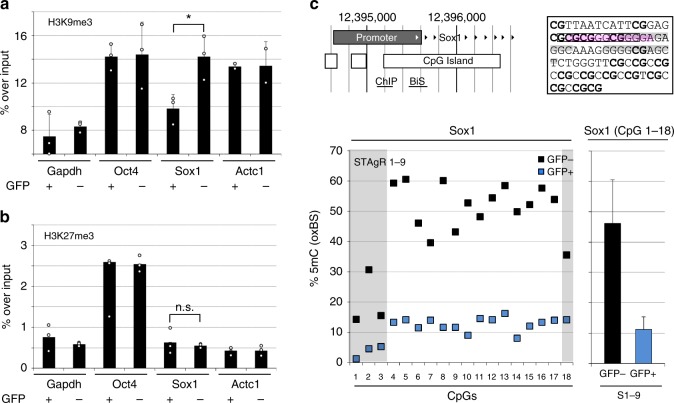
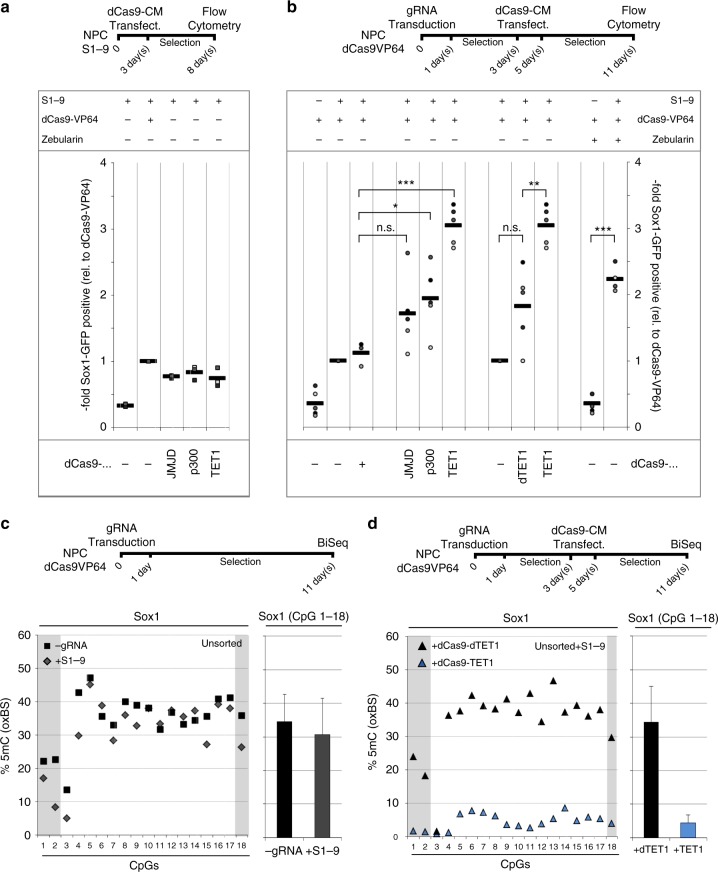
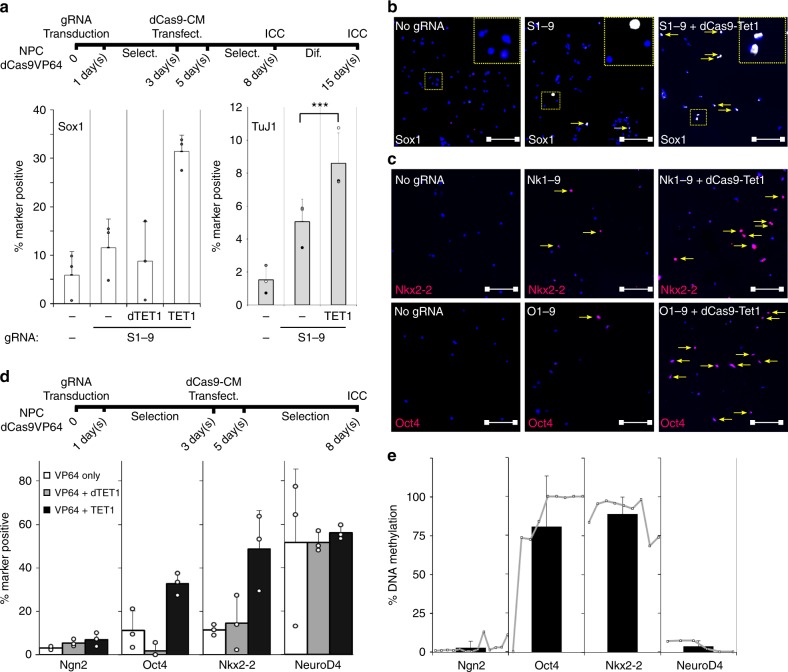
Master transcription factors have the ability to direct and reverse cellular identities, and consequently their genes must be subject to particular transcriptional control. However, it is unclear which molecular processes are responsible for impeding their activation and safeguarding cellular identities. Here we show that the targeting of dCas9-VP64 to the promoter of the master transcription factor Sox1 results in strong transcript and protein up-regulation in neural progenitor cells (NPCs). This gene activation restores lost neuronal differentiation potential, which substantiates the role of Sox1 as a master transcription factor. However, despite efficient transactivator binding, major proportions of progenitor cells are unresponsive to the transactivating stimulus. By combining the transactivation domain with epigenome editing we find that among a series of euchromatic processes, the removal of DNA methylation (by dCas9-Tet1) has the highest potential to increase the proportion of cells activating foreign master transcription factors and thus breaking down cell identity barriers.


Conflict of interest statement

The authors declare no competing interests.

Figures

Fig. 1
Fig. 1
Transcriptional editing of Sox1 leads to gene induction. a Schematic overview of the Sox1 and Actc1 locus in NPCs. Heterozygous knock-in of GFP into the Sox1-ORF and gRNA targets are shown. b Moderate upregulation of Sox1 compared to Actc1. gRNAs were transfected separately into NPCs. mRNA of Actc1 and Sox1 was quantified using qRT-PCR, and NPCs without transfection were used as a control population (no gRNA). Non-targeted loci were quantified as a control for unspecific effects. Actc1 mRNA upregulation is significantly higher than Sox1 mRNA upregulation (two-sided Student’s t-test, p < 0.005). Data shown as the mean and standard error of the mean; n = 3 biological replicates (generated independently on different days in different clonal lines). c Alteration of gRNA sequences and positions does not significantly affect the efficiency of transcriptional engineering. Three different gRNA lentiviruses were transduced and cells were selected for gRNA expression. Data shown as the mean and standard error of the mean; n = 3 biological replicates (generated independently on different days in different clonal lines). d Flow cytometry reveals that a small population of cells is responsive to transcriptional engineering. SoxProm gRNAs were transduced into Sox1GFP NPCs, and cells were selected for gRNA expression. Flow analysis of cells reveals that a minority of cells respond to transcriptional activation with induced with GFP fluorescence. e High Sox1GFP levels correlate to high Sox1 protein levels. Sox1GFP-positive and -negative cells were sorted from control populations (with either no gRNAs or non-targeting gRNAs) and activated populations, respectively. Western Blot reveales significantly higher Sox1 protein levels in the GFP-positive population from NPCs transduced with the SoxProm gRNAs only. Shown is one biological replicate; Image cropped for clarity
Fig. 2
Fig. 2
Phenotypic consequences of Sox1 induction. a Sox1GFP induction can endure prolonged time periods. Sox1GFP positive cells were FACS sorted from control (no gRNA) and experimental settings (SoxProm), cultured for 7 more days and eventually analyzed by flow cytometry. While Sox1GFP-positive cells sorted from control populations show no relative enrichment, those from the activated population show a strong increase of the number of cells in the GFP-positive gate after 7 days, indicating some steadiness of the gene induction. b, c Sox1 activates hundreds of genes associated with a stem cell identity. b Heat map showing the 100 genes most significantly induced by Sox1 induction (NPC+). Most of these genes are also higher in the transcriptomes of early neural stem cells (NSCs, 7 days neural induction of ESCs; NR, sorted neural rosette cells). c Relative expression changes of a selected set of genes are shown; data shown as (logarithmic) fold change and standard error of the mean; all data are depicted for three individual biological replicates. d, e Differentiation assays reveal changes in the potency of Sox1-positive NPCs. After gRNA transduction, Sox1GFP-positive and -negative cells were sorted from both control (no gRNA) and activated (S1-9) populations and differentiated for 7 days; d scale bars (upper row: 20 µm; lower row: 100 µm). e The number of cells positive for the neuronal marker TujI increased significantly in Sox1-positive cells (***p < 0.001 in two-sided Student’s t-test; n = 3 biological replicates, generated independently on different days in different clonal lines)
Fig. 3
Fig. 3
Methodological variance is not the source of unresponsiveness to trans-activation. a dCas9 Protein levels do not differ between populations. Sox1GFP-positive and -negative cells were sorted from control and activated populations (S1-9), and an immunoblot for dCas9 was performed. dCas9 levels did not significantly vary between the respective samples; Image was cropped for clarity. b Resistance to activation is gene-dependent. Actc1 gRNAs (A1-9) and Sox1 gRNAs (S1-9) were co-transduced into NPCs and immunostained for the target proteins after 7 days. While almost all cells induced Actc1 expression, only a small subpopulation was able to activate the Sox1 signal. Dashed yellow lines mark magnified areas; scale bar: 100 µm. c dCas9 binding does not vary between Sox1-positive and -negative NPCs. Sox1GFP-positive and -negative cells were sorted from the activated population (SoxProm), and ChIP for dCas9 was performed at the Sox1 locus as well as on the promoters of Gapdh, Actc1, and Oct4 (serving as negative controls); dCas9 is strongly enriched at the Sox1 locus; no significant difference in DNA binding between responsive and unresponsive NPCs was detected. Data depict one of three biological replicates performed on different days in different clonal lines., mean and standard error of the mean of n = 3 technical replicates shown; n.s., not significant. d dCas9-VPR does not overcome the heterogeneity of gene activation observed with dCas9-VP64. NPCs stably expressing Sox1 targeting gRNAs (S1-9) were transfected with either dCas9 only, dCas9-VP64 or dCas9-VPR. Although higher Sox1 mRNA levels were seen when gene induction was conducted with dCas9-VPR, no significant difference in the number of Sox1GFP-positive cells was detected between the dCas9-VP64- and dCas9-VPR-expressing NPCs (data depict one of three biological replicates, mean and standard error of the mean of n = 3 technical replicates shown)
Fig. 4
Fig. 4
Heterogeneity of chromatin marks correlates to unresponsiveness to trans-activation. a Levels of H3K9 trimethylation on the Sox1 promoter differ significantly. Sox1GFP-positive and -negative samples were sorted to perform ChIP for H3K9me3. Gapdh, Oct4, and Actc1 are included as controls. Levels of K9 trimethylation were significantly higher in the Sox1GFP-negative population compared to the GFP-positive population. Data shown as mean and standard error of the mean of n = 3 biological replicates, performed on different days in different clonal lines, *p < 0.05 in two-sided Student’s t-test. b Levels of H3K27 trimethylation on the Sox1 promoter are similar. Sox1GFP-positive and -negative samples were sorted to perform ChIP for H3K27me3. Gapdh, Oct4, and Actc1 are included as controls. Levels of K27 trimethylation are not significantly different between the Sox1GFP-negative and-positive populations. Data shown as the mean and standard error of the mean of n = 3 technical replicates; n.s., not significant in two-sided Student’s t-test. c Sox1GFP-positive NPCs exhibit lower DNA methylation at the Sox1 promoter. (Top left) Structure of the Sox1 promoter, locations of ChIP qPCR and BS and OxBS amplicons are shown. (Top right) Sequence of the oxBS and BS analyzed sequence in the Sox1 promoter. CpGs are marked in bold. Predicted binding sites of YY1 (marked in grey) and Sp1/Sp3 (marked in pink) as well as E2F-1 (boxed) are indicated. (Below). Sox1GFP-positive and -negative cells were sorted to perform oxidative bisulfite sequencing. This revealed elevated DNA methylation levels in non-responsive cells on the Sox1 promoter (data depict the mean and standard error of the mean of NGS reads of at least n = 1000 individual sequences generated from two individual biological replicates generated and analyzed on separate days)
Fig. 5
Fig. 5
Targeted DNA demethylation lowers a barrier of Sox1 induction. a Epigenetic editing alone has a minor effect on Sox1 gene induction. NPCs stably expressing Sox1-targeting gRNAs (S1-9) were transfected with dCas9 tethered to VP64 or enzymatic domains of canonical chromatin modifying enzymes (JMJD2a, p300, Tet1). Flow cytometry revealed that none of the epigenome editing constructs superseded the effect of dCas9-VP64. Data and mean shown are derived from three biological replicates, performed on different days in different clonal lines. b Epigenetic engineering enhances the number of Sox1-positive NPCs. NPCs were transduced with gRNAs and subsequently transfected with different chromatin modifiers tethered to dCas9. Flow analysis reveals a significantly higher proportion of Sox1-positive cells when VP64 was combined with Tet1 or P300, respectively (but not JMJD2a), compared to combination with dCas9 only. In addition, the effect of the combination with Tet1 was significantly higher than the combination with its catalytically dead mutant dTet1 (data are shown as single biological replicates and mean; *p < 0.05; **p < 0.01; ***p < 0.005 calculated by two-sided Student’s t-test. n = between 3 and 5 biological replicates, generated and analyzed on separate days, in three different clonal lines). c, d Oxidative bisulfite sequencing reveals efficient de-methylation of the Sox1 promoter by dCas9-Tet1. NPCs were transduced with gRNAs (S1-9) and either subsequently transfected with dCas9-Tet1 and dCas9-dTet1 or not. c Oxidative bisulfite sequencing after 11 days shows that on unsorted populations no change in the proportion of methylated CpGs is apparent between gRNA receiving and control cells provided that no dCas9-Tet1 is present. d However, dCas9-Tet1 transfection and selection lead to an efficient reduction of DNA methylation at the Sox1 promoter. Furthermore, no demethylating effect of dCas9-dTet1 can be seen (data depict the means and standard error of the mean of NGS reads of at least n = 1000 individual sequences generated from four individual biological replicates generated and analyzed on separate days, in three different clonal lines)
Fig. 6
Fig. 6
DNA methylation as a barrier to transcriptional engineering is not an exclusive feature of Sox1. a, b Combination of transcriptional engineering with epigenome editing increases the neuronal differentiation potency of NPCs. NPCs stably expressing dCas9-VP64 were transduced with Sox1-targeting gRNAs (S1-9) and subsequently transfected with dCas9-Tet1 or dCas9-dTet1. NPCs were stained for Sox1 or differentiated for 7 more days, respectively. Sox1 staining revealed a higher number of Sox1-positive cells when dCas9-VP64 is combined with dCas9-Tet1 but not with dCas9-dTet1. After differentiation, more cells differentiated into the neuronal lineage, as indicated by the higher Tuj1 positivity after epigenome editing compared to transcriptional editing alone. Data are shown as the mean and standard error of the mean of n = 3 biological replicates, performed on different days in different clonal lines. ***p < 0.005 calculated by two-sided Student’s t-test. Dashed yellow lines mark magnified areas; scale bar: 100 µm. c, d Activation of different master transcription factors reveals varying responsiveness to transcriptional engineering and sensitivity to DNA demethylation. NPCs expressing dCas9-VP64 were transfected with gRNAs (Ng1-9, Nk1-9, O1-9, Ne1-9) targeting different master transcription and reprogramming factors (Ngn2, Nkx2-2, Oct4, NeuroD4). Induction varied considerably between different targets, although three of four master transcription factor genes mostly resisted gene activation. Transfection of dCas9-Tet1 but not dCas9-dTet1 almost quintupled the cell population responsive to Nkx2-2 transactivation and tripled that inducing Oct4. Data shown as the mean with standard error of the mean of n = 3 technical replicates; scale bar: 100 µm. e DNA methylation levels at master transcription factor promoters predict responsiveness to epigenome editing. Oxidative bisulfite sequencing was performed in NPCs to quantify DNA methylation levels at regions including the TSS of the tested master transcription factors. While the promoter of Ngn2 and NeuroD4 appear almost completely unmethylated, that of Nkx2-2 and Oct4 exhibit high methylation levels at the TSS. Data derived from two biological replicates are shown as the mean and standard error of the mean of all analyzed CpGs (Ngn2: 13, Nkx2-2: 8, Oct4: 9, NeuroD4: 6) inside a 100–300 bp region surrounding the TSS (for the genomic position see Supplementary Table 1); Dots show the methylation levels of single CpGs in analyzed loci

References

    1. Smith ZD, Sindhu C, Meissner A. Molecular features of cellular reprogramming and development. Nat. Rev. Mol. Cell Biol. 2016;17:139–154. doi: 10.1038/nrm.2016.6. - DOI - PubMed
    1. Iwafuchi-Doi M, Zaret KS. Pioneer transcription factors in cell reprogramming. Genes Dev. 2014;28:2679–2692. doi: 10.1101/gad.253443.114. - DOI - PMC - PubMed
    1. Chavez A, et al. Highly efficient Cas9-mediated transcriptional programming. Nat. Methods. 2015;12:326–328. doi: 10.1038/nmeth.3312. - DOI - PMC - PubMed
    1. Gao X, et al. Comparison of TALE designer transcription factors and the CRISPR/dCas9 in regulation of gene expression by targeting enhancers. Nucleic Acids Res. 2014;42:e155. doi: 10.1093/nar/gku836. - DOI - PMC - PubMed
    1. Liu P, Chen M, Liu Y, Qi LS, Ding S. CRISPR-based chromatin remodeling of the endogenous Oct4 or Sox2 locus enables reprogramming to pluripotency. Cell Stem Cell. 2018;22:252–261. doi: 10.1016/j.stem.2017.12.001. - DOI - PubMed

Publication types

MeSH terms