. 2019 May 9;9(1):7124.
doi: 10.1038/s41598-019-43170-1.

Confidence as a diagnostic tool for perceptual aftereffects

Affiliations

Confidence as a diagnostic tool for perceptual aftereffects

Regan M Gallagher et al. Sci Rep. .

Abstract

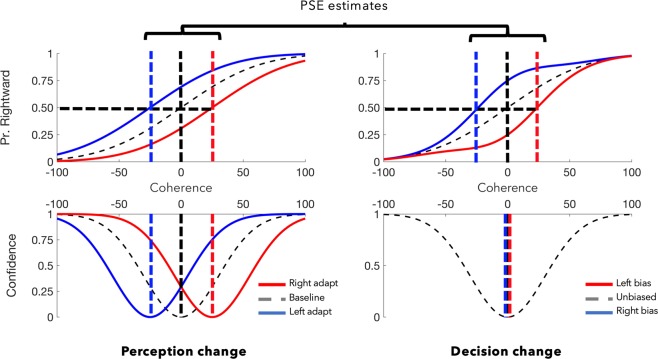
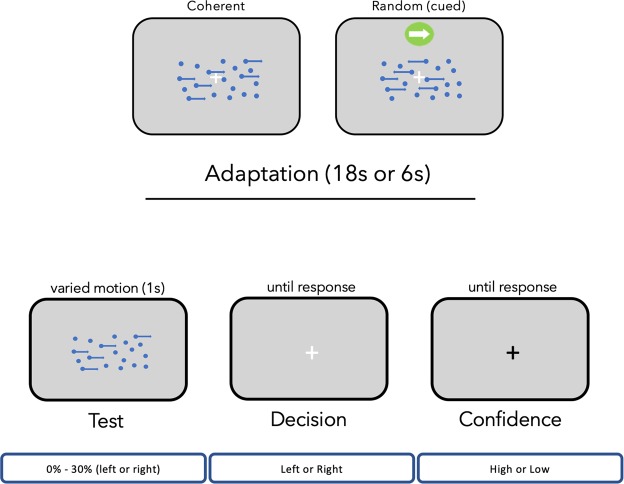
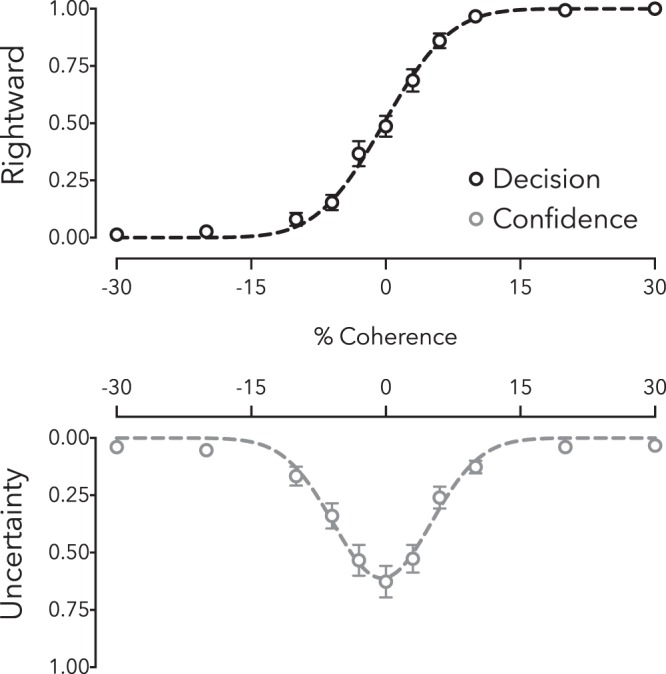
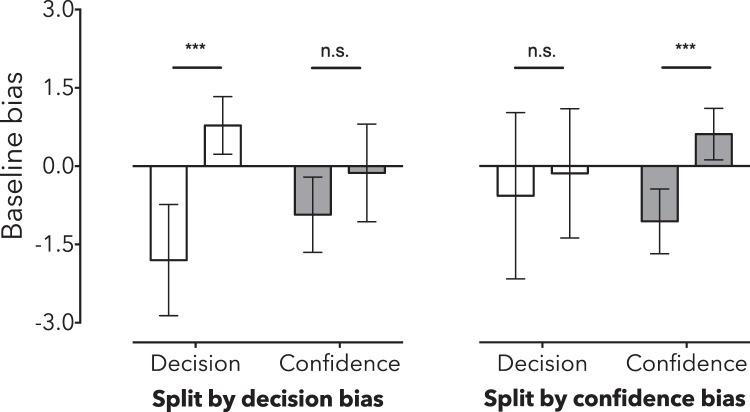
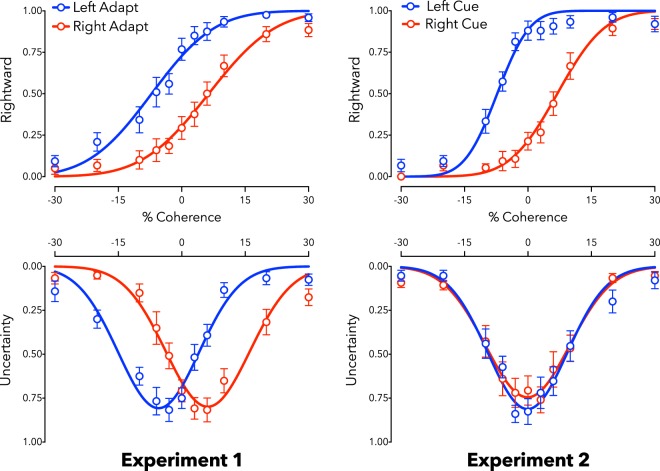
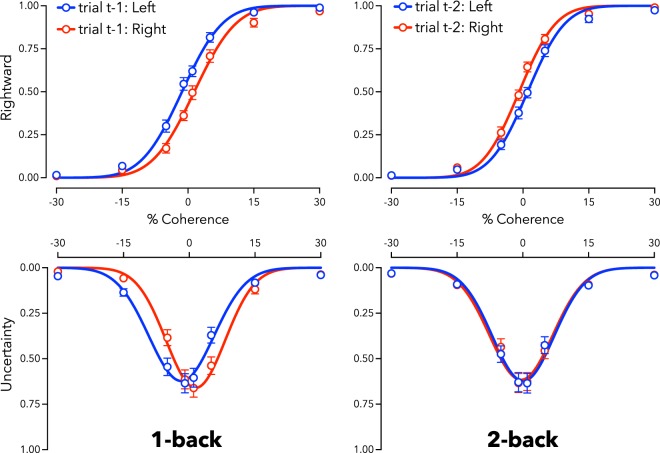
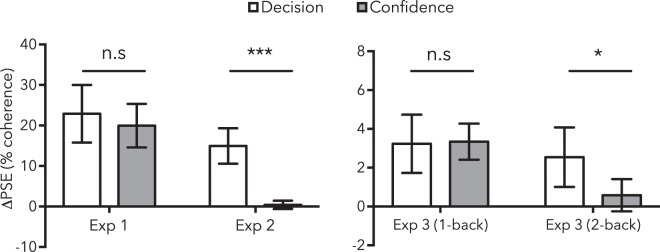
Perceptual judgements are, by nature, a product both of sensation and the cognitive processes responsible for interpreting and reporting subjective experiences. Changed perceptual judgements may thus result from changes in how the world appears (perception), or subsequent interpretation (judgement). This ambiguity has led to persistent debates about how to interpret changes in decision-making, and if higher-order cognitions can change how the world looks, or sounds, or feels. Here we introduce an approach that can help resolve these ambiguities. In three motion-direction experiments, we measured perceptual judgements and subjective confidence. We show that each measure is sensitive to sensory information and can index sensory adaptation. Each measure is also sensitive to decision biases, but response bias impacts the central tendency of decision and confidence distributions differently. Our findings show that subjective confidence, when measured in addition to perceptual decisions, can supply important diagnostic information about the cause of aftereffects.


Conflict of interest statement

The authors declare no competing interests.

Figures

Figure 1
Figure 1
Confidence can distinguish perceptual from non-perceptual effects on decision-making. Here we illustrate hypothetical data sets for motion-direction judgments. Categorical decisions (“are stimulus elements predominantly moving left, or right?”) are plotted above as a function of motion coherence (the proportion of elements physically moving left or right). Expressions of confidence (“how confident are you in your decision?”), as a function of motion coherence, are plotted below. Both measures are assumed to scale with the strength of sensory evidence. On the left we depict patterns of results expected from changed sensory evidence; if sensory evidence changes, previously ambiguous inputs should look as if they are moving right (blue line) or left (red). Categorical decisions and confidence are expected to shift in tandem as both judgments are informed by sensory evidence. On the right we depict expected responses from people making different decisions when uncertain; if decisions change because people make different decisions regarding ambiguous inputs, categorical decisions might shift primarily for stimuli that are associated with low confidence. In this case, categorisation changes are proportional to (lack of) confidence, but the distribution of confidence remains unchanged (see Supplement 1 for Matlab code).
Figure 2
Figure 2
Procedures for each experiment. Participants adapted to stimuli that depicted either coherent motion or random motion and a static direction cue. Each trial within a testing block consisted of an adaptation phase (except for baseline) followed by a dot test probe. The direction of the adapting stimulus (left or right) was consistent within the first half of a block, and then changed direction for the second half. Adapting stimuli appeared for 18 s on the first trial of each block, and on the middle trial when the stimulus changed direction, and for 6 s on all other trials. Dot test probes were present for 1 s, appearing on the second frame after the adapting stimulus disappeared. A new trial began once participants had recorded their direction decision (left or right) and reported their confidence (whether they had confidence in their decision — yes/high confidence or no/low confidence).
Figure 3
Figure 3
Baseline data (N = 15). Distributions of reported motion direction (left or right) and confidence (high or low) as a function of dot coherence (percent) and direction (negative values left, positive right). Data and best-fit functions are depicted for baseline motion-direction judgments in Experiment 1. The inflection point of the function fitted to decision data (blue), and the peak of the function fit to confidence data (red) each estimate the point of subjective equality. Depicted data are averaged across all participants, but parameter estimates are derived from individual fits. Error bars depict ± 1 SEM.
Figure 4
Figure 4
Split of baseline data according to whether (left) the point of subjective equality (PSE) and (right) peak uncertainty estimates were negative or positive. Error bars depict 95% CIs.
Figure 5
Figure 5
Reported motion direction (left or right, top row) and low-confidence (uncertainty, bottom row) as a function of dot coherence (percent) and direction (negative values left, positive right). Data are shown along with best-fit functions for adaptation data in Experiments 1 (left column) and 2 (right column). Both Experiments are associated with changed direction decisions (see top row), but only Experiment 2 is associated with shifts in confidence (bottom row; see main text for further details). Depicted data are averaged across participants, but statistical tests were based on individual data fits. N = 15; Error bars depict ± 1 SEM.
Figure 6
Figure 6
Proportion of rightward motion reported (top row) and low-confidence (uncertainty, bottom row) as a function of dot coherence (percent) and direction (negative values left, positive right). Data are divided according to the physical direction of the last test (Left panel: t-1 data), and according to the physical direction of the test two trials ago (Right panel: t-2 data). Blue data indicate that the prior trial was moving left, red that the prior trial was moving right. Depicted data are averaged across participants, but statistical tests were based on individual fits. N = 22; Error bars depict ± 1 SEM.
Figure 7
Figure 7
Bar graphs summarising the results of all experiments. Data depict mean (absolute) PSE changes calculated from categorical decisions (white bars) and confidence judgments (grey bars). Error bars depict 95% CIs.

References

    1. Storrs, K. R. Are high-level aftereffects perceptual? Frontiers in psychology, 6 (2015). - PMC - PubMed
    1. Balcetis E, Dunning D. Wishful seeing: More desired objects are seen as closer. Psychological Science. 2010;21:147–152. doi: 10.1177/0956797609356283. - DOI - PubMed
    1. Firestone, C. & Scholl, B. J. Cognition does not affect perception: Evaluating the evidence for “top-down” effects. Behavioral and brain sciences, 39 (2016). - PubMed
    1. Banerjee P, Chatterjee P, Sinha J. Is it light or dark? Recalling moral behavior changes perception of brightness. Psychological Science. 2012;23(4):407–409. doi: 10.1177/0956797611432497. - DOI - PubMed
    1. Pylyshyn Z. Is vision continuous with cognition?: The case for cognitive impenetrability of visual perception. Behavioral and brain sciences. 1999;22(3):341–365. doi: 10.1017/S0140525X99002022. - DOI - PubMed