

doi: 10.1086/700766.
Epub 2019 Feb 13.
Watersheds in Child Mortality: The Role of Effective Water and Sewerage Infrastructure, 1880 to 1920
Affiliations
- PMID: 31073249
- PMCID: PMC6502471
- DOI: 10.1086/700766
Item in Clipboard
Watersheds in Child Mortality: The Role of Effective Water and Sewerage Infrastructure, 1880 to 1920
J Polit Econ.
2019 Apr.
Abstract
We explore the first period of sustained decline in child mortality in the U.S. and provide estimates of the independent and combined effects of clean water and effective sewerage systems on under-five mortality. Our case is Massachusetts, 1880 to 1920, when authorities developed a sewerage and water district in the Boston area. We find the two interventions were complementary and together account for approximately one-third of the decline in log child mortality during the 41 years. Our findings are relevant to the developing world and suggest that a piecemeal approach to infrastructure investments is unlikely to significantly improve child health.
Figures
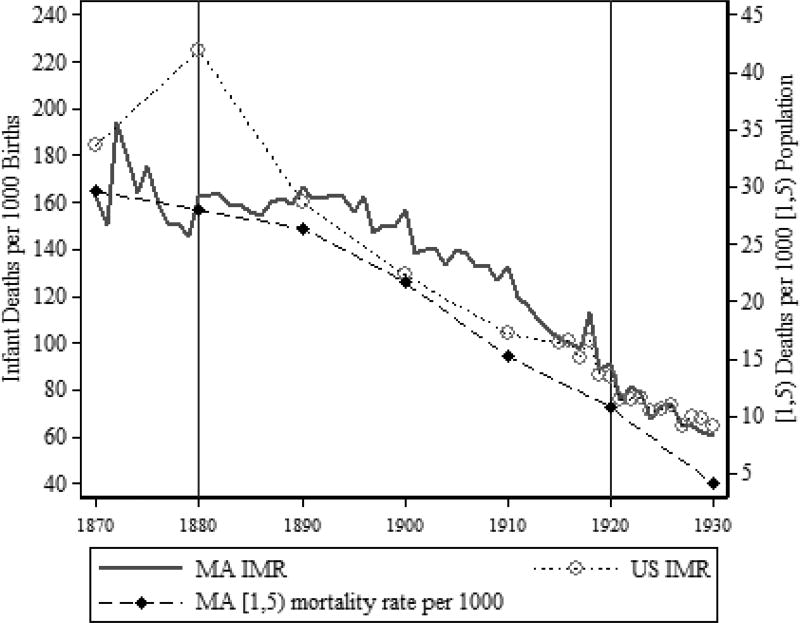
Infant and [1, 5) Mortality in the U.S. and Massachusetts: 1870 to 1930 Notes: The U.S. IMR series for 1850 to 1910 is probably less accurate than the Massachusetts series, which is at an annual frequency and from actual vital statistics data. See Haines (1998a) and Carter et al. (2006, p. 1–461). The right axis plots the death rate of those [1, 5) for Massachusetts based on the (yearly) registration reports and age-specific population counts from the federal decennial censuses. The U.S. aggregate series for the children [1, 5) death rate begins in 1900.
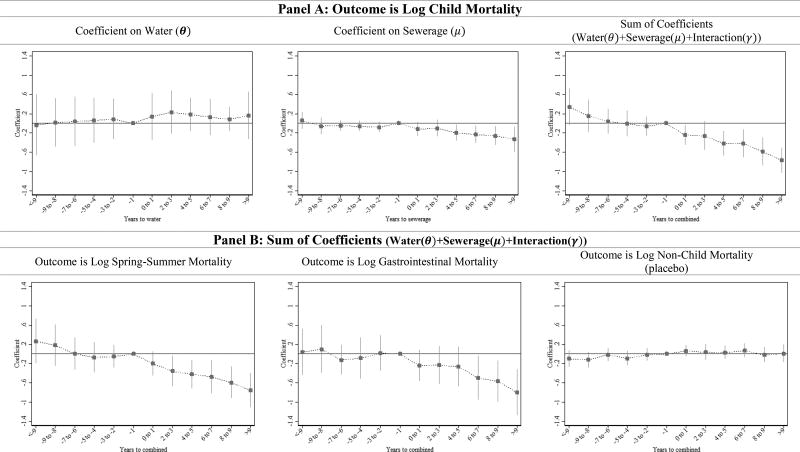
Event Studies of the Efect of Sewerage, Water, and their Combination on Mortality by Age and Category of Death Notes: OLS estimates of eq. (2) and their 95 percent confidence intervals are given. Panel A plots coefficients from one regression with the outcome log of child mortality, which includes the deaths of infants and young children [1, 5) years of age per 1,000 under-five population. Reading from left to right are the coefficients on water (θk), the coefficients on sewerage (μk), and the sum of coefficients: Water(θ)+Sewerage(μ)+Interaction(γ). Plotted in Panel B are the sum of coefficients: Water(θ)+Sewerage(μ)+Interaction(γ) using three different outcome variables (i.e., three different regressions): the log of the child mortality rate during the spring and summer, which is deaths during the months of April to September per 1,000 under-five population; the log of the child mortality rate from gastrointestinal disease; and the log of the non-child mortality, which is deaths of those five and above per 1,000 relevant population. See Data Appendix (variables definition), and text for further details. Standard errors are clustered at the municipality level.
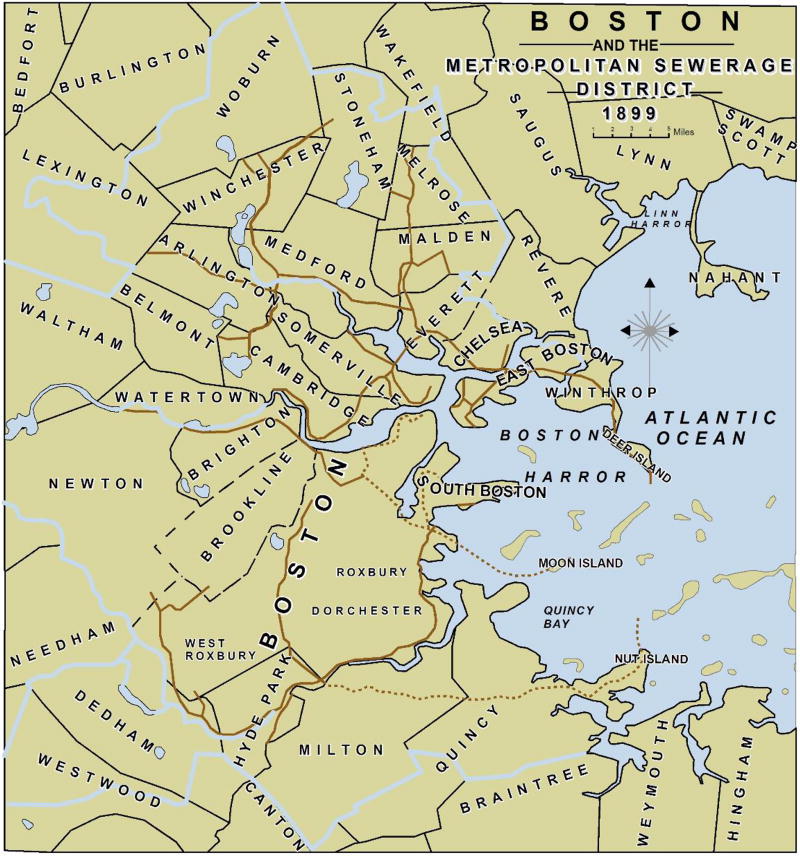
Metropolitan Sewerage District (circa 1899) Notes: This map depicts the Metropolitan Sewerage System circa 1899 (Source: Metropolitan Sewerage Commission of Boston, MA (1899)). The rivers draining into the Boston Harbor (from north to south) include the Mystic, Charles, and Neponset. The red solid lines depict the North and South Metropolitan Districts, the dotted lines to Moon Island trace the trajectory of the Boston sewerage system and the dotted line from Hyde Park to Nut Island demonstrates the High Level System.
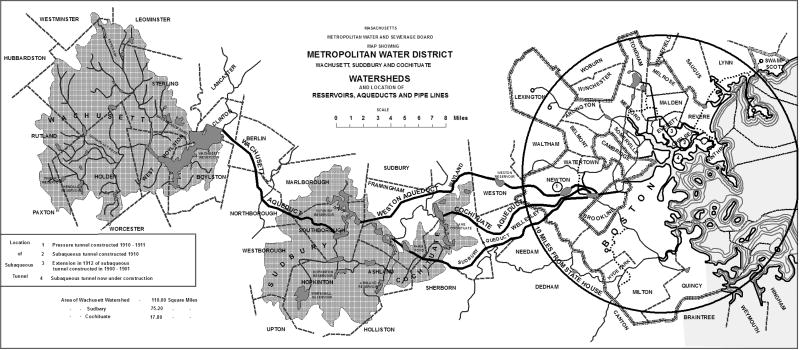
Metropolitan Water District (circa 1910) Source: Engineering and Contracting (1914, p. 84). Notes: This map depicts the Metropolitan Water District circa 1910. The circle gives the 10-mile radius from the State House that defined the eligible municipalities. Aqueducts (dark black lines) and a series of reservoirs (bodies of water labeled as such) were constructed to bring water from the south branch of the Nashua River to communities in and around Boston.
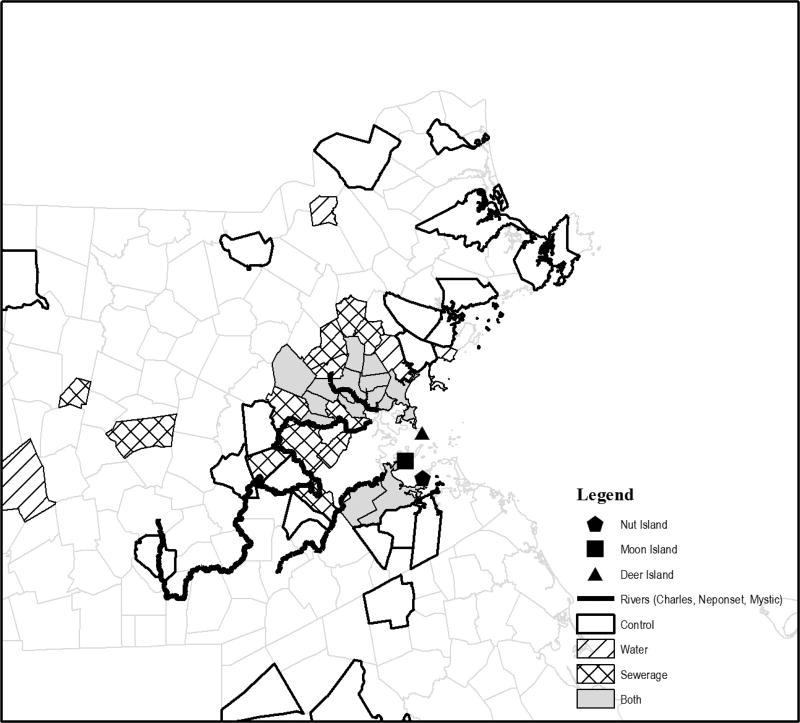
Safe Water and Sewerage Treatments in the Boston Metropolitan Area
References
-
- American Society of Civil Engineers. Transactions of the American Society of Civil Engineers. 1901 Dec46
-
- Apple Rima D. Mothers and Medicine: A Social History of Infant Feeding, 1890–1950. Madison, WI: University of Wisconsin Press; 1997.
-
- Baker Moses Nelson. The Manual of American Water-Works, 1897. New York, NY: The Engineering News Publishing Co.; 1897.
-
- Beach Brian, Ferrie Joseph, Saavedra Martin, Troesken Werner. Typhoid Fever, Water Quality and Human Capital Formation. Journal of Economic History. 2016;76(1):41–75.
Grants and funding
LinkOut - more resources
Full Text Sources