. 2020 Mar;49(3):749-761.
doi: 10.1007/s13280-019-01191-0. Epub 2019 May 9.

Circumpolar status of Arctic ptarmigan: Population dynamics and trends

Affiliations

Circumpolar status of Arctic ptarmigan: Population dynamics and trends

Eva Fuglei et al. Ambio. 2020 Mar.

Abstract

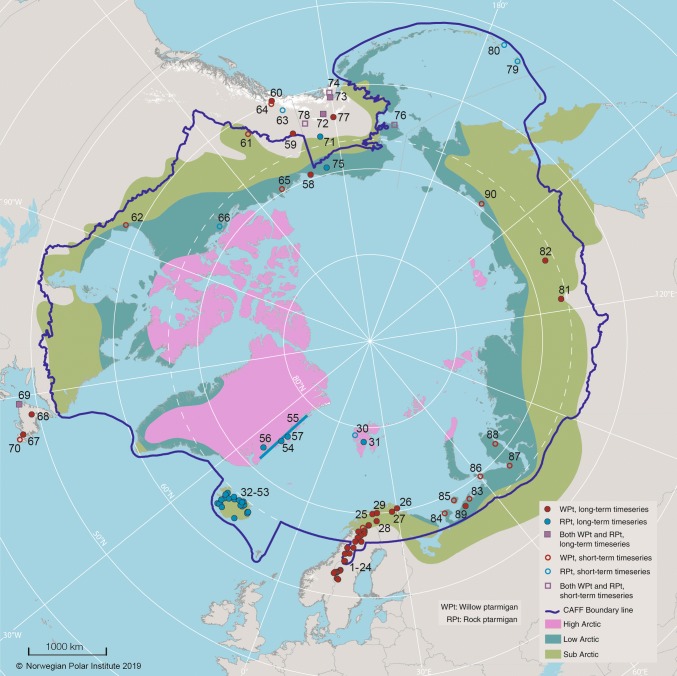
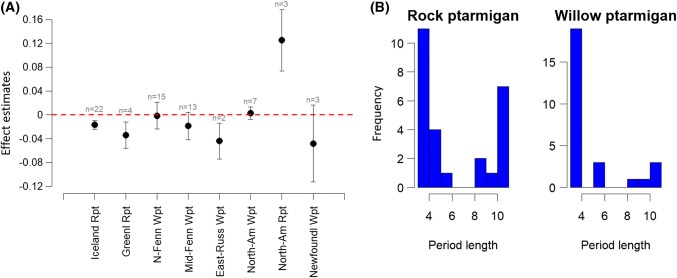
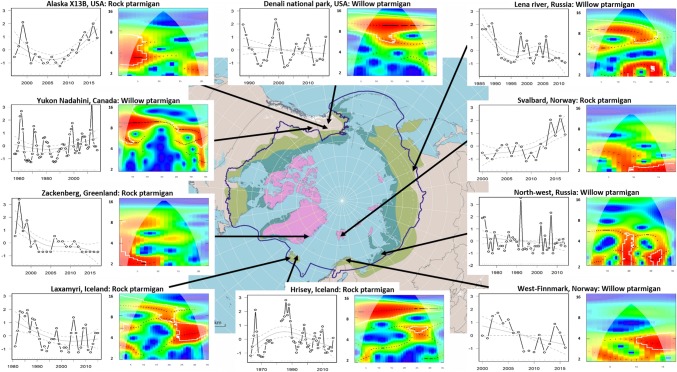
Rock ptarmigan (Lagopus muta) and willow ptarmigan (L. lagopus) are Arctic birds with a circumpolar distribution but there is limited knowledge about their status and trends across their circumpolar distribution. Here, we compiled information from 90 ptarmigan study sites from 7 Arctic countries, where almost half of the sites are still monitored. Rock ptarmigan showed an overall negative trend on Iceland and Greenland, while Svalbard and Newfoundland had positive trends, and no significant trends in Alaska. For willow ptarmigan, there was a negative trend in mid-Sweden and eastern Russia, while northern Fennoscandia, North America and Newfoundland had no significant trends. Both species displayed some periods with population cycles (short 3-6 years and long 9-12 years), but cyclicity changed through time for both species. We propose that simple, cost-efficient systematic surveys that capture the main feature of ptarmigan population dynamics can form the basis for citizen science efforts in order to fill knowledge gaps for the many regions that lack systematic ptarmigan monitoring programs.

Keywords: Arctic; Climate change; Ecosystems; Lagopus spp.; Population cycles; Transient dynamics.


Figures

Fig. 1
Fig. 1
Map showing ptarmigan monitoring sites (sites numbered from 1 to 90) considered in the present study. Filled symbols denote sites with continuous long-term data (≥ 7 years) that could be subjected to trend analyses, while open symbols denote sites where the time series were too short (< 6 years) for such analyses or ended before 2010. Red symbols denote willow ptarmigan monitoring sites, blue symbols rock ptarmigan monitoring sites and squares denote sites with monitoring of both species. The blue tick line denotes Conservation of Arctic Flora and Fauna Working Group (CAFF) boundary, the pink colour high-Arctic, dark green low-Arctic and light green sub-Arctic areas
Fig. 2
Fig. 2
a Linear trend effect estimates (mean, confidence intervals and number of time series in regional meta-analyses) of rock ptarmigan (RPt) and willow ptarmigan (WPt) populations from different regions within or just outside the CAFF area (see Fig. 1; Table S2). b Frequencies (i.e. number of time series) of cycle period length (in years, based on dominant power spectrum) from wavelet analyses of rock ptarmigan and willow ptarmigan time series
Fig. 3
Fig. 3
Representative examples of 10 long time series and monitoring sites illustrating the variety of populations dynamics and trends displayed by the two ptarmigan species (willow and rock ptarmigan) in the circumpolar Arctic. The left panels for each site show the standardized time series and GAM trend curves (grey lines) with confidence envelopes (grey dotted lines). The right panels show the result from the wavelet analyses where red areas, within white wavelet power contour lines, denote periods with evidence for cyclic dynamics with different cycle lengths. The colour palette in the wavelet plots denotes wavelet power levels, with wavelet power increasing from blue to red
Fig. 4
Fig. 4
Upper panel: distance sampling-based density estimates of willow ptarmigan from two areas (Komag and Ifjord) in eastern Finnmark, sub-Arctic/low-Arctic Norway (monitoring site 27; Fig. 1; Table 1) based on annual autumn line transect surveys with pointing dogs (solid black and grey lines, respectively) compared to estimates of ptarmigan occurence based on faecal pellet counts from two monitoring sites [indicated with black and grey stippled lines (all from monitoring site 26; Table S2)]. The faecal pellet counts were made on replicated permanent removal plots (pellets removed each year) in early and late summer each year (only the early autumn estimates are shown) (see Henden et al. for details). Lower panel: distance sampling-based density estimates (log) compared to faecal pellet count-based estimates of ptarmigan occurence (logit) for the two areas. Area-specific correlations are provided in the legend and regression lines are added for visualization

References

    1. Barraquand F, Louca S, Abbott KC, Cobbold CA, Cordoleani F, DeAngelis DL, Eldern BD, Fox JW, et al. Moving forward in circles: Challenges and opportunities in modelling population cycles. Ecology Letters. 2017;20:1074–1092. doi: 10.1111/ele.12789. - DOI - PubMed
    1. Bjørnstad ON, Grenfell BT. Noisy clockwork: Time series analysis of population fluctuations in animals. Science. 2001;29:638–643. doi: 10.1126/science.1062226. - DOI - PubMed
    1. Bjørnstad ON, Ims RA, Lambin X. Spatial population dynamics: Analysing patterns and processes of population synchrony. Trends in Ecology and Evolution. 1999;14:427–432. doi: 10.1016/S0169-5347(99)01677-8. - DOI - PubMed
    1. Boonstra R, Andreassen HP, Boutin S, Husek J, Ims RA, Krebs CJ, Skarpe C, Wabakken P. Why do the boreal forest ecosystems of northwestern Europe differ from those of western North America? BioScience. 2016;66:722–734. doi: 10.1093/biosci/biw080. - DOI - PMC - PubMed
    1. Buckland ST, Anderson DR, Burnham KP, Laake JL, Borchers DL, Thomas L. Introduction to distance sampling. Estimating abundance of biological populations. New York: Oxford University Press, Inc.; 2001.

LinkOut - more resources