. 2019 Jul;110(7):2296-2308.
doi: 10.1111/cas.14041. Epub 2019 Jun 18.

Vasohibin-2 plays an essential role in metastasis of pancreatic ductal adenocarcinoma

Affiliations

Vasohibin-2 plays an essential role in metastasis of pancreatic ductal adenocarcinoma

Rie Iida-Norita et al. Cancer Sci. 2019 Jul.

Abstract

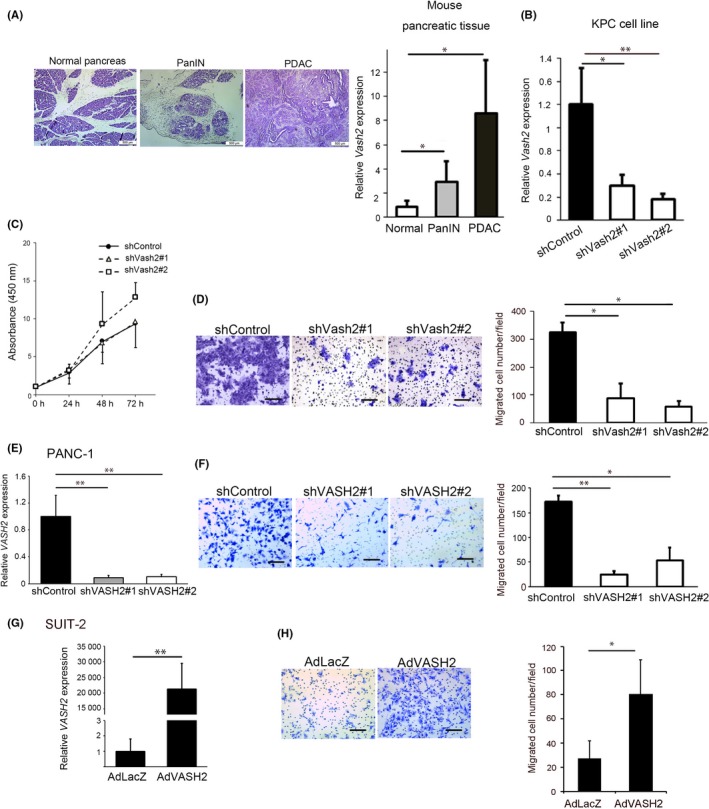
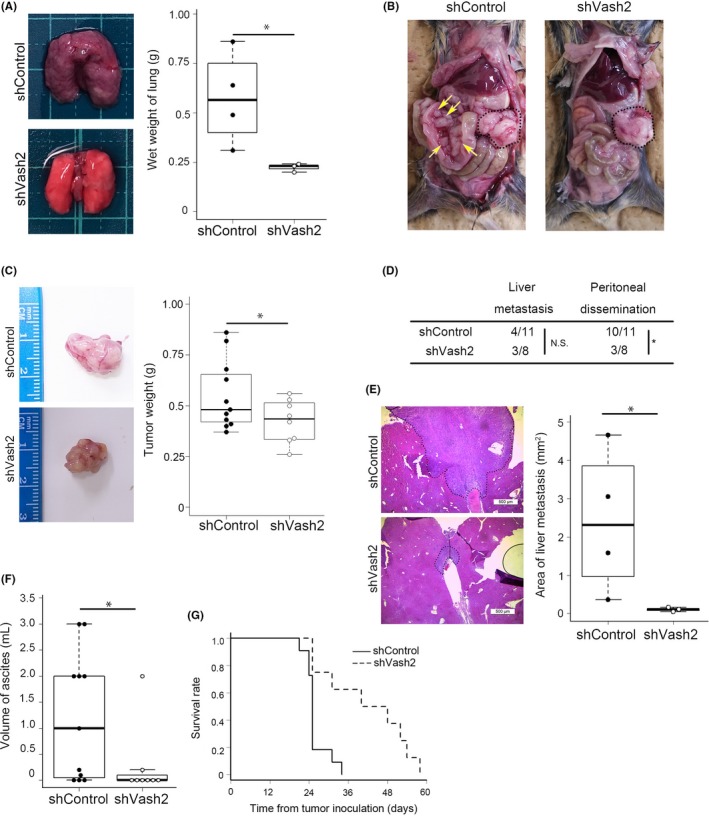
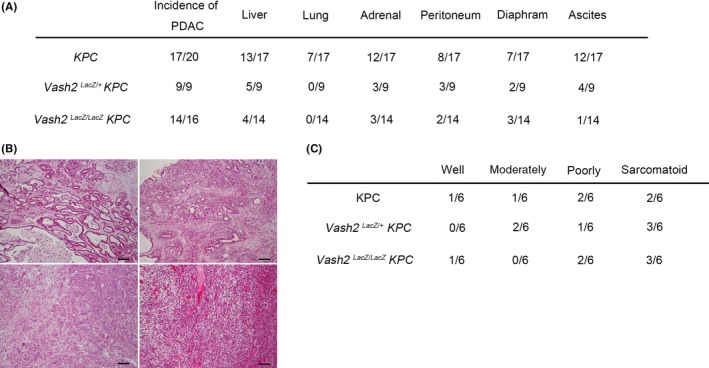
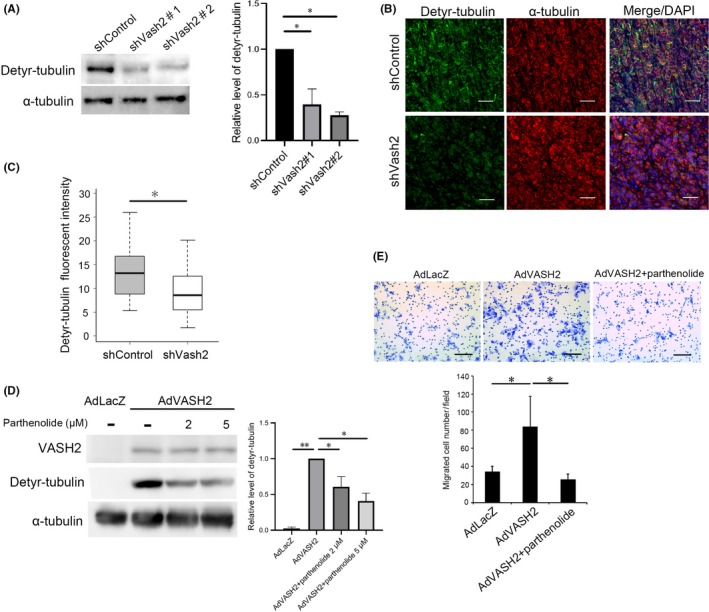
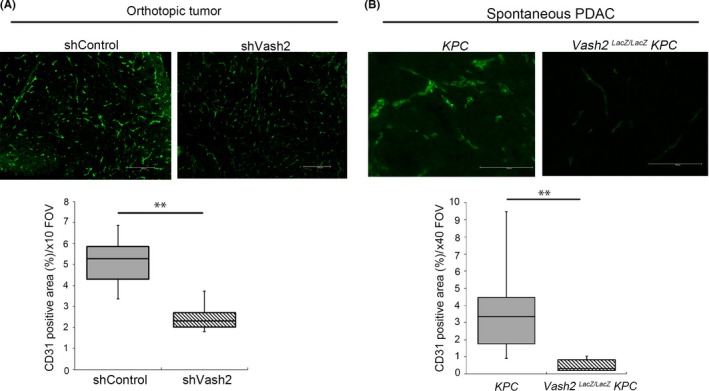
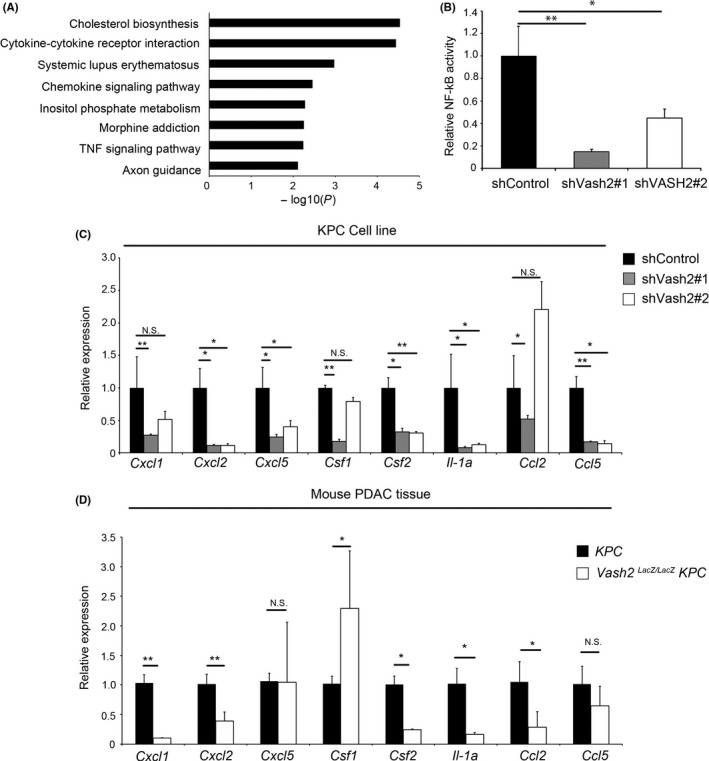
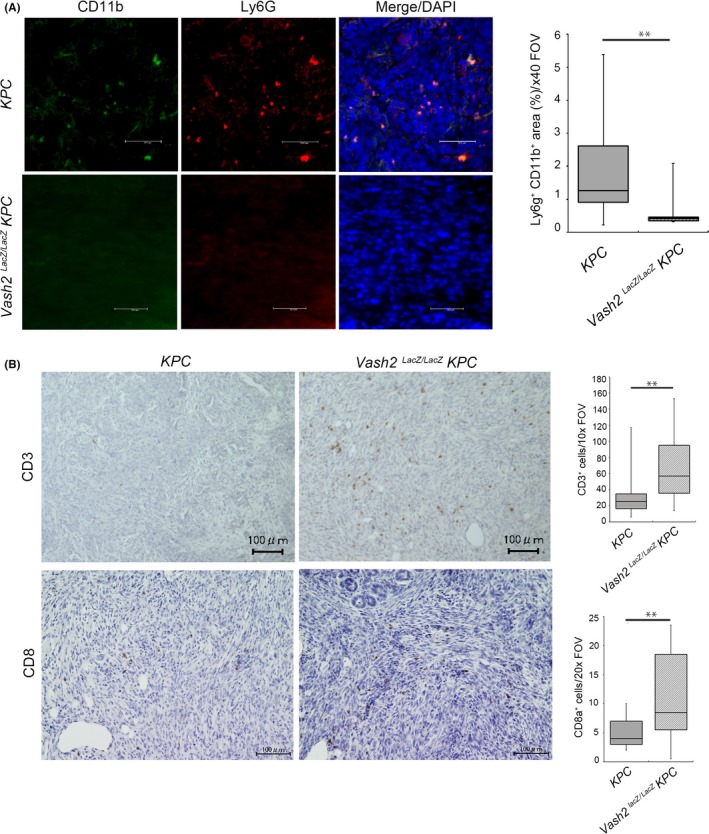
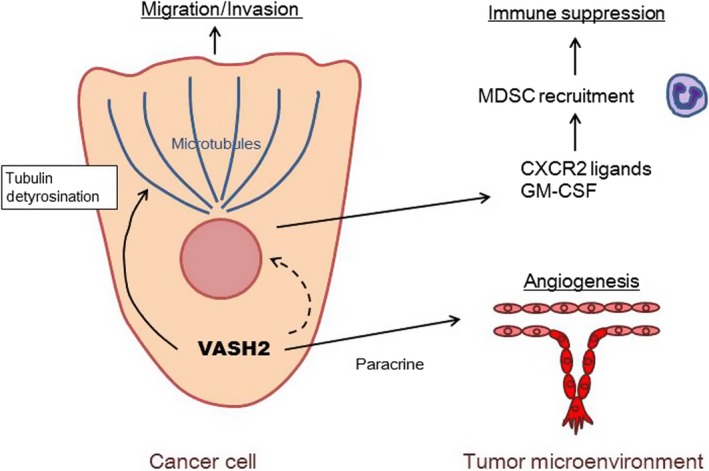
Vasohibin-2 (VASH2) is expressed in various cancers and promotes their progression. We recently reported that pancreatic cancer patients with higher VASH2 expression show poorer prognosis. Herein, we sought to characterize the role of VASH2 in pancreatic cancer. We used LSL-KrasG12D ; LSL-Trp53R172H ; Pdx-1-Cre (KPC) mice, a mouse model of pancreatic ductal adenocarcinoma (PDAC), and cells isolated from them (KPC cells). Knockdown of Vash2 from PDAC cells did not affect their proliferation, but decreased their migration. When Vash2-knockdown PDAC cells were orthotopically inoculated, liver metastasis and peritoneal dissemination were reduced, and the survival period was significantly prolonged. When KPC mice were crossed with Vash2-deficient mice, metastasis was significantly decreased in Vash2-deficient KPC mice. VASH2 was recently identified to have tubulin carboxypeptidase activity. VASH2 knockdown decreased, whereas VASH2 overexpression increased tubulin detyrosination of PDAC cells, and tubulin carboxypeptidase (TCP) inhibitor parthenolide inhibited VASH2-induced cell migration. We next clarified its role in the tumor microenvironment. Tumor angiogenesis was significantly abrogated in vivo when VASH2 was knocked down or deleted. We further examined genes downregulated by Vash2 knockdown in KPC cells, and found chemokines and cytokines that were responsible for the recruitment of myeloid derived suppressor cells (MDSC). Indeed, MDSC were accumulated in PDAC of KPC mice, and they were significantly decreased in Vash2-deficient KPC mice. These findings suggest that VASH2 plays an essential role in the metastasis of PDAC with multiple effects on both cancer cells and the tumor microenvironment, including tubulin detyrosination, tumor angiogenesis and evasion of tumor immunity.

Keywords: MDSC; angiogenesis; pancreatic ductal adenocarcinoma; tubulin detyrosination; vasohibin-2.


Figures

Figure 1
Figure 1
Vasohibin‐2 (Vash2) was upregulated during pancreatic ductal adenocarcinoma (PDAC) progression and promoted PDAC cell migration. A, Representative images of H&E staining and comparison of Vash2 mRNA expression using qRTPCR analysis in normal pancreatic tissue (n = 5), PanIN (n = 5) and PDAC (n = 7) from KPC mice. B‐D, Comparison of (B) Vash2 mRNA expression (n = 3), (C) proliferation using WST‐1 assay (n = 2) and (D) migration using the Boyden chamber (n = 3) in KPC stable clones expressing control vector (KPC/shControl) or mouse Vash2 shRNA vector (KPC/shVash2#1, KPC/shVash2#2). E, F, Comparison of (E) VASH2 mRNA expression, (F) migration in PANC‐1 cells stably transfected with control vector (PANC‐1/shControl) or human Vash2 shRNA vector (PANC‐1/shVASH2#1, PANC‐1/shVASH2#2) (n = 3). G, H, Comparison of (G) VASH2 mRNA expression and (H) migration of SUIT‐2 cells infected with LacZ adenovirus (AdLacZ) or human VASH2 adenovirus (AdVASH2) (n = 3). Error bars represent SD. Scale bars are 500 μm (A) and 100 μm (D, F, H). *< .05, **< .01
Figure 2
Figure 2
Knockdown of vasohibin‐2 (Vash2) expression inhibited pancreatic ductal adenocarcinoma progression in a mouse model. A, Representative lung images and wet weight quantification of lung in nude mice injected with KPC/shControl (n = 4) or KPC/shVash2 (n = 3) cells into the tail vein. B‐F, KPC/shControl (n = 11) or KPC/shVash2 (n = 8) cells were orthotopically injected into the pancreas of wild‐type mice. B, Representative images of dissected mice. Primary tumors are delimited by the dashed lines. Yellow arrows indicate mesentery metastases. C, Representative images of excised primary tumor specimens and tumor weights are shown. D, Incidence of metastasis or invasion confirmed by autopsy. Fisher's exact test was used in analysis. *< .05. E, Representative data of H&E staining of liver metastasis and quantification of metastases (n = 3‐4). Scale bars are 500 μm. F, Measurements of volume of ascites. G, Kaplan‐Meier analysis of survival rates in the orthotopic model injected with KPC/shControl (n = 11) or KPC/shVash2 (n = 7). Log‐rank test was used in analysis. P = .002. Student's t test was used in (A‐C, E and F). *< .05
Figure 3
Figure 3
Deletion of vasohibin‐2 (Vash2) gene suppressed pancreatic ductal adenocarcinoma (PDAC) metastasis in KPC mice. A, Table shows incidence of primary tumor, invasion and metastasis in KPC,KPC/Vash2 LacZ/+ mice and KPC/Vash2 LacZ/LacZ mice. B, Representative histological images of PDAC in KPC mice showing well‐differentiated adenocarcinoma (upper left), moderately differentiated adenocarcinoma (upper right), poorly differentiated adenocarcinoma (bottom left), and sarcomatoid carcinoma (bottom right). H&E staining. Scale bars indicate 100 μm. C, Table shows raw number of each differentiation status of PDAC in KPC mice (n = 6), KPC/Vash2 LacZ/+ mice (n = 6), and KPC/Vash2 LacZ/LacZ mice (n = 6)
Figure 4
Figure 4
Vasohibin‐2 (Vash2) increased α‐tubulin detyrosination for cancer cell migration. A, Western blotting of detyrosinated α‐tubulin and total α‐tubulin in KPC/shControl and KPC/shVash2 clones was carried out (n = 3). Quantification of the western blotting is shown on the right. B, Representative images of double fluorescent immunohistochemical staining for detyrosinated α‐tubulin (green), total α‐tubulin (red) in the orthotopic tumors formed by KPC/shControl and KPC/shVash2 clones. C, Quantification of detyrosinated α‐tubulin immunofluorescence intensity (n = 4). D, Western blotting of VASH2, detyrosinated tubulin and α‐tubulin in SUIT‐2 cells infected with AdLacZ or AdVASH2 and treated with DMSO (‐) or indicated concentration of parthenolide for 48 h. Quantification data are shown on the right. E, SUIT‐2 cells were infected with AdLacZ or AdVASH2 and incubated for 48 h. Thereafter, migration assay was carried out in the presence of DMSO (‐) or 5 μmol/L parthenolide (n = 3). Quantification of the western blotting is shown on the right. Error bars represent standard deviation (SD). Scale bars are 100 μm. *< .05, **< .01
Figure 5
Figure 5
Vasohibin‐2 (Vash2) depletion suppressed tumor angiogenesis in pancreatic ductal adenocarcinoma (PDAC). Representative images and quantification of positive area of fluorescent immunohistochemical (IHC) staining for CD31 in (A) orthotopic KPC tumor (n = 4) and (B) KPC mice (n = 7). KPC cells were injected into 5‐8‐wk‐old WT mice, and mice were killed after 25‐28 d for IHC. KPC mice were killed at endpoint and used. At least three images per sample were analyzed. Scale bars are 200 μm (A) and 100 μm (B). **< .01
Figure 6
Figure 6
Vasohibin‐2 (Vash2) modulated the expression of inflammatory chemokines and cytokines in pancreatic ductal adenocarcinoma (PDAC) cells. A, Pathway enrichment analysis (by Metascape) of genes downregulated by Vash2 knockdown in KPC cells. B, Quantification of nuclear factor kappa B (NFkB) activity in KPC/shControl and KPC/shVash2 clones using luciferase reporter assay. (n = 3). C, Quantification of chemokine and cytokine mRNA expression in KPC/shControl and KPC/shVash2 clones (n = 3). D, Quantification of chemokine and cytokine mRNA expression in the PDAC of KPC mice and KPC/Vash2 LacZ/LacZ mice (n = 7). Error bars represent SEM (B, C) and SD (D). *< .05, **< .01. NS, not significant
Figure 7
Figure 7
Vasohibin‐2 (Vash2) modulated myeloid derived suppressor cell accumulation and T‐cell infiltration in pancreatic ductal adenocarcinoma (PDAC). A, Representative images and quantification of CD11b and Ly6G double‐positive area in spontaneous PDAC tumor of KPC mice and Vash2 LacZ/LacZ KPC mice. (n = 7). B, Immunohistochemical (IHC) staining of CD3 and CD8 in the tumors. Boxplots on the right show quantification of cells stained with the indicated antibodies (n = 7). Mice were killed at endpoint and used for IHC. Scale bars are 100 μm. *< .05, **< .01
Figure 8
Figure 8
Schematic model illustrating the role of vasohibin‐2 (VASH2) in pancreatic ductal adenocarcinoma (PDAC). VASH2‐dependent increase in tubulin detyrosination directly accelerates the migration of PDAC cells. In the tumor microenvironment, VASH2 promotes tumor angiogenesis as a result of paracrine activity and the evasion of tumor immunity as a result of altered gene expression in PDAC cells. GMCSF, granulocyte‐macrophage colony‐stimulating factor; MDSC, myeloid derived suppressor cells

References

    1. Tuveson DA, Neoptolemos JP. Understanding metastasis in pancreatic cancer: a call for new clinical approaches. Cell. 2012;148(1–2):21‐23. - PubMed
    1. Neesse A, Michl P, Frese KK, et al. Stromal biology and therapy in pancreatic cancer. Gut. 2011;60:861‐868. - PubMed
    1. Ireland L, Santos A, Ahmed MS, et al. Chemoresistance in pancreatic cancer is driven by stroma‐derived insulin‐like growth factors. Cancer Res. 2016;76(23):6851‐6863. - PMC - PubMed
    1. Steele CW, Karim SA, Leach JDG, et al. CXCR4 inhibition profoundly suppresses metastases and augments immunotherapy in pancreatic ductal adenocarcinoma. Cancer Cell. 2016;29(6):832‐845. - PMC - PubMed
    1. Mitchem JB, Brennan DJ, Knolhoff BL, et al. Targeting tumor‐infiltrating macrophages decreases tumor‐initiating cells, relieves immunosuppression, and improves chemotherapeutic responses. Cancer Res. 2013;73(3):1128‐1141. - PMC - PubMed

MeSH terms