. 2019 May 1;20(Suppl 7):195.
doi: 10.1186/s12859-019-2734-4.

Investigation of lipid metabolism dysregulation and the effects on immune microenvironments in pan-cancer using multiple omics data

Affiliations

Investigation of lipid metabolism dysregulation and the effects on immune microenvironments in pan-cancer using multiple omics data

Yang Hao et al. BMC Bioinformatics. .

Abstract

Background: Lipid metabolism reprogramming is a hallmark for tumor which contributes to tumorigenesis and progression, but the commonality and difference of lipid metabolism among pan-cancer is not fully investigated. Increasing evidences suggest that the alterations in tumor metabolism, including metabolite abundance and accumulation of metabolic products, lead to local immunosuppression in the tumor microenvironment. An integrated analysis of lipid metabolism in cancers from different tissues using multiple omics data may provide novel insight into the understanding of tumorigenesis and progression.

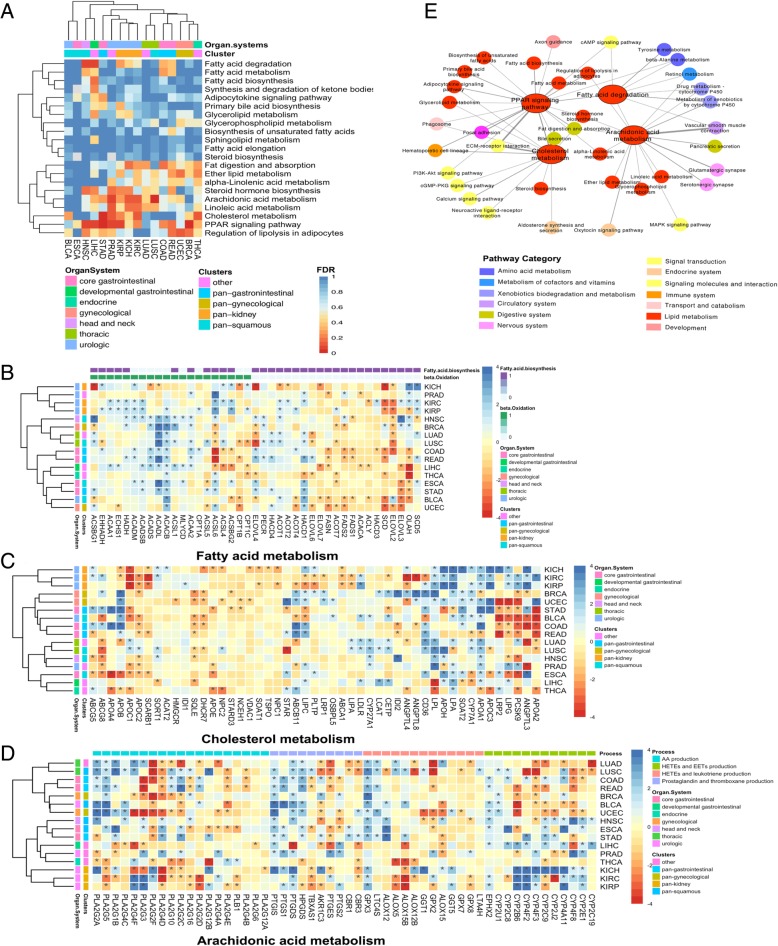
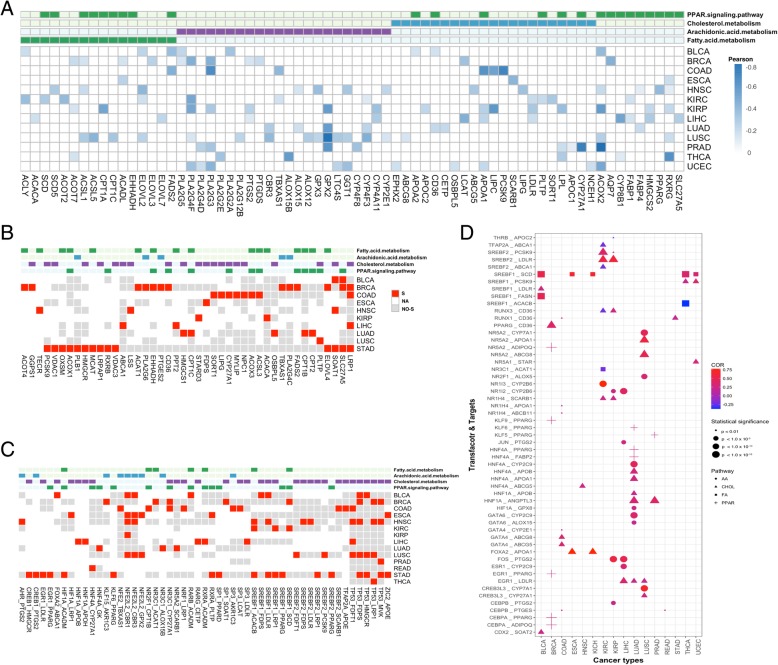
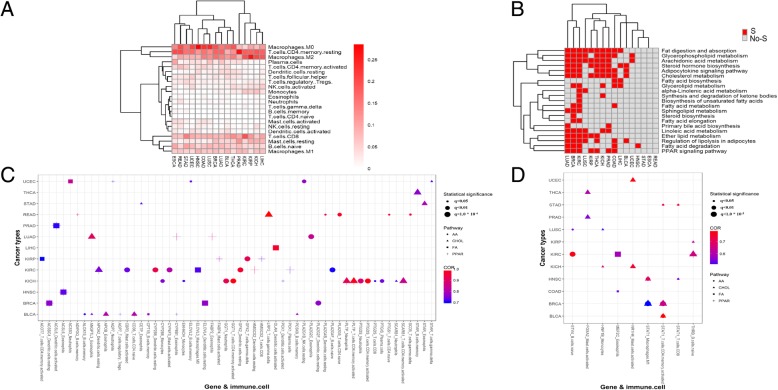
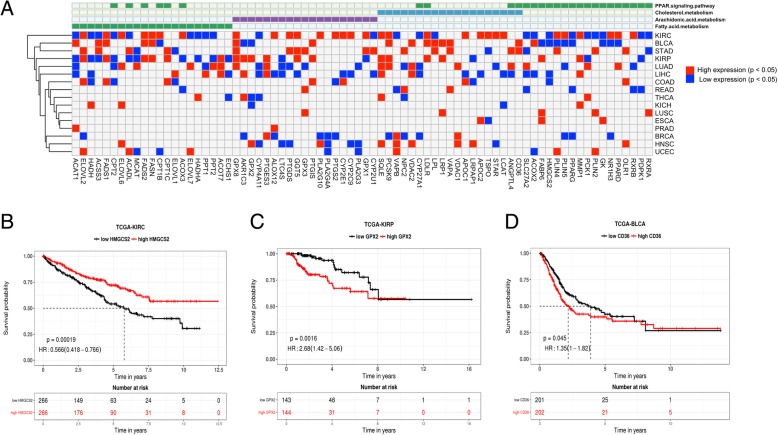
Results: Through systematic analysis of the multiple omics data from TCGA, we found that the most-widely altered lipid metabolism pathways in pan-cancer are fatty acid metabolism, arachidonic acid metabolism, cholesterol metabolism and PPAR signaling. Gene expression profiles of fatty acid metabolism show commonalities across pan-cancer, while the alteration in cholesterol metabolism and arachidonic acid metabolism differ with tissue origin, suggesting tissue specific lipid metabolism features in different tumor types. An integrated analysis of gene expression, DNA methylation and mutations revealed factors that regulate gene expression, including the differentially methylated sites and mutations of the lipid genes, as well as mutation and differential expression of the up-stream transcription factors for the lipid metabolism pathways. Correlation analysis of the proportion of immune cells in the tumor microenvironment and the expression of lipid metabolism genes revealed immune-related differentially expressed lipid metabolic genes, indicating the potential crosstalk between lipid metabolism and immune response. Genes related to lipid metabolism and immune response that are associated with poor prognosis were discovered including HMGCS2, GPX2 and CD36, which may provide clues for tumor biomarkers or therapeutic targets.

Conclusions: Our study provides an integrated analysis of lipid metabolism in pan-cancer, highlights the perturbation of key metabolism processes in tumorigenesis and clarificates the regulation mechanism of abnormal lipid metabolism and effects of lipid metabolism on tumor immune microenvironment. This study also provides new clues for biomarkers or therapeutic targets of lipid metabolism in tumors.

Keywords: Lipid metabolism; Multiple omics analysis; Pan-cancer; Tumor immune micro-environment.


Conflict of interest statement

Ethics approval and consent to participate

Not applicable.

Consent for publication

Not applicable.

Competing interests

The authors declare that they have no competing interests.

Publisher’s Note

Springer Nature remains neutral with regard to jurisdictional claims in published maps and institutional affiliations.

Figures

Fig. 1
Fig. 1
Alterations in the lipid metabolism pathways and the crosstalk with other pathways. a Heatmap of the enrichment significance score (colored by FDR) of lipid metabolism pathways from the KEGG pathways in pan-cancer. b, (c) and (d) Heatmaps of differentially expressed genes (blue: down-regulation; red: up-regulation) related fatty acid metabolism, cholesterol metabolism and arachidonic acid metabolism in pan-cancer. Significantly differentially expressed genes were highlighted with * (FDR < 0.05). e The network of lipid metabolism pathways with other pathway with shared differentially expressed genes. Pathways were colored by their pathway categories
Fig. 2
Fig. 2
Multiple mechanisms contribute to dysregulation of lipid metabolism genes in cancer. a Pearson correlation estimation (p < 0.05) of the association between mRNA expression and DNA methylation in the promoter region across pan-cancer. b Gene mutation versus its mRNA expression (red color represents there is significant (wilcox test, p < 0.05) difference of the mRNA expression between the mutated group and the non-mutated group, while grey color represents that no significant difference observed between the mutated group and the non-mutated group. To perform statistic testing, the number of samples in either the mutated group or the non-mutated group should be greater or equal to three. The white color represents the gene is with less than three mutated samples.). c Transcription factor mutation versus targets expression (Color as the same as B). d Pearson correlation estimates of association between the expression of transcript factors and their target genes across pan-cancer. The circle size is proportional to the significance level of correlation results
Fig. 3
Fig. 3
The correlation between lipid metabolism and the immune cells in tumor micro-environment. a Heatmap of the average proportion of the immune cells (colored by proportion) in pan-cancer. b Heatmap of enrichment significance of lipid metabolism related pathways from KEGG pathways for the differentially expressed lipid metabolism genes which are significantly related immune in pan-cancer (colored by FDR, red represented significant enrichment (FDR < 0.05) and grey represented the non-significant enrichment (FDR > = 0.05)). c Pearson correlation between the expression of differentially expressed lipid metabolism related genes and the proportion of immune cell in pan-cancer. d Pearson correlation between the expression of differentially expressed transcription factors and the proportion of immune cell for pan-cancer
Fig. 4
Fig. 4
Prognosis impact of genes in key lipid metabolism pathways. a Genes in the four key altered lipid metabolism pathways which are associated with prognosis. Red represents high gene expression significantly reduces the patient’s overall survival time and blue represents low gene expression significantly reduces the patient’s overall survival time. b, (c) and (d) Kaplan-Meier survival curve for tumors stratified by high or low expression levels of (b) HMGCS2, (C) GPX2 and (d) CD36 (the high or low expression level groups were stratified by the median expression value). P-value indicates significance levels from the comparison of survival curves using the Log-rank test

References

    1. Hanahan D, Weinberg RA. Hallmarks of cancer: the next generation. Cell. 2011;144(5):646–674. doi: 10.1016/j.cell.2011.02.013. - DOI - PubMed
    1. Currie E, Schulze A, Zechner R, Walther TC, Farese RV., Jr Cellular fatty acid metabolism and cancer. Cell Metab. 2013;18(2):153–161. doi: 10.1016/j.cmet.2013.05.017. - DOI - PMC - PubMed
    1. Fahy E, Cotter D, Sud M, Subramaniam S. Lipid classification, structures and tools. Biochim Biophys Acta. 2011;1811(11):637–647. doi: 10.1016/j.bbalip.2011.06.009. - DOI - PMC - PubMed
    1. Peng X, Chen Z, Farshidfar F, Xu X, Lorenzi PL, Wang Y, Cheng F, Tan L, Mojumdar K, Du D. Molecular characterization and clinical relevance of metabolic expression subtypes in human cancers. Cell Rep. 2018;23(1):255. doi: 10.1016/j.celrep.2018.03.077. - DOI - PMC - PubMed
    1. Renner K, Singer K, Koehl GE, Geissler EK, Peter K, Siska PJ, Kreutz M. Metabolic hallmarks of tumor and immune cells in the tumor microenvironment. Front Immunol. 2017;8:248. doi: 10.3389/fimmu.2017.00248. - DOI - PMC - PubMed

Substances

LinkOut - more resources