. 2019 Aug 1;101(2):347-359.
doi: 10.1093/biolre/ioz089.

A segregating human allele of SPO11 modeled in mice disrupts timing and amounts of meiotic recombination, causing oligospermia and a decreased ovarian reserve†

Affiliations

A segregating human allele of SPO11 modeled in mice disrupts timing and amounts of meiotic recombination, causing oligospermia and a decreased ovarian reserve†

Tina N Tran et al. Biol Reprod. .

Abstract

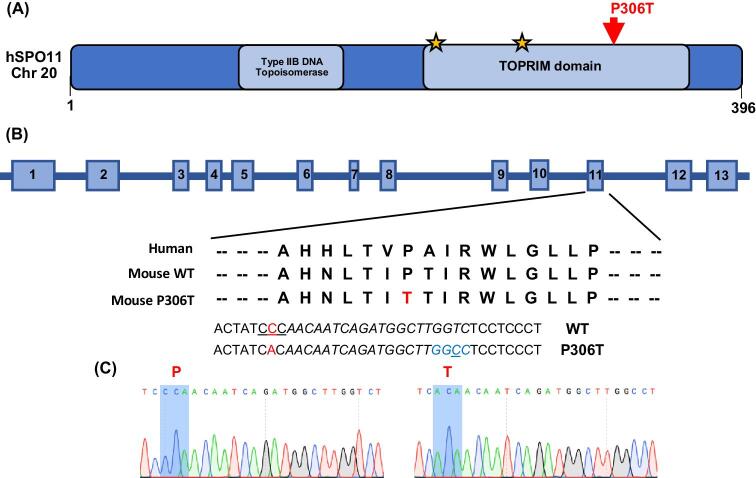
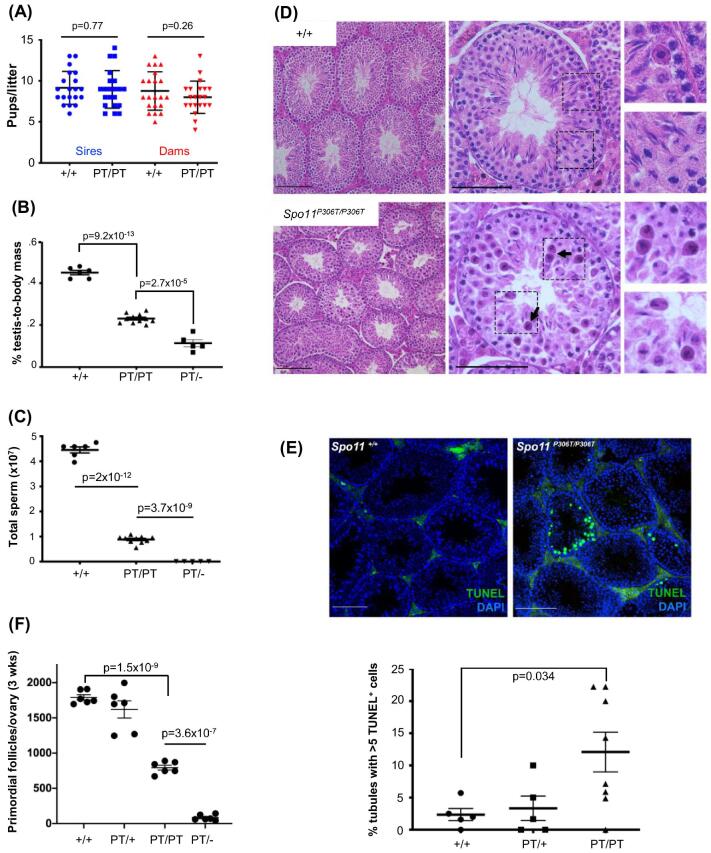
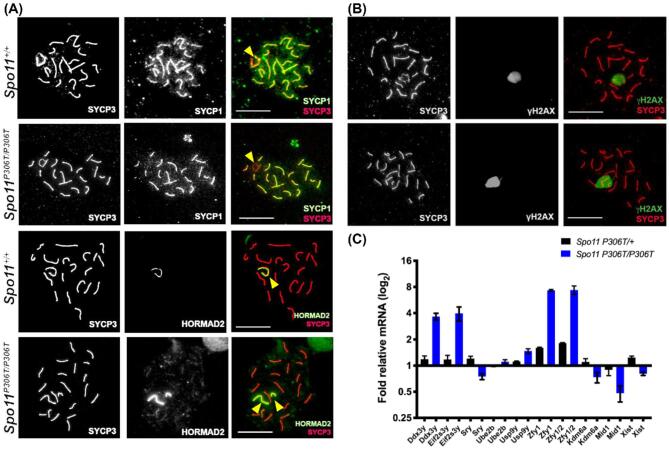
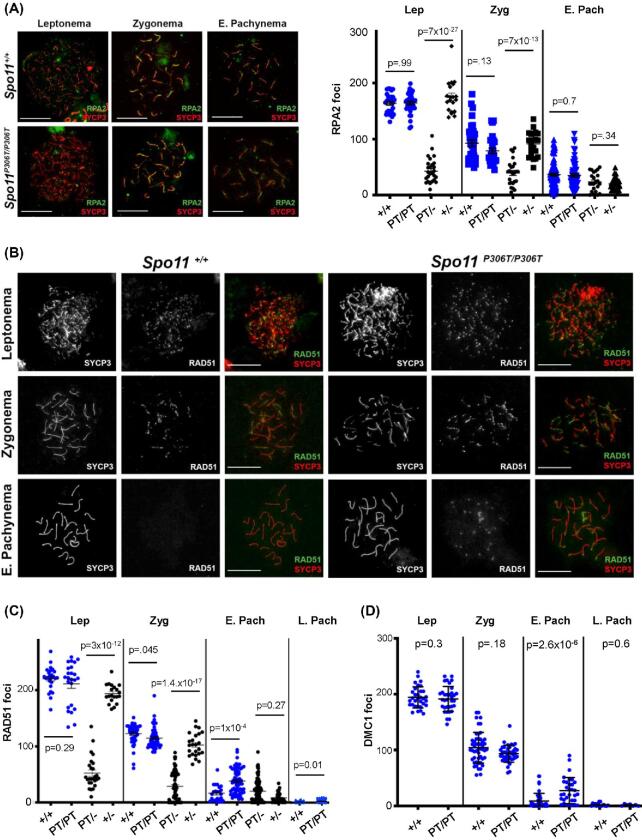
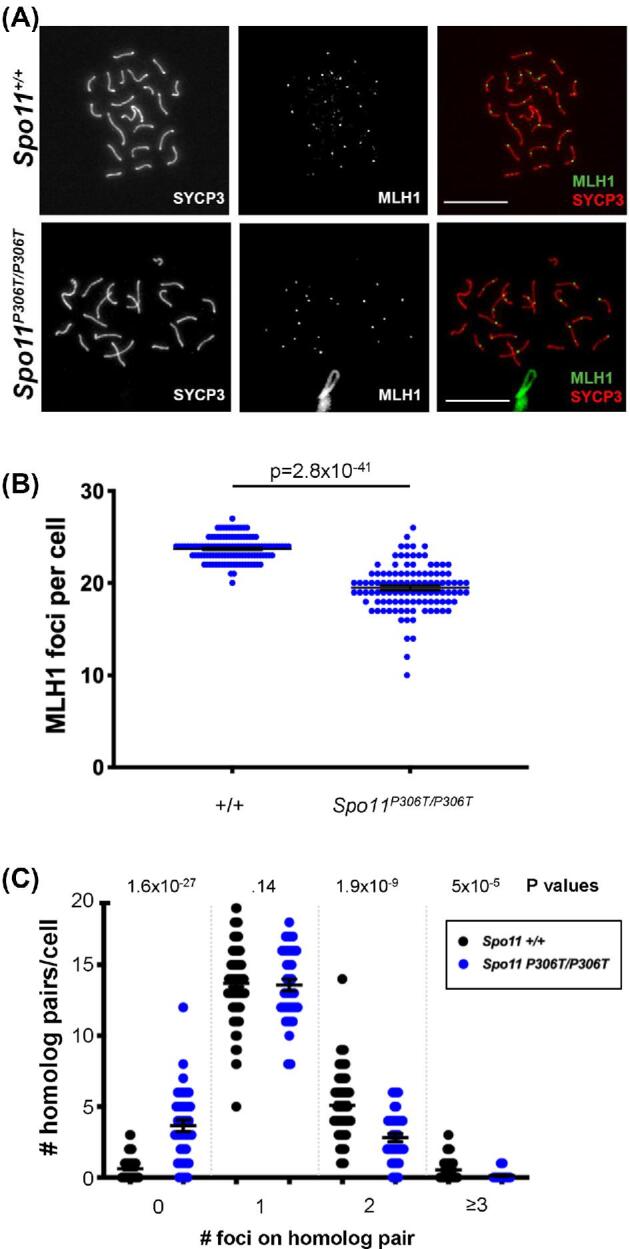
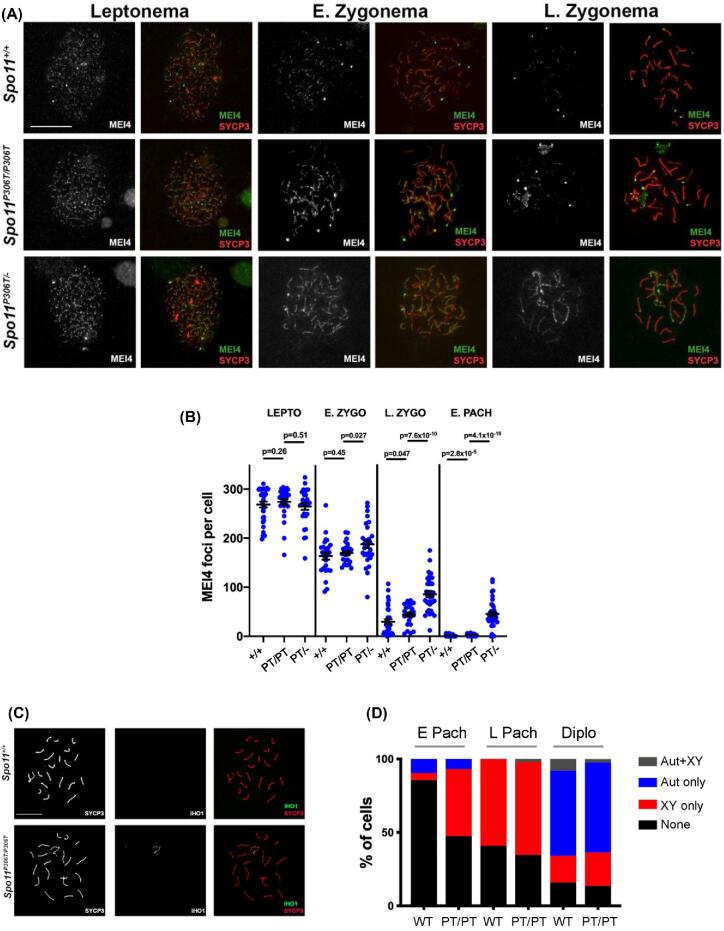
A major challenge in medical genetics is to characterize variants of unknown significance (VUS). Doing so would help delineate underlying causes of disease and the design of customized treatments. Infertility has presented an especially difficult challenge with respect to not only determining if a given patient has a genetic basis, but also to identify the causative genetic factor(s). Though genome sequencing can identify candidate variants, in silico predictions of causation are not always sufficiently reliable so as to be actionable. Thus, experimental validation is crucial. Here, we describe the phenotype of mice containing a non-synonymous (proline-to-threonine at position 306) change in Spo11, corresponding to human SNP rs185545661. SPO11 is a topoisomerase-like protein that is essential for meiosis because it induces DNA double stranded breaks (DSBs) that stimulate pairing and recombination of homologous chromosomes. Although both male and female Spo11P306T/P306T mice were fertile, they had reduced sperm and oocytes, respectively. Spermatocyte chromosomes exhibited synapsis defects (especially between the X and Y chromosomes), elevated apoptotic cells, persistent markers of DSBs, and most importantly, fewer Type 1 crossovers that causes some chromosomes to have none. Spo11P306T/- mice were sterile and made fewer meiotic DSBs than Spo11+/- animals, suggesting that the Spo11P306T allele is a hypomorph and likely is delayed in making sufficient DSBs in a timely fashion. If the consequences are recapitulated in humans, it would predict phenotypes of premature ovarian failure, reduced sperm counts, and possible increased number of aneuploid gametes. These results emphasize the importance of deep phenotyping in order to accurately assess the impact of VUSs in reproduction genes.

Keywords: double strand breaks; infertility genetics; meiosis; oogenesis; recombination; spermatogenesis.


Figures

Figure 1.
Figure 1.
SPO11 structure and CRISPR-Cas9 editing strategy. (A) Schematic of human SPO11 protein with known domains and location of the P306T targeted alteration. Stars indicate known metal binding sites. (B) Organization of human SPO11. The SPO11 P306T variant encoded by SNP rs185545661 is located in exon 11. The red nucleotides are in the codon encoding P306 and T306 and indicate the nucleotide (C) changed by homologous recombination. Blue nucleotides indicate a designed silent HaeIII restriction enzyme site added to the mouse allele via editing of T to the underlined C, and the underlined CCC indicates the PAM site. Italicized sequence corresponds to guide sequence. (C) Sanger sequencing chromatograms of WT and Spo11P306T/P306T mice, with the relevant codon bases shaded blue.
Figure 2.
Figure 2.
Spo11P306T/P306T mice are fertile, but have fewer sperm and a reduced ovarian reserve. (A) Litter sizes from matings of 2–9-month-old Spo11+/+ (+/+) and Spo11P306T/P306T (PT/PT) males (n = 3 and 4, respectively) and females (n = 3 and 4, respectively) (red) to WT partners. Average litter sizes (±SEM) produced by WT and mutant males (blue) were 9.2 ± 0.45 and 9.0 ± 0.5, respectively, and from WT and mutant females (red) were 8.8 ± 0.51 and 8 ± 0.44, respectively. (B) Percentage of testis mass relative to body mass of 2-month-old males (each data point is one animal, using average weight of both testes). Averages were 0.45 ± 0.01, 0.42 ± 0.021, 0.23 ± 0.006 and 0.11 ± 0.0045 for each genotype from left to right. (C) Sperm counts from cauda epididymides of 2-month-old males. Averages from left to right were 43 × 106 ± 3.5 × 106, 41 × 106 ± 2.8 × 106, 8.8 × 106 ± 7.4 × 105 and zero. (D) Hematoxylin and eosin (H&E) staining of testis cross-sections from 2-month-old males. Left and middle panel size bars = 75 μm. Examples of pyknotic-appearing cells with unusual metaphase plates are indicated with arrows. Right panels are magnifications (2X) of the corresponding dashed boxes. (E) Elevated apoptosis in Spo11P306T testes. Testis cross-sections from 2–4-month-old males were labeled with TUNEL and DAPI to detect apoptotic cells. Size bar = 75 μm. The number of seminiferous tubule cross sections with 5 or more TUNEL-positive cells is plotted below. Each data point corresponds to one testis. See Methods for details. (F) Quantification of primordial follicles from 3-week-old ovaries. Each symbol represents one ovary. Averages: +/+ n = 3, 1790 ± 38; Spo11P306T/+ n = 3, 1620 ± 122; Spo11P306T/P306T n = 3, 794 ± 35; Spo11P306T/ n = 3, 93 ± 18. All statistics were done using paired Student T-test. Average ± SEM.
Figure 3.
Figure 3.
Sex chromosome pairing and silencing defects in Spo11P306T/P306T spermatocytes. (A) Representative pachytene chromosome surface spreads immunolabeled for indicated proteins. The third column is a merge of the first two columns. HORMAD2 labels unsynapsed regions of chromosomes, including the non-pseudoautosomal region of the XY pair. In the examples shown here, the X and Y chromosomes (yellow arrowheads) are not synapsed in the Spo11P306T/P306T spermatocytes (unstained in the PAR by the synapsis marker SYCP1; and entirely unpaired in the HORMAD2 example). Size bar = 20 μm. (B) Assessment of DNA damage and silencing in pachytene spermatocytes. Meiotic chromosome spreads were immunolabeled for γH2AX and SYCP3. Size bar = 20 μm. The mutant XY body shows normal staining for γH2AX, a marker of both DNA damage and heterochromatin, even in cases where there is XY asynapsis. For each genotype, 50 cells from each of 3 animals were examined. (C) RT-qPCR of X-linked genes from P15 testes relative to WT GAPDH. N = 3 animals for each genotype.
Figure 4.
Figure 4.
Assessment of DSB formation and repair in Spo11P306T/P306T mutants throughout meiotic prophase I. (A) Meiotic chromosome surface spreads immunolabeled with RPA2 and SYCP3 at different Prophase I substages. E, early. Here and in panel “b,” pachytene substage (early vs late) was determined on the basis of H1t staining (only late pachynema is positive for H1t; staining not included in these images). Size bar = 20μm. Quantification of RPA2 foci throughout Prophase I is plotted on the right. Actual numbers are as follows. Leptonema: +/+ (n = 3 mice, cells = 22, avg = 164 ± 3.8), Spo11P306T/P306T (n = 3, cells = 27, avg = 164 ± 3.5), Spo11P306T/ (n = 2, cells = 23, avg = 39 ± 6.2), Spo11+/- (n = 2, cells = 20, avg = 175 ± 6.6); Zygonema: +/+ (n = 3, cells = 36, avg = 93 ± 5.9), Spo11P306T/P306T (n = 3, cells = 27, average = 81 ± 3.8), Spo11P306T/ (n = 2, cells = 28, avg = 37 ± 4.4), Spo11+/- (n = 2, cells = 29, avg = 92 ± 4.7); Early pachynema: +/+ (n = 3, cells = 87, avg = 37 ± 2.4), Spo11P306T/P306T (n = 3, cells = 72, avg = 35 ± 2.7), Spo11P306T/ (n = 2, cells = 29, avg = 24 ± 4.5), Spo11+/- (n = 2, cells = 24, avg = 20 ± 2.2). (B) Meiotic chromosome spreads immunolabeled for RAD51 foci during indicated prophase substages. Size bar = 20μm. (C) Quantification of RAD51 foci at prophase I substages. Actual numbers are as follows: leptonema: +/+ (n = 4, cells = 26, avg = 220 ± 4.1), Spo11P306T/P306T (n = 5, cells = 24, avg = 211 ± 7.8), Spo11P306T/(n = 5, cells = 23, avg = 70 ± 7.9), Spo11+/ (n = 2, cells = 17, avg = 193 ± 4.3); zygonema: +/+ (n = 4, cells = 43, avg = 122 ± 2.8), Spo11P306T/P306T (n = 5, cells = 52, avg = 115 ± 2.6), Spo11P306T/ (n = 5, cells = 59, avg = 30 ± 3.6), Spo11+/- (n = 2, cells = 25, avg = 101 ± 4.7); early pachynema: +/+ (n = 4, cells = 23, avg = 14.2 ± 2.6), Spo11P306T/P306T (n = 5, cells = 70, avg 40.8 ± 3.4), Spo11P306T/ (n = 5, cells = 80, avg = 15 ± 1.2), Spo11+/- (n = 2, cells = 37, avg = 8.7 ± 1.5). (D) Quantification of DMC1 levels at prophase I substages. Leptonema: WT (n = 3, cells = 32, avg = 194 ± 3.3) vs mutant (n = 3, cells = 32, avg = 189 ± 3.6); zygonema: WT (n = 3, cells = 33, avg = 99 ± 4.6) vs mutant (n = 3, n = 33, avg = 92 ± 2.8); early pachynema: WT (n = 3, cells = 47, avg = 8.9 ± 2.0) vs mutant (n = 3, cells = 32, avg = 27 ± 4.1, P = 2.6 × 10−5); Late pachynema: WT (n = 3, cells = 20, avg = 2.2 ± 0.89) vs mutant (n = 3, cells = 20, avg = 1.6 ± 0.51). All statistics were done using unpaired Student T-test. Avg ± SEM.
Figure 5.
Figure 5.
Spo11P306T/P306T oocytes have delayed DSB formation but die from unrepaired DSBs in late Prophase I. (A) Representative P0 oocyte chromosome spreads immunolabeled with RAD51 and SYCP3. Size bar = 25μm. “MUT” refers to Spo11P306T/P306T. (B) Quantification of RAD51 foci. Late zygonema: WT (n = 2, cells = 18, avg = 36 ± 4.3) vs mutant (n = 2, cells = 37, avg = 23 ± 3.7); pachynema: WT (n = 2, cells = 24, avg = 5.5 ± 1.1) vs mutant (w = 2, cells = 70, avg = 10 ± 1.5); diplonema: WT (n = 2, cells = 20, avg = 0.9 ± 0.3) vs mutant (n = 2, cells = 48, avg = 3 ± 0.7). Avg ± SEM. (C) Quantification of primordial follicles in 3 week old females, with or without an intact DNA damage checkpoint. The leftmost 3 datasets and the lightmost dataset are identical to those in Figure 2F. Each data point is one ovary, and both ovaries were counted from each female. Statistics done by Student's t-test.
Figure 6.
Figure 6.
Spo11P306T/P306T spermatocytes have fewer MLH1 foci, indicative of reduced crossovers. (A) Chromosome spreads of pachytene spermatocytes immunolabeled with MLH1 and SYCP3. Size bar = 20μM. (B) Quantification of MLH1 foci. Actual numbers are as follows: WT (n = 3, cells = 118, avg = 23.7 ± 0.12), and Spo11P306T/P306T (n = 4, cells = 108, avg = 19.6 ± 0.2). Avg ± SEM. (C)Spo11P306T/P306T spermatocytes have an increased incidence of chromosomes lacking an apparent crossover (MLH1 focus). N = 3 mice for each genotype. For WT and mutant, 102 and 58 cells were scored, respectively. All statistics were done using paired Student t-test. Avg ± SEM.
Figure 7.
Figure 7.
Pre-DSB recombinosomes persist on chromosome axes of Spo11P306T/P306T and Spo11P306T/. (A) Chromosome surface spreads of spermatocytes immunolabeled with MEI4 and SYCP3. Size bar = 20μm. (B) Quantification of MEI4 foci at different phases of prophase I. Actual numbers are as follows. Leptonema: WT (n = 2 mice, cells = 27, avg = 163 ± 7.1), Spo11P306T/P306T (n = 3, cells = 25, avg = 169 ± 4.1), and Spo11P306T/- (n = 2, cells = 29, avg = 188 ± 7.9); early zygonema: WT (n = 2, cells = 32, avg = 29.7 ± 5.1), Spo11P306T/P306T (n = 3, cells = 25, avg = 44 ± 4.3) and Spo11P306T/- (n = 2, cells = 35, avg = 86 ± 5.9); late zygonema: WT (n = 2, cells = 51, avg = 1.2 ± 0.26), Spo11P306T/P306T (n = 3, cells = 48, avg = 2.8 ± 5.9) and Spo11P306T/- (n = 2, cells = 38, avg = 45 ± 4.5). Pachynema: WT (n = 2, cells = 51, avg = 1.2 ± 0.3), Spo11P306T/P306T (n = 3, cells = 48, avg = 2.8 ± 5.9), and Spo11P306T/- (n = 2, cells = 38, avg = 45.4 ± 4.5). (C) Chromosome spreads of pachytene spermatocytes immunolabeled with IHO1 and SYCP3. Size bar = 20μm. (D) Percentage of early and late pachytene and diplotene spermatocytes with indicated IHO1 localization patterns. Early pachynema: WT (n = 2, cells = 40) and Spo11P306T/P306T (n = 3, cells = 60); late pachynema: WT (n = 2, cells = 30) and Spo11P306T/P306T (n = 3, cells = 60); diplonema: WT (n = 2, cells = 30) and Spo11P306T/P306T (n = 3, cells = 30). Aut = autosomes; PT = Spo11P306T/P306T. All statistics were done using paired Student t-test. Avg ± SEM.

References

    1. Robert T, Nore A, Brun C, Maffre C, Crimi B, Bourbon HM, de Massy B. The TopoVIB-Like protein family is required for meiotic DNA double-strand break formation. Science 2016; 351(6276):943–949. - PubMed
    1. Romanienko PJ, Camerini-Otero RD. The mouse Spo11 gene is required for meiotic chromosome synapsis. Mol Cell 2000; 6(5):975–987. - PubMed
    1. Baudat F, Manova K, Yuen JP, Jasin M, Keeney S. Chromosome synapsis defects and sexually dimorphic meiotic progression in mice lacking Spo11. Mol Cell 2000b; 6(5):989–998. - PubMed
    1. Vrielynck N, Chambon A, Vezon D, Pereira L, Chelysheva L, De Muyt A, Mézard C, Mayer C, Grelon M. A DNA topoisomerase VI-like complex initiates meiotic recombination. Science 2016; 351(6276):939–943. - PubMed
    1. Stanzione M, Baumann M, Papanikos F, Dereli I, Lange J, Ramlal A, Tränkner D, Shibuya H, de Massy B, Watanabe Y, Jasin M, Keeney S, et al. Meiotic DNA break formation requires the unsynapsed chromosome axis-binding protein IHO1 (CCDC36) in mice. Nat Cell Biol 2016; 18(11):1208–1220. - PMC - PubMed

Publication types

Substances