

Association of Brain Magnetic Resonance Imaging Signs With Cognitive Outcomes in Persons With Nonimpaired Cognition and Mild Cognitive Impairment
- PMID: 31074810
- PMCID: PMC6512274
- DOI: 10.1001/jamanetworkopen.2019.3359
Association of Brain Magnetic Resonance Imaging Signs With Cognitive Outcomes in Persons With Nonimpaired Cognition and Mild Cognitive Impairment
Abstract
Importance: Brain atrophy and vascular lesions contribute to dementia and mild cognitive impairment (MCI) in clinical referral populations. Prospective evidence in older general populations is limited.
Objective: To evaluate which magnetic resonance imaging (MRI) signs are independent risk factors for dementia and MCI.
Design, setting, and participants: This population-based cohort study included 1553 participants sampled from the Atherosclerosis Risk in Communities Study who had brain MRI scans and were dementia free during visit 5 (June 2011 to September 2013). Participants' cognitive status was evaluated through visit 6 (June 2016 to December 2017).
Exposures: Brain regional volumes, microhemorrhages, white matter hyperintensity (WMH) volumes, and infarcts measured on 3-T MRI.
Main outcomes and measures: Cognitive status (dementia, MCI, or nonimpaired cognition) was determined from in-person evaluations. Dementia among participants who missed visit 6 was identified via dementia surveillance and hospital discharge or death certificate codes. Cox proportional hazards models were used to evaluate the risk of dementia in 3 populations: dementia-free participants (N = 1553), participants with nonimpaired cognition (n = 1014), and participants with MCI (n = 539). Complementary log-log models were used for risk of MCI among participants with nonimpaired cognition who also attended visit 6 (n = 767). Models were adjusted for demographic variables, apolipoprotein E ε4 alleles, vascular risk factors, depressive symptoms, and heart failure.
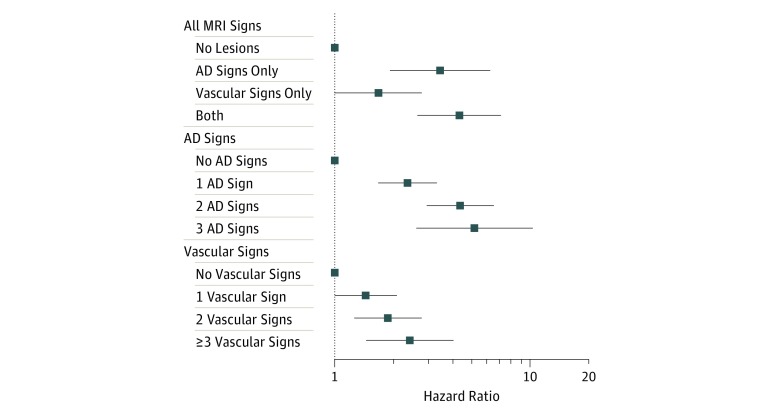
Results: Overall, 212 incident dementia cases were identified among 1553 participants (mean [SD] age at visit 5, 76 [5.2] years; 946 [60.9%] women; 436 [28.1%] African American) with a median (interquartile range) follow-up period of 4.9 (4.3-5.2) years. Significant risk factors of dementia included lower volumes in the Alzheimer disease (AD) signature region, including hippocampus, entorhinal cortex, and surrounding structures (hazard ratio [HR] per 1-SD decrease, 2.40; 95% CI, 1.89-3.04), lobar microhemorrhages (HR, 1.90; 95% CI, 1.30-2.77), higher volumes of WMH (HR per 1-SD increase, 1.44; 95% CI, 1.23-1.69), and lacunar infarcts (HR, 1.66; 95% CI, 1.20-2.31). The AD signature region volume was also consistently associated with both MCI and progression from MCI to dementia, while subcortical microhemorrhages and infarcts contributed less to the progression from MCI to dementia.
Conclusions and relevance: In this study, lower AD signature region volumes, brain microhemorrhages, higher WMH volumes, and infarcts were risk factors associated with dementia in older community-based residents. Vascular changes were more important in the development of MCI than in its progression to dementia, while AD-related signs were important in both stages.
Conflict of interest statement
Figures
References
Publication types
MeSH terms
Grants and funding
LinkOut - more resources
Full Text Sources
Medical
