. 2019 Jul 2;91(13):8025-8035.
doi: 10.1021/acs.analchem.8b04615. Epub 2019 Jun 18.

A Comprehensive UHPLC Ion Mobility Quadrupole Time-of-Flight Method for Profiling and Quantification of Eicosanoids, Other Oxylipins, and Fatty Acids

Affiliations

A Comprehensive UHPLC Ion Mobility Quadrupole Time-of-Flight Method for Profiling and Quantification of Eicosanoids, Other Oxylipins, and Fatty Acids

Christine Hinz et al. Anal Chem. .

Abstract

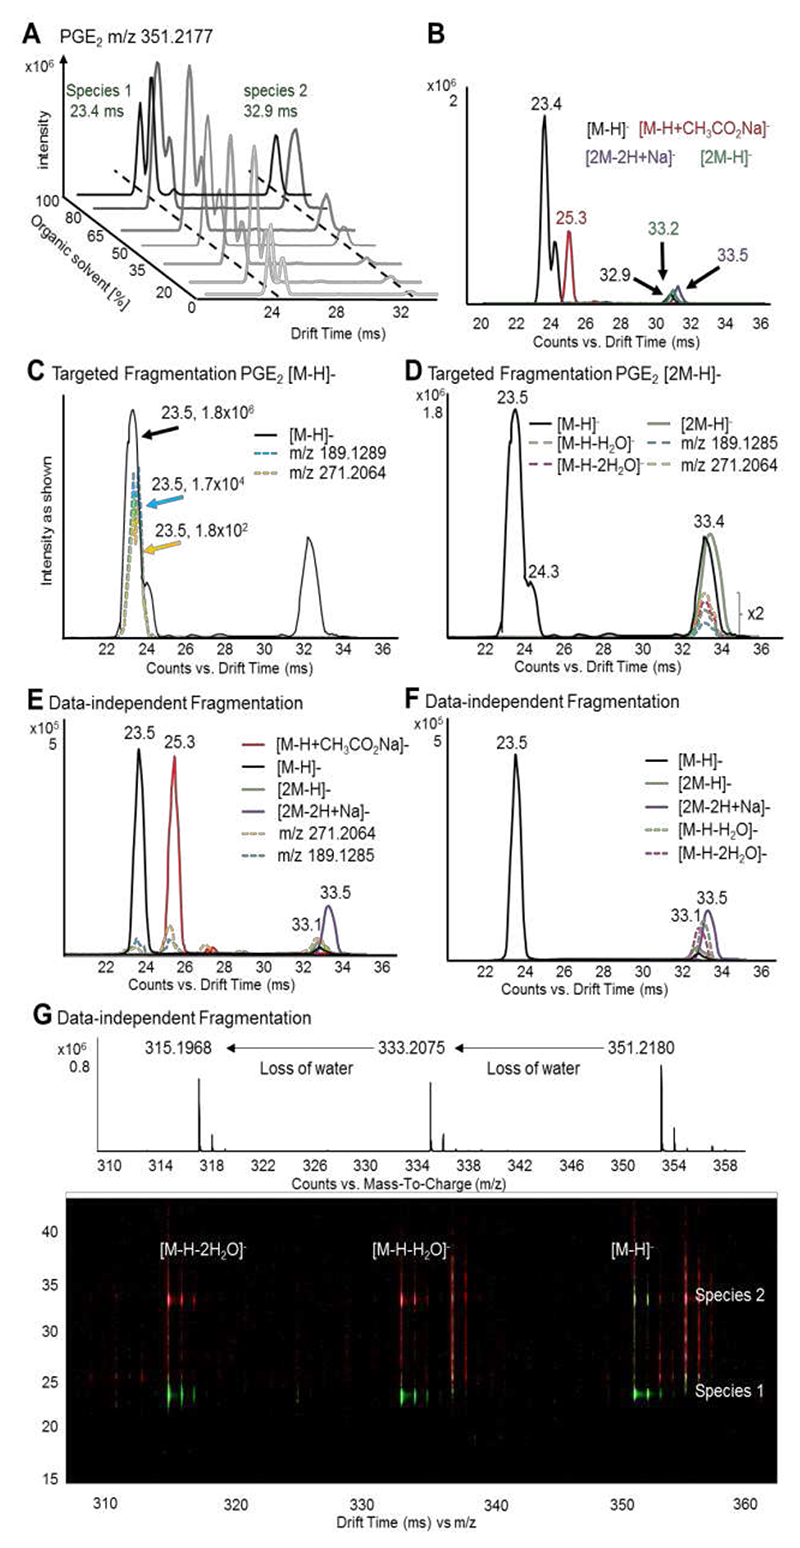
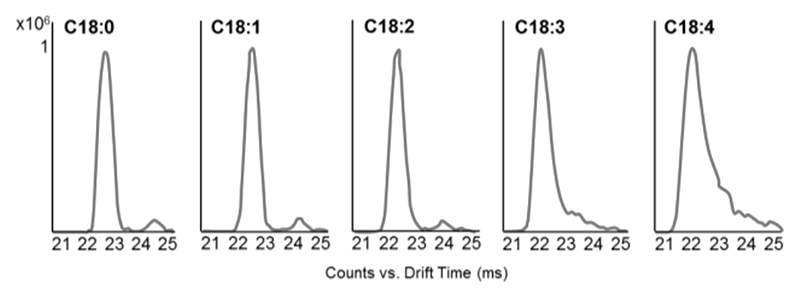
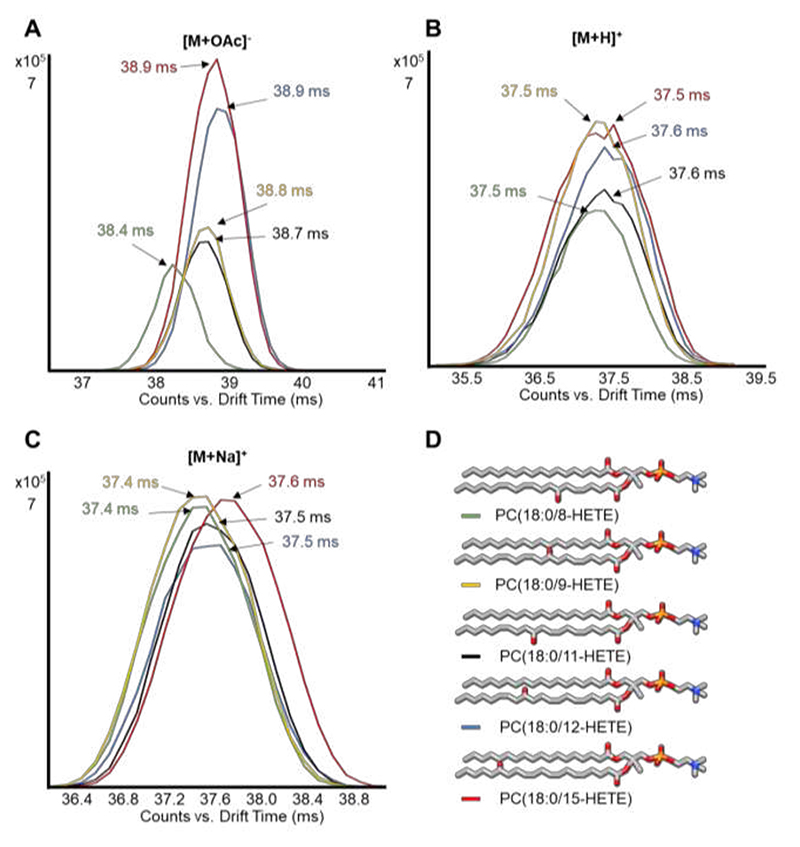
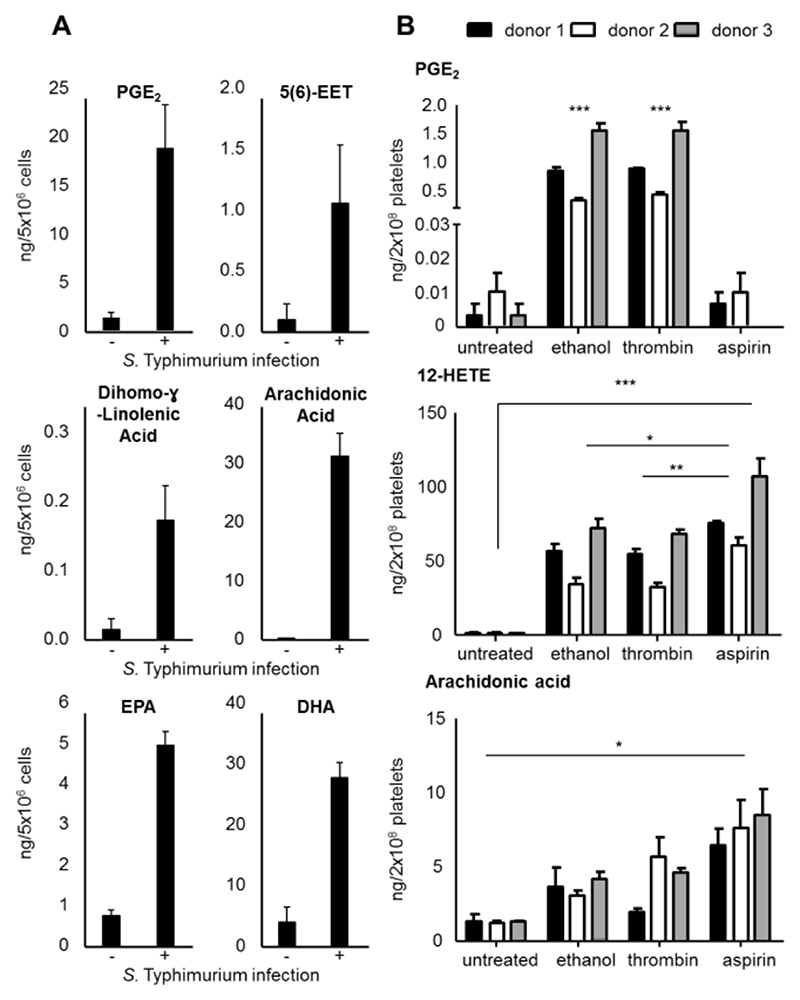
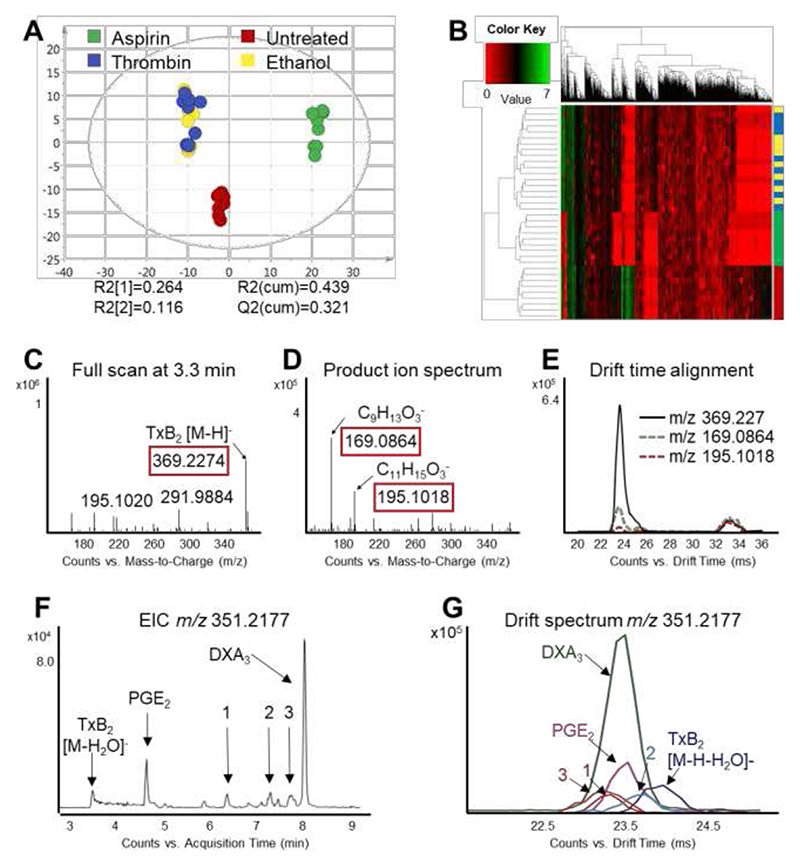
Analysis of oxylipins by liquid chromatography mass spectrometry (LC/MS) is challenging because of the small mass range occupied by this diverse lipid class, the presence of numerous structural isomers, and their low abundance in biological samples. Although highly sensitive LC/MS/MS methods are commonly used, further separation is achievable by using drift tube ion mobility coupled with high-resolution mass spectrometry (DTIM-MS). Herein, we present a combined analytical and computational method for the identification of oxylipins and fatty acids. We use a reversed-phase LC/DTIM-MS workflow able to profile and quantify (based on chromatographic peak area) the oxylipin and fatty acid content of biological samples while simultaneously acquiring full scan and product ion spectra. The information regarding accurate mass, collision-cross-section values in nitrogen (DTCCSN2), and retention times of the species found are compared to an internal library of lipid standards as well as the LIPID MAPS Structure Database by using specifically developed processing tools. Features detected within the DTCCSN2 and m/ z ranges of the analyzed standards are flagged as oxylipin-like species, which can be further characterized using drift-time alignment of product and precursor ions distinctive of DTIM-MS. This not only helps identification by reducing the number of annotations from LIPID MAPS but also guides discovery studies of potentially novel species. Testing the methodology on Salmonella enterica serovar Typhimurium-infected murine bone-marrow-derived macrophages and thrombin activated human platelets yields results in agreement with literature. This workflow has also annotated features as potentially novel oxylipins, confirming its ability in providing further insights into lipid analysis of biological samples.


Figures

Figure 1
Figure 1. DTIM allows separation of adducts and alignment of pre-cursor and product ions following fragmentation.
(A) PGE2 standard was analyzed by flow injection DTIM-MS using varying concentrations of acetonitrile:methanol. The intensity of the two most abundant [M-H]- conformer is plotted versus the DT and the concentration of organic solvent (average DTs in green). (B) Drift spectra for the conformers [M-H]- (black), [M-H+CH3CO2Na]- (red), [2M-H]- (green) and [2M-2H+Na]- (purple). (C) Targeted DTIM-MS/MS analysis of the [M-H]- species (black) enables drift-time alignment with the diagnostic product ions m/z 271.2064 (yellow) and m/z 189.1285 (light blue). (D) Similarly, fragmentation of [2M-H]- (green) results in product ions m/z 271.2064, m/z 189.1285, as well as water loss products [M-H-H2O]- (dashed green) and [M-H-2H2O]- (dashed pink) co-drifting with their precursor at 33.4 ms. Product ion peaks are magnified by factor 2. Data-independent acquisition (DIA) gives similar results, with product ions m/z 271.2064 and m/z 189.1285 as well as species [M-H-H2O]- and [M-H-2H2O]- time-aligning to their precursor ions [M-H]-, [2M-H]-, [M-H+CH3CO2Na]- (red), and [2M-2H+Na]- (purple). (E, F). The driftogram obtained from DIA (G) highlights how water-loss products deriving from both species 1 at 23.4 ms and 2 at 32.9 ms can be products (red, high fragmentation) and precursors (green, low fragmentation).
Figure 2
Figure 2. Drift spectra of C18 fatty acids differing in the number of double bonds: the second peak gets included in the tail of the first (most abundant) peak with increasing number of double bonds in the acyl chain.
Figure 3
Figure 3
Separation of eicosanoid-esterified phosphatidylcholines by DTIM-MS depends on both position of the hydroxyl group and adduct type. DTIM-MS analysis in both positive and negative mode of 8-, 9-, 11-, 12-, and 15-HETE esterified PCs (structures shown in D) shows enhanced separation between these isomers for [M+OAc]- conformers (A) compared to sodium adducts (C), while [M+H]+ species (B) are not distinguishable in drift space.
Figure 4
Figure 4. Quantification of oxylipins and fatty acids in S. Typhimurium infected murine BMDMs and thrombin activated human platelets analyzed by UHPLC/DTIM-MS.
(A) Lipids included in the calibration curve were quantified in BMDMs, indicating an increase of most species following infection with S. Typhimurium. (B) PGE2, 12-HETE, and arachidonic acid were quantified in platelets. PGE2 levels increased following treatment with thrombin, while its formation was inhibited by treatment with aspirin. On the other hand, both 12-HETE and arachidonic acid levels significantly increased following both thrombin alone and thrombin and aspirin treatment. Bar plots are created utilizing mean values ± standard error of the mean, * p < 0.05, ** p < 0.005, *** p < 0.0005 (Student’s t-test (BMDMs) or one-way ANOVA followed by Bonferroni correction (platelets).
Figure 5
Figure 5. The changes in the oxylipin profile induced by thrombin treatment of human isolated platelets can be identified using MS/MS spectra and DT alignment of product and precursor ions.
(A) Score plot of the principal component analysis (first versus second PC) of lipid extracts of isolated human platelets analyzed by LC/DTIM-MS and processed with KniMet. The four treatment groups are: thrombin plus aspirin (green), thrombin (blue), thrombin plus ethanol (yellow) and untreated (red). (B) Heatmap representation and hierarchical clustering of the distance matrix between samples in the four treatments. Separation between treatment groups can be observed, with three distinct clusters (aspirin, control and ethanol/thrombin) in both PCA and heatmap. (C) Full scan at 3.3 min shows m/z 369.2274, which is putatively annotated as TxB2 and other oxylipins. (D) Product ion spectrum at 3.3 min shows the diagnostic product ions m/z 195.1018 and m/z 169.0864 for TxB2. (E) Precursor (black) and product ions (m/z 195.1018 dashed red; m/z 169.0864, dashed green) align in DT, confirming the identification of the feature as TxB2. Unknown species 1, 2, 3 present identical m/z, different RT (F) but very similar DT (G) of TxB2, hence they are flagged as “lipid-like” features during data annotation.

References

    1. Mosblech A, Feussner I, Heilmann I. Oxylipins: Structurally Diverse Metabolites from Fatty Acid Oxidation. Plant Physiol Biochem. 2009;47(6):511–517. doi: 10.1016/j.plaphy.2008.12.011. - DOI - PubMed
    1. Smith WL, Murphy RC. The Eicosanoids: Cyclooxygenase, Lipoxygenase, and Epoxygenase Pathways. Biochem Lipids, Lipoproteins Membr. 2002;(4):341–371.
    1. Manev H, Chen H, Dzitoyeva S, Manev R. Cyclooxygenases and 5-Lipoxygenase in Alzheimer’s Disease. Prog Neuropsychopharmacol Biol Psychiatry. 2011;35(2):315–319. doi: 10.1016/j.pnpbp.2010.07.032. - DOI - PMC - PubMed
    1. Greene ER, Huang S, Serhan CN, Panigrahy D. Regulation of Inflammation in Cancer by Eicosanoids. Prostaglandins Other Lipid Mediat. 2011;96(1–4):27–36. doi: 10.1016/j.prostaglandins.2011.08.004. - DOI - PMC - PubMed
    1. Theken KN, Schuck RN, Edin ML, Tran B, Ellis K, Bass A, Lih FB, Tomer KB, Poloyac SM, Wu MC, et al. Evaluation of Cytochrome P450-Derived Eicosanoids in Humans with Stable Atherosclerotic Cardiovascular Disease. Atherosclerosis. 2012;222(2):530–536. doi: 10.1016/j.atherosclerosis.2012.03.022. - DOI - PMC - PubMed

Publication types