. 2019 May 10;14(5):e0216137.
doi: 10.1371/journal.pone.0216137. eCollection 2019.

RAG2 localization and dynamics in the pre-B cell nucleus

Affiliations

RAG2 localization and dynamics in the pre-B cell nucleus

William Rodgers et al. PLoS One. .

Abstract

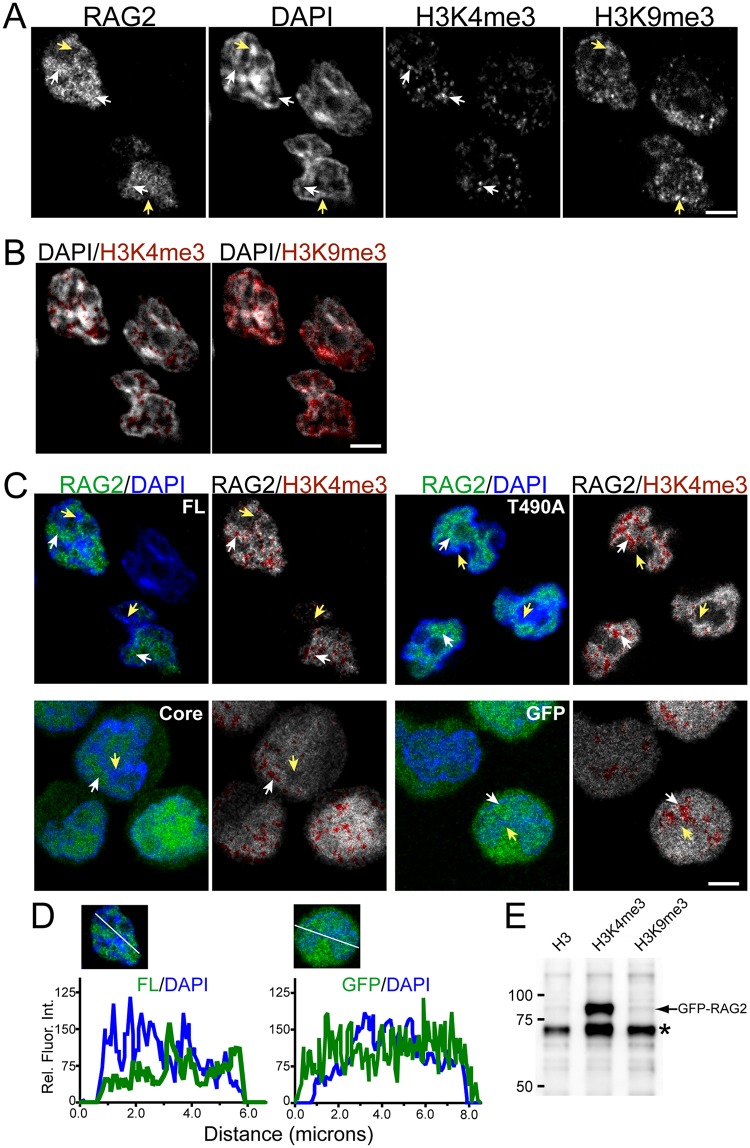
RAG2 of the V(D)J recombinase is essential for lymphocyte development. Within the RAG2 noncore region is a plant homeodomain (PHD) that interacts with the modified histone H3K4me3, and this interaction is important for relieving inhibition of the RAG recombinase for V(D)J recombination. However, the effect of the noncore region on RAG2 localization and dynamics in cell nuclei is poorly understood. Here, we used cell imaging to measure the effect of mutating the RAG2 noncore region on properties of the full length protein. We measured GFP-labeled full length RAG2 (FL), the RAG2 core region alone (Core), and a T490A mutant in the noncore region, which has unique regulatory properties. This showed that FL, T490A, and Core localized to nuclear domains that were adjacent to DAPI-rich heterochromatin, and that contained the active chromatin marker H3K4me3. Within the RAG2-enriched regions, T490A exhibited greater colocalization with H3K4me3 than either FL or Core. Furthermore, colocalization of H3K4me3 with FL and T490A, but not Core, increased in conditions that increased H3K4me3 levels. Superresolution imaging showed H3K4me3 was distributed as puncta that RAG2 abutted, and mobility measurements showed that T490A had a significantly lower rate of diffusion within the nucleus than either FL or Core proteins. Finally, mutating Trp453 of the T490A mutant (W453A,T490A), which blocks PHD-dependent interactions with H3K4me3, abolished the T490A-mediated increased colocalization with H3K4me3 and slower mobility compared to FL. Altogether, these data show that Thr490 in the noncore region modulates RAG2 localization and dynamics in the pre-B cell nucleus, such as by affecting RAG2 interactions with H3K4me3.


Conflict of interest statement

The authors have declared that no competing interests exist.

Figures

Fig 1
Fig 1. Visualization of RAG2 localization to DAPI-poor regions of the pre-B cell nucleus.
(A) Confocal images of DAPI-stained nuclei of pre-B cells expressing GFP-RAG2, and immunostained with antibodies to H3K4me3 and H3K9me3. The white arrows indicate corresponding regions of RAG2 and H3K4me3 labeling; the yellow arrows indicate regions of DAPI enrichment that also contained H3K9me3. (B) Overlay of labeled H3K4me3 (left) and H3K9me3 (right) on DAPI. The labeled histones are red, and the DAPI is grayscale. (C) Merge (left) and overlay images (right) of cells expressing FL, T490A, Core, or GFP control not fused to RAG2. The merge images were generated using the DAPI (blue) and GFP (green) channels of each image. The overlays are labeled H3K4me3 (red) on the GFP channel (grayscale). The white and yellow arrows indicate GFP- and DAPI-enriched domains, respectively. Note that FL in (C) is the same field shown in (A). The white bar in (A), (B), and (C) represents 3 μm. (D) Plots of the fluorescence intensities in the GFP (green) and DAPI (blue) channels, measured along the white line in the respective images of a cell that expressed either GFP-FL (left) or GFP alone (right). (E) Pull-down assay of GFP-FL by modified and unmodified H3 N-terminal peptides. RAG2 was detected by immunoblotting with rabbit monoclonal antibody to RAG2. Molecular weights, in thousands, are indicated on the left. The asterisk indicates a nonspecific band.
Fig 2
Fig 2. Visualization of RAG2 colocalization with H3K4me3 versus H3K9me3.
Merge images of GFP-labeled FL, T490A, Core, or control GFP, with H3K4me3 (top) and H3K9me3 (bottom). The spectrum shows the pseudocolor assignment, with green and red being GFP and labeled histone alone, respectively, and intermediate shades where the labels are correlated in regions of protein colocalization. Examples of correlated labeling are indicated by yellow arrows. The white arrows indicate heterochromatin stained with H3K9me3 and lacking labeled RAG2 in the nuclear periphery. The white bar indicates 3.0 μm.
Fig 3
Fig 3. The T490A mutation increases RAG2 colocalization with H3K4me3.
Pearson correlation values (ρ) for GFP-labeled RAG2 proteins and either H3K4me3 (A) or H3K9me3 (B). Pre-B cells expressing the indicated GFP-RAG2 were co-stained with separate antibodies to H3K4me3 and H3K9me3. Secondary antibodies labeled with either Alexa 647 or Cy3 were used to detect the H3K4me3 and H3K9me3 labeling, respectively. The columns labeled H3K4me3 are a positive control consisting of cells labeled with rabbit antibody to H3K4me3 and co-stained with Alexa488- and Cy3-labeled antibodies to the primary antibody. Each symbol represents measurement of an individual nucleus. Indicated are the mean (blue lines) and SEM (error bars), calculated from the mean of three or more trials, each trial consisting of measurement of at least 30 cells. The red lines indicate significance tests between corresponding double-labeled samples, comparing cells with PDA treatment to control cells without PDA.
Fig 4
Fig 4. Visualization of GFP-RAG2 proteins in PDA-treated pre-B cells.
(A) Immunoblot measuring H3K4me3 and H3K9me3 from lysates of pre-B cells that were untreated, or grown for 18 h in 10.0 mM PDA. (B) The relative fluorescence intensity (Rel. Fluor. Int.) of labeled H3K4me3 measured in confocal images of untreated and PDA-treated pre-B cells. (C) Merge (left) and overlay (right) images of PDA-treated pre-B cells expressing the indicated GFP-RAG2 or control GFP alone. The merge images were generated using the DAPI (blue) and GFP (green) channels of the sample; the overlay is H3K4me3 label (red) on the GFP channel (grayscale). The white and yellow arrows indicate GFP- and DAPI-enriched domains, respectively. The white bar represents 3 μm.
Fig 5
Fig 5. Colocalization of RAG2 with H3K4me3 visualized by superresolution microscopy.
(A) Merge of SIM images from H3K4me3-stained pre-B cell nuclei that expressed either GFP-FL (left) or -T490A (right). The arrowheads indicate examples of H3K4me3 puncta that contain adjoining GFP-labeled RAG2. In (B) are the regions indicated by boxes in (A). The paired images in each row are identical, with the image on right showing the line used to measure the fluorescence intensities in each channel and plotted in the accompanying graphs (right). (C) Correlation values for the GFP-RAG2s and H3K4me3, measured in SIM images of double-labeled pre-B cell nuclei. (D) Histograms showing the fraction of pixels in H3K4me3-labeled puncta that contain GFP-FL (top) or -T490A (bottom). Individual puncta were outlined in the H3K4me3 channel, and the fraction of pixels that also contain GFP label were scored. (E) Merge SIM image of pre-B cell nuclei that expressed GFP-RAG2 (green), and co-stained with DAPI (blue) and antibody to H3K4me3 (red). Indicated is a DAPI-enriched region of the nucleus, and adjacent are zoomed regions of the box showing an overlay of GFP (green) and H3K4me3 (red) labeling on DAPI (grayscale). The white bars represent 1.0 μm.
Fig 6
Fig 6. The T490A mutation reduces RAG2 rate of diffusion in the nucleus.
(A) A representative FRAP measurement of GFP-FL in a pre-B cell. The circles indicate the region of photobleach in the pre-bleach image (red circle) and post-bleach images (white circles). The white bar indicates 3.0 μm. (B) Recovery curves for GFP-FL (red) and -T490A (blue) from FRAP of labeled pre-B cell nuclei. Images were collected every 0.1 s following photobleaching. The inset is a recovery curve where the time interval was increased from 0.1 s to 0.5 s, and the measurement extended to 15.0 s. (C) Recovery curves for GFP-FL (red) and -Core (black) determined from FRAP of labeled pre-B cell nuclei. In (B) and (C), the error bars represent SEM, calculated from the averaged data of each time point from five separate trials. Images were collected every 0.1 s following photobleaching. (D and E) Averaged rate constants (± SEM) for recovery of fluorescence determined by fitting fluorescence intensity values to a one-component exponential recovery curve. All data are from RAG2-/- pre-B cells that expressed the indicated GFP-RAG2 fusion protein.
Fig 7
Fig 7. W453A blocks T490A-dependent changes in RAG2 colocalization with H3K4me3 and intranuclear mobility.
(A) Colocalization of W453A,T490A and T490A with H3K4me3 quantified in populations of double-labeled cells. The correlation coefficient was measured as described for Fig 3, with each symbol representing ρ determined for an individual cell (B) FRAP analysis of GFP-labeled W453,T490A and T490A. The error bars represent SD and SEM in (A) and (B), respectively.
Fig 8
Fig 8. Model for Thr490-dependent regulation of RAG2 interactions with H3K4me3.
RAG2 alternates between weak and strong interactions with H3K4me3 via a PHD in its noncore region (indicated), and mediated by allosteric changes in the noncore region localized at residue 490. In wild-type protein, allosteric changes may occur through post-translational modifications of Thr490, which are mimicked by the T490A mutation.

References

    1. Teng G, Schatz DG. Regulation and Evolution of the RAG Recombinase. Adv Immunol. 2015;128:1–39. 10.1016/bs.ai.2015.07.002 - DOI - PubMed
    1. Rodgers KK. Riches in RAGs: Revealing the V(D)J Recombinase through High-Resolution Structures. Trends Biochem Sci. 2017;42(1):72–84. 10.1016/j.tibs.2016.10.003 - DOI - PMC - PubMed
    1. Lewis SM, Agard E, Suh S, Czyzyk L. Cryptic signals and the fidelity of V(D)J joining. Mol Cell Biol. 1997;17(6):3125–36. - PMC - PubMed
    1. Alt FW, Zhang Y, Meng FL, Guo C, Schwer B. Mechanisms of programmed DNA lesions and genomic instability in the immune system. Cell. 2013;152(3):417–29. 10.1016/j.cell.2013.01.007 - DOI - PMC - PubMed
    1. Lieber MR. Mechanisms of human lymphoid chromosomal translocations. Nat Rev Cancer. 2016;16(6):387–98. 10.1038/nrc.2016.40 - DOI - PMC - PubMed

Publication types