. 2019 Jun 19;102(6):1143-1156.e4.
doi: 10.1016/j.neuron.2019.04.008. Epub 2019 May 7.

Positional Strategies for Connection Specificity and Synaptic Organization in Spinal Sensory-Motor Circuits

Affiliations

Positional Strategies for Connection Specificity and Synaptic Organization in Spinal Sensory-Motor Circuits

Nikolaos Balaskas et al. Neuron. .

Abstract

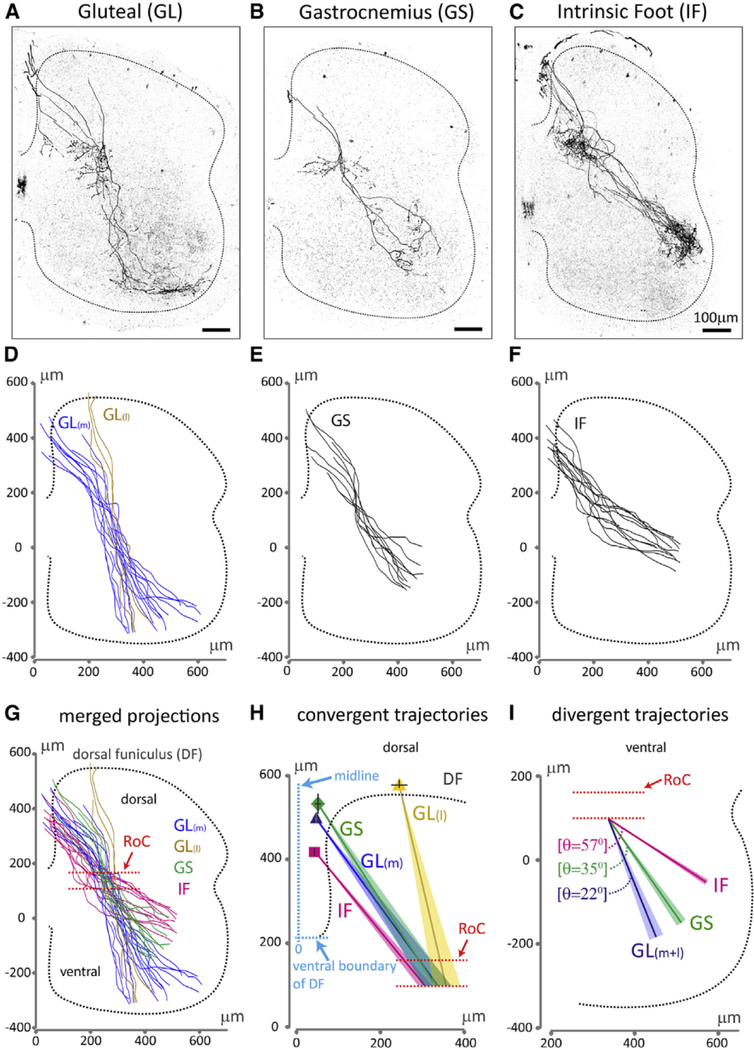
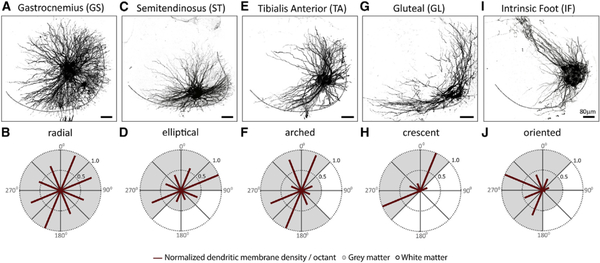
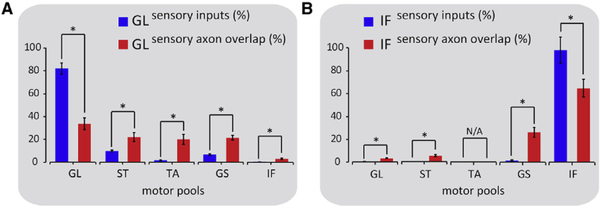
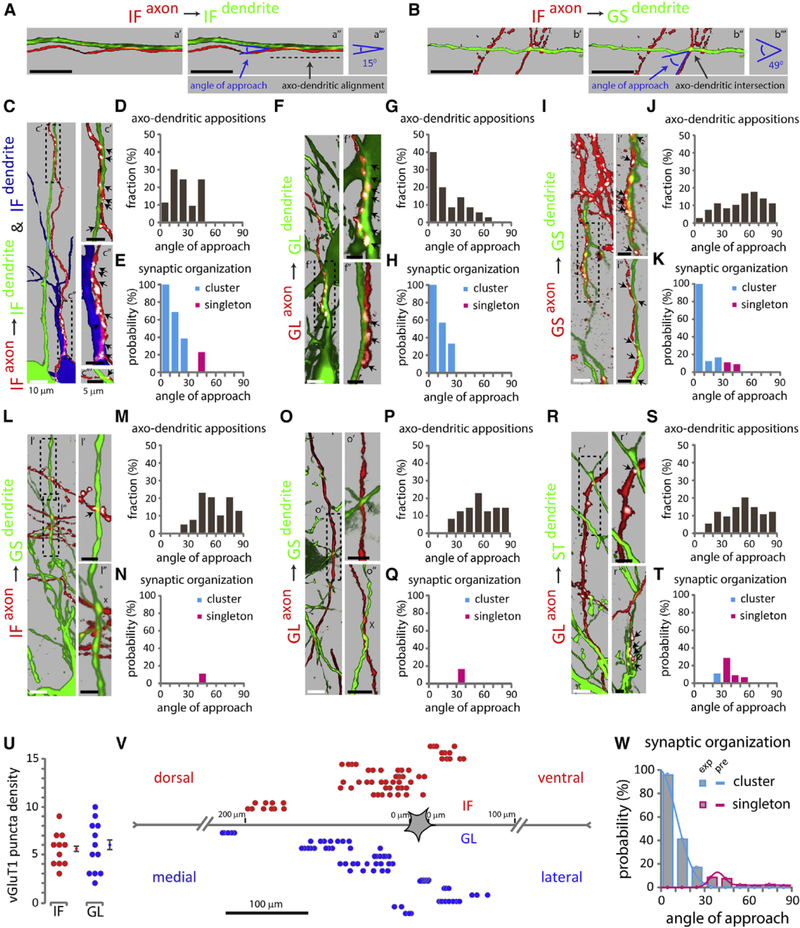
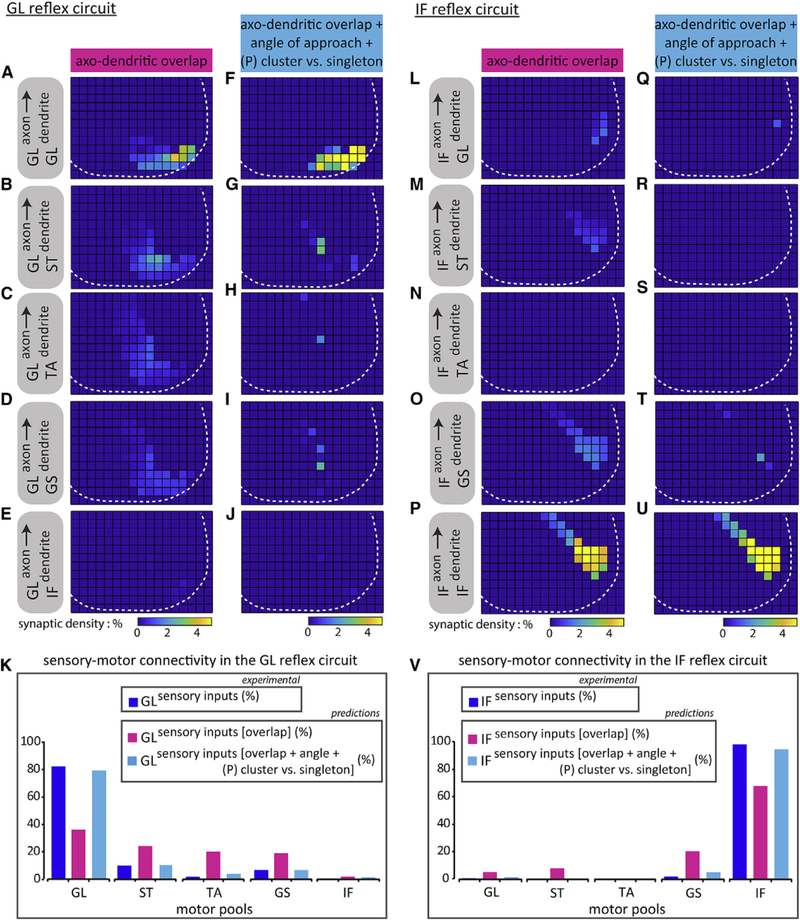
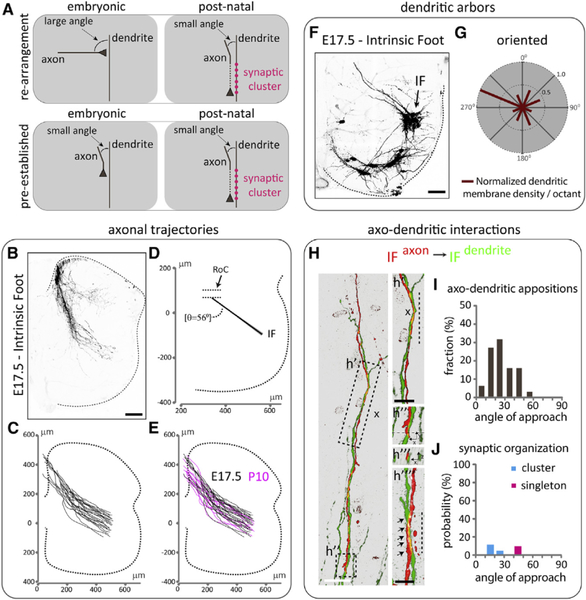
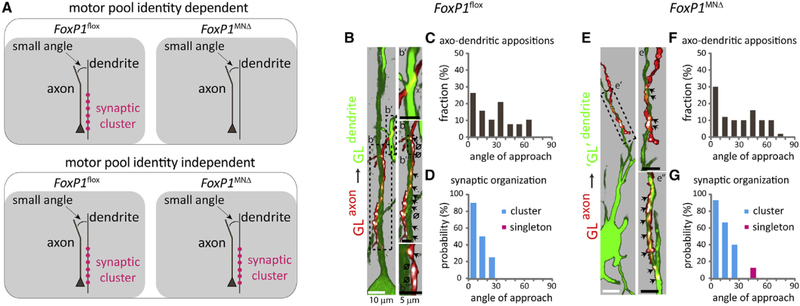
Proprioceptive sensory axons in the spinal cord form selective connections with motor neuron partners, but the strategies that confer such selectivity remain uncertain. We show that muscle-specific sensory axons project to motor neurons along topographically organized angular trajectories and that motor pools exhibit diverse dendritic arbors. On the basis of spatial constraints on axo-dendritic interactions, we propose positional strategies that can account for sensory-motor connectivity and synaptic organization. These strategies rely on two patterning principles. First, the degree of axo-dendritic overlap reduces the number of potential post-synaptic partners. Second, a close correlation between the small angle of axo-dendritic approach and the formation of synaptic clusters imposes specificity of connections when sensory axons intersect multiple motor pools with overlapping dendritic arbors. Our study identifies positional strategies with prominent roles in the organization of spinal sensory-motor circuits.

Keywords: axonal trajectory; dendrites; motor control; motor neurons; positional factors; proprioceptors; sensory-motor connectivity; spinal cord; synaptic organization.


Figures

Figure 1.
Figure 1.. Spinal Axonal Trajectories of Muscle-Specific Proprioceptors in Wild-Type Mice
(A-C) Representative spinal axonal projections from proprioceptive sensory neurons innervating distinct hindlimb muscles. (D-F) Reconstruction of (D) GL(m), GL(l), (E) GS, and (F) IF sensory axon trajectories. (G) Overlay of axonal trajectories. (H) Average sensory axon emergence points from the DF and axon trajectories from the DF to the region of convergence (RoC, red dotted lines). Emergence points (ML axis from the midline of the spinal cord, and DV axis of the DF): square, IF, (47 ± 2 μm, 218 ± 10 μm); dark-blue triangle, GL(m), (52 ± 3 μm, 299 ± 13 μm); diamond, GS, (56 ± 8 μm, 327 ± 24 μm); yellow triangle, GL(l), (254 ±19 μm, 388 ±10 μm). (I) Sensory axon trajectory angles from the RoC to the ventral spinal cord relative to the ML axis (GL(m+l): 22° ± 2°, GS: 35° ± 2°, IF: 57° ± 1°). Dotted line depicts gray matter boundary. SEM of trajectories in (H) and (I) is shown as shaded colors. See Table S2 for experimental sample sizes.
Figure 2.
Figure 2.. Dendritic Arborization Patterns of Distinct Motor Pools in Wild-Type Mice
Representative dendritic arbors of motor neurons (A, C, E, G, and I) innervating distinct hindlimb muscles. Radial plot quantification of normalized dendritic membrane density per octant (red bars) from the centroid of motor neurons of (B) GS, (D) ST, (F) TA, (H) GL, and (J) IF pools. Gray and white matter are depicted by shading in the plots. Black dotted line in (A), (C), (E), (G), and (I) depicts gray matter boundary. See Table S2 for experimental sample sizes.
Figure 3.
Figure 3.. Axo-dendritic Overlap and Synapse Distribution in the GL and IF Reflex Circuits
Histograms quantifying sensory input (CT-B+ + vGluT1+, blue bars) distribution and axo-dendritic overlap (tdTomato+ axons and GFP+ dendrites, red bars) between GL sensory axons and homonymous and non-homonymous motor neurons (A) and between IF sensory axons and homonymous and non- homonymous motor neurons (B). (A: axo-dendritic overlap (%): GLon GL: 33.5 ± 5, GLon ST: 22 ± 4, GL on TA: 20 ± 4.5, GL on GS: 21.5 ± 2, GL on IF: 3 ± 0.5; B: axo-dendritic overlap (%): IF on GL: 3.5 ± 0.3, IF on ST: 5.5 ± 0.8, IF on TA: N/A, IF on GS: 26 × 4.5, IF on IF: 65 ± 8). Asterisks represent p values < 0.05. N/A, not applicable. Error bars represent SEM. See Table S2 for experimental sample sizes.
Figure 4.
Figure 4.. The Angle of Axo-dendritic Approach and Synaptic Organization in Defined Reflex Circuits
Distribution of cluster and singleton synapses as a function of the angle of axo-dendritic approach. (A and B) Single confocal optical sections between IF axon on IF dendrite (a′), and IF axon on GS dendrite (b′). Green, motor neuron dendrite; red, sensory axon. Blue arrows point to angle of approach between IF axon on IF dendrite (a″), and IF axon on GS dendrite (b″). Dark gray arrows point to axo-dendritic alignment (shown with a dashed line) in (a″), and axo-dendritic intersection in (b″). (a″′ and b″′) indicate measured angle of approach between IF axon on IF dendrite (a″′), and IF axon on GS dendrite (b″′). (C, F, I, L, O, and R) Maximum projection images of pseudo-color reconstructions of confocal optical sections. Green or blue, motor neuron; red, sensory axons; white, vGluT1+ puncta on sensory axons. Arrows indicate sensory axon + vGluT1+ + motor neuron appositions, x indicates absence of synapses from identified axo-dendritic appositions. 0 indicates lack of contact between sensory axon + vGlut1+ punctum and GFP+ dendrite, upon image rotation. (C) IF sensory axon on IF motor neuron dendrites; (c′ and c″) synaptic clusters; (c″′) singleton; (c″′) from a different section. (F) GL axon on GL dendrites; (f and f″) synaptic clusters; (f″) from a different section. (I) GS axon on GS dendrites; (¡′ and i″) synaptic clusters; (i″) from a different section. (L) IF axon on GS dendrites; (I′) singleton; (I″) no synaptic contact. (O) GL axon on GS dendrites; (o′ and o″) no synaptic contacts; (o″) from a different section. (R) GL axon on ST dendrites; (r′) singleton; (r″) cluster and lack of contact between sensory axon + vGlut1+ punctum and GFP+ dendrite; (r”) from a different section. (D, G, J, M, P, and S) Histograms indicate the fraction (y axis) of angle (degrees) of approach (x axis) for different axo-dendritic appositions. IF axon on IF dendrite (D), GL axon on GL dendrite (G), GS axon on GS dendrite (J), IF axon on GS dendrite (M), GL axon on GS dendrite (P), and GL axon on ST dendrite (S). (E, H, K, N, Q, and T) Histograms indicate the probability (y axis) of vGluT 1+ cluster (cyan) or singleton (magenta) as a function of the angle (degrees) of approach (x axis). IF axon on IF dendrite (E), GL axon on GL dendrite (H), GS axon on GS dendrite (K), IF axon on GS dendrite (N), GL axon on GS dendrite (Q), and GL axon on ST dendrite (T). (U) Scatterplot of synaptic cluster size estimated from the number of consecutive vGluT1+ puncta within a pseudo-color reconstructed sensory axon opposed to a homonymous motor neuron. Error bars represent SEM. (V) Spatial distribution of homonymous clusters, denoted by individual rows. Each circle represents a sensory axon + vGluT1+ + motor neuron apposition. Red circles, homonymous IF inputs; blue circles, homonymous GL inputs. (W) Histograms (experimental data) and curves (predictions) depict the probability of cluster versus singleton synapse formation as a function of the angle (degrees) of axo-dendritic approach. Values represent a pooled distribution of GL sensory with GL, ST, TA, GS, and IF motor neurons, GS sensory with GS motor neurons, and IF sensory with GL, ST, GS, and IF motor neurons (see also Table S1). Black dotted boxes in (C), (F), (I), (L), (O), and (R) depict angle of approach and synaptic organization fordistinct axo dendritic appositions. Black scale bar in (A) and (B), 10 n.m. See Table S2 for experimental sample sizes.
Figure 5.
Figure 5.. Positional Factors Can Account for S-M Connectivity Patterns in the GL and IF Reflex Circuits
(A-E and L-P) Predicted patterns of connectivity based on axo-dendritic overlap between GL sensory axons on (A) GL, (B) ST, (C) TA, (D) GS, and (E) IF motor neurons, and IF sensory axons on (L) GL, (M) ST, (N) TA, (O) GS, and (P) IF motor neurons. (F-J and Q-U) Same as (AHE) and (LHP), respectively, except with the addition of angular preference factors. GL sensory axons on (F) GL, (G) ST, (H) TA, (I) GS, and (J) IF motor neurons, and IF sensory axons on (Q) GL, (R) ST, (S) TA, (T) GS, and (U) IF motor neurons. White dotted line depicts gray matter boundary. Histograms summarizing (K) GL, or(V) IF sensory connectivity patterns across distinct motor pools. Sensory inputs histograms (blue) were derived from CT-B+ + vGluT1+ experimental data, as previously shown in Figure 3. Sensory inputs [overlap] histograms (magenta) are synaptic distributions (%) predicted using binned axo-dendritic membrane overlap data (K: GL on GL: 36, GL on ST: 24, GL on TA: 20, GL on GS: 18.5, GL on IF: 1.5; V: IF on GL: 5, IF on ST: 7.5, IF on TA: N/A, IF on GS: 20, IF on IF: 67.5). Sensory inputs [overlap + angle + (P) cluster versus singleton] histograms (cyan) are synaptic distributions (%) predicted incorporating binned axo-dendritic membrane overlap data and angular preference factors (K: GL on GL: 79, GL on ST: 10, GL on TA: 3.5, GL on GS: 6.5, GL on IF: 1; V: IF on GL: 1, IF on ST: 0, IF on TA: N/A, IF on GS: 4.5, IF on IF: 94.5). N/A, not applicable. See Table S2 for experimental sample sizes.
Figure 6.
Figure 6.. Axo-dendritic Morphologies and Interactions in the IF Reflex Circuit at Embryonic Stages of Wild-Type Mice
(A) Schematics depicting different models of axodendritic configuration between IF sensory axons and IF motor neuron dendrites at embryonic and post-natal stages. Top: re-arrangement of axodendritic interactions results in angular reduction and synaptic cluster formation (magenta circles). Bottom: pre-established angular axo-dendritic interactions at embryonic and post-natal stages result in synaptic cluster formation (magenta circles). (B) Representative spinal axonal projections from wild-type sensory neurons innervating intrinsic foot (IF) muscles labeled at E17.5 using a retrograde embryonic L5-L6 dorsal root fill. Black scale bar: 100μm. (C) Reconstruction of IF sensory axons at E17.5. (D) Average trajectory angle (56 ± 1°) of IF sensory axons from RoC toward the ventral spinal cord at E17.5. SEM of trajectory shown as shaded color. (E) Overlay of reconstructed sensory axons. E17.5 spinal cords were scaled to the dimensions of a normalized P10 spinal cord (Figure 1F) for comparative analyses. (F) Representative IF motor neuron dendritic arborization patterns labeled at E17.5 using a retrograde embryonic L5-L6 ventral root fill (note that some non-IF motor neurons, located in the ventral spinal cord, are also labeled). The dotted line represents the spinal cord boundary. Black arrow indicates IF motor neurons. Black scale bar: 80 μm. (G) Radial plot quantification of normalized dendritic membrane density per octant (red bars) from the centroid of motor neurons of E17.5 IF pool. (H) Maximum projection images of pseudo-color reconstructions of confocal optical sections. Green, IF motor neuron dendrites; red, IF sensory axon; white, vGluT1+ punctum on IF sensory axon. Arrows indicate sensory axon + vGluT1+ + motor neuron appositions. Vertical dotted line denotes axo-dendritic alignment. Black x indicates absence of synapses from identified axo-dendritic appositions, (h′), enlarged region showing axo-dendritic alignment and absence of vGluT 1+ puncta. (h″), region with presumptive IF sensory axon filopodium. (h″′) optical cross-section of Z stack encompassing presumptive filopodium denoted with a thin dotted line in (h″). (h″″) position of vGluT1+ synaptic cluster (image from a different section). White scale bar: 10 μm; black scale bar: 5 μm. (I) Histogram indicating the fraction (y axis) of angle (degrees) of approach (x axis) for different axo-dendritic appositions. (J) Histogram indicating the probability (y axis) of vGluTI+ cluster (cyan) or singleton (magenta) as a function of the angle (degrees) of approach (x axis). See Table S2 for experimental sample sizes.
Figure 7.
Figure 7.. The Angle of Axo-dendritic Approach and Synapse Organization between GL sensory axons and ‘GL’ Motor Neuron Dendrites in FoxP1MNΔ Mutants
(A) Schematics depicting different models of axo-dendritic interactions at a small angle, and synaptic clusters between GL sensory axons and GL motor neuron dendrites at early post-natal stages in FoxP1flox [PV::FlpO+/−;Ai65+/−] controls and FoxP1MNΔ [PV::FlpO+/−;Ai65+/−] mutants. Top: the correlation between small approach angles and synaptic cluster formation (magenta circles) is dependent on motor pool identity. Bottom: the correlation between small approach angles and synaptic cluster formation (magenta circles) is independent of motor pool identity. (B and E) Maximum projection images of pseudo-color reconstructions of confocal optical sections. Green, motor neurons; red, sensory axons; white, vGluT1 + puncta on sensory axons. Arrows indicate sensory axon + vGluT1+ + motor neuron appositions, x indicates absence of synapses from identified axo-dendritic appositions. 0 indicates lack of contact between sensory axon + vGlut1+ punctum and GFP+ dendrite, upon image rotation. (B) Control mice; GL sensory axon on GL motor neuron dendrites; (b′) axo-dendritic apposition and absence of synapse formation; (b″) synaptic cluster, and lack of contacts between sensory axons + vGlut1+ punctum and GFP+ dendrite; (b″′) example of close appositions but lack of contacts between sensory axon + vGlut1+ punctum and GFP+ dendrite. (E) Mutant mice; GL sensory axon on ‘GL’ motor neuron dendrites; (e′ and e″) synaptic clusters; (e″) from a different section. Black dotted boxes in (B) and (E) depict angle of approach and synaptic organization for distinct axo-dendritic appositions. (C and F) Histograms indicate the fraction (y axis) of angle (degrees) of approach (x axis) for different axo-dendritic appositions. (D and G) Histograms indicate the probability (y axis) of vGlut1+ cluster (cyan) or singleton (magenta) as a function of the angle (degrees) of axo-dendritic approach (x axis). See Table S2 for experimental sample sizes.

Comment in

References

    1. Arber S. (2012). Motor circuits in action: specification, connectivity, and function. Neuron 74, 975–989. - PubMed
    1. Baek M, Pivetta C, Liu JP, Arber S, and Dasen JS (2017). Columnar-intrinsic cues shape premotor input specificity in locomotor circuits. Cell Rep. 21, 867–877. - PMC - PubMed
    1. Baldissera F, Hultborn H, and lllert M. (1981). Integration in spinal neuronal systems In Handbook of Physiology, The Nervous System, V.B. Brooks, ed., pp.509–595.
    1. Bikoff JB, Gabitto MI, Rivard AF, Drobac E, Machado TA, Miri A, Brenner-Morton S, Famojure E, Diaz C, Alvarez FJ, et al. (2016). Spinal Inhibitory Interneuron Diversity Delineates Variant Motor Microcircuits. Cell 165, 207–219. - PMC - PubMed
    1. Brierley DJ, Rathore K, VijayRaghavan K, and Williams DW (2012). Developmental origins and architecture of Drosophila leg motoneurons. J. Comp. Neurol. 520, 1629–1649. - PubMed

Publication types