. 2019 Jun 12;146(11):dev170373.
doi: 10.1242/dev.170373.

APETALA2 control of barley internode elongation

Affiliations

APETALA2 control of barley internode elongation

Vrushali Patil et al. Development. .

Abstract

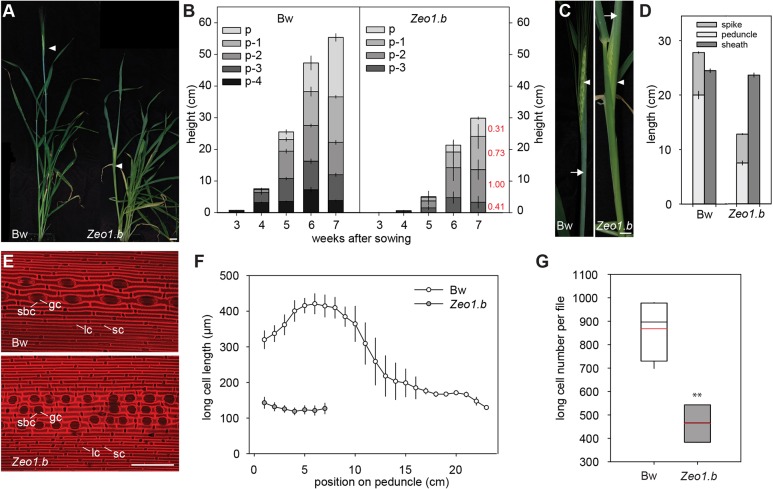
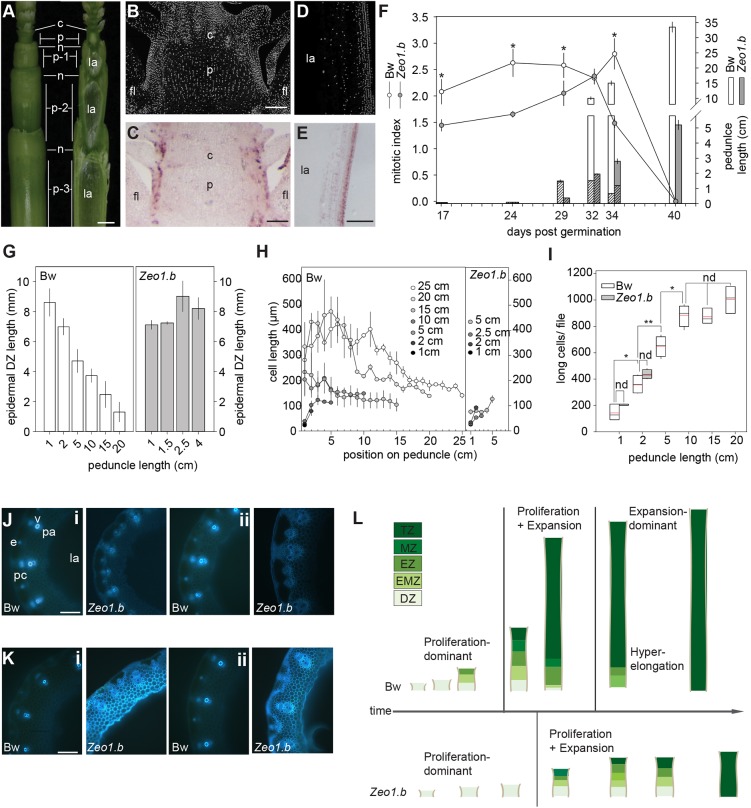
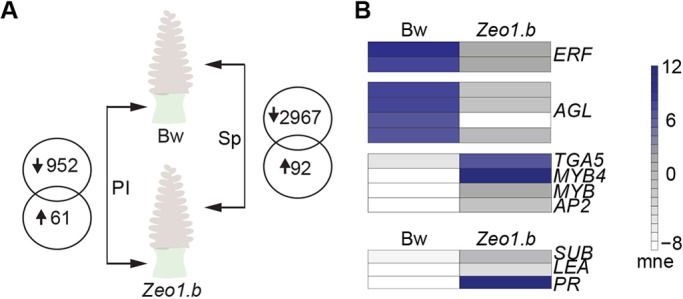
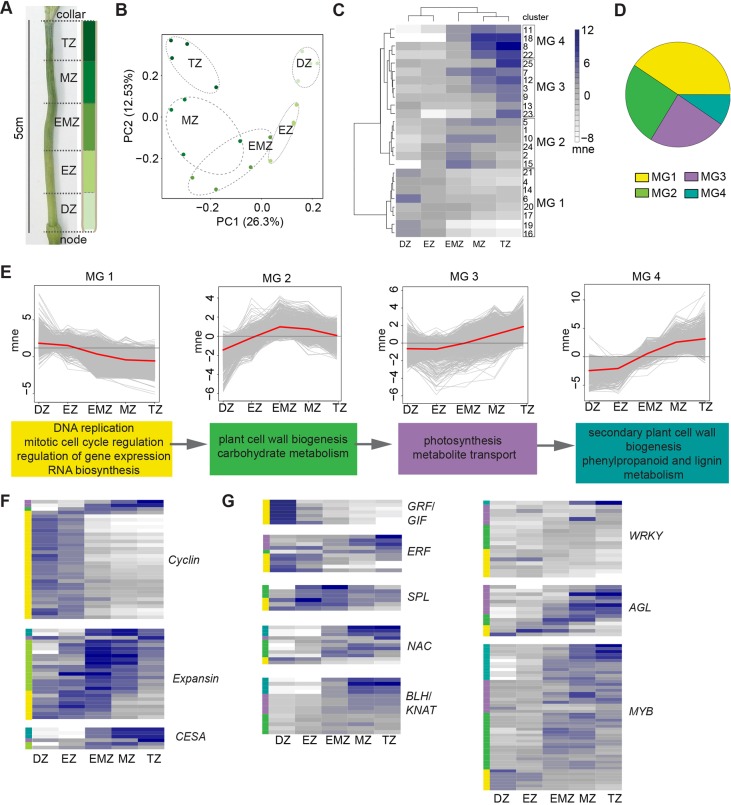
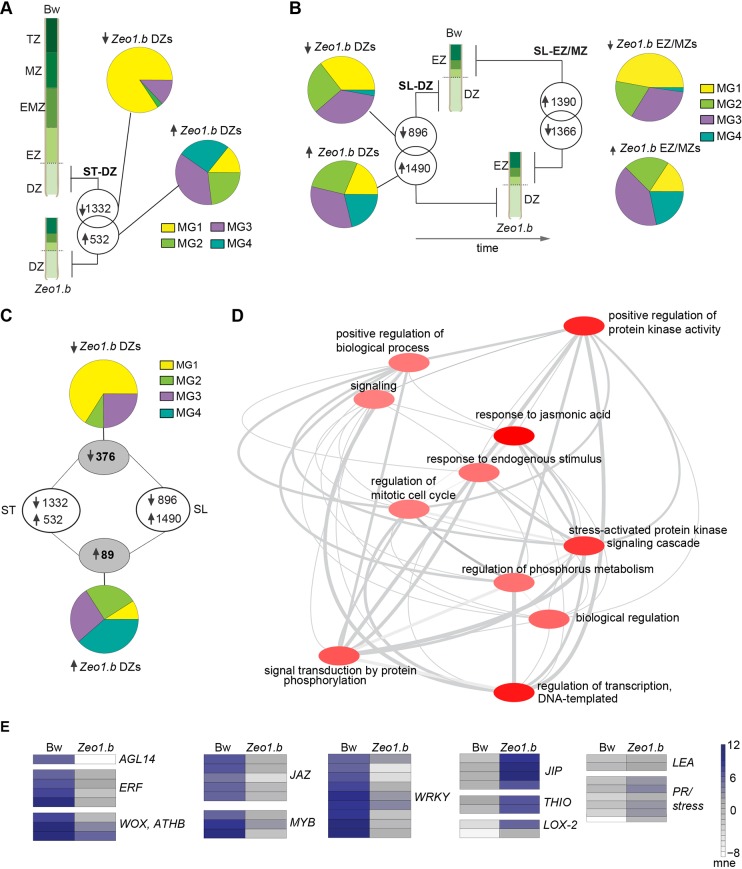
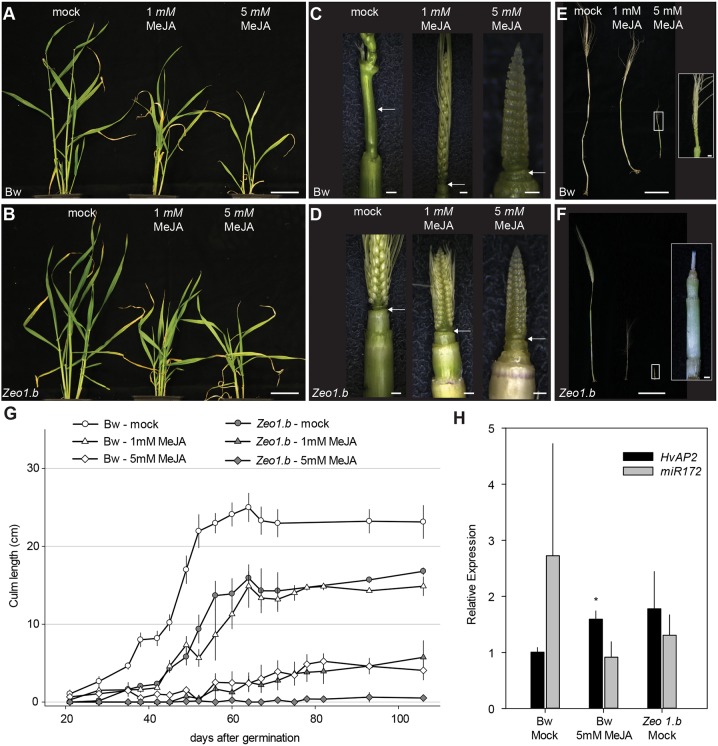
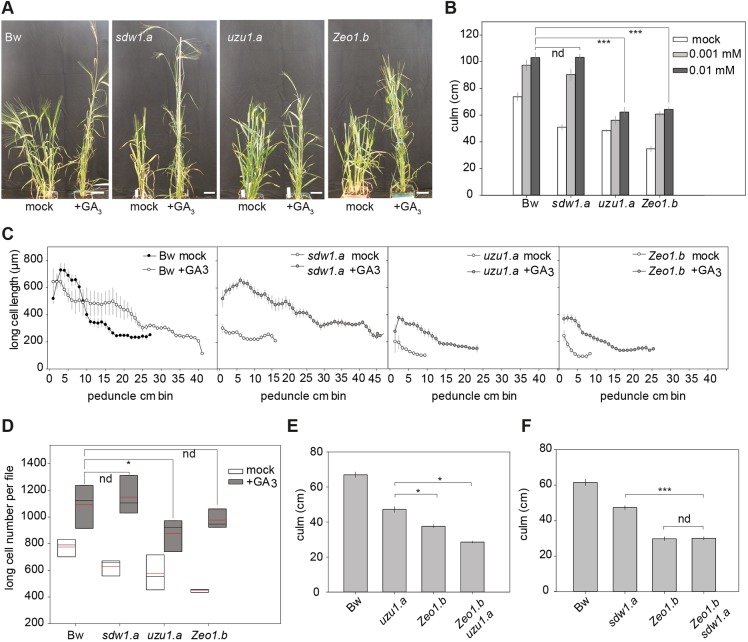
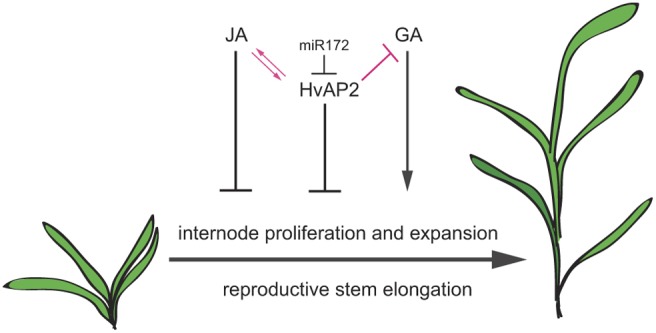
Many plants dramatically elongate their stems during flowering, yet how this response is coordinated with the reproductive phase is unclear. We demonstrate that microRNA (miRNA) control of APETALA2 (AP2) is required for rapid, complete elongation of stem internodes in barley, especially of the final 'peduncle' internode directly underneath the inflorescence. Disrupted miR172 targeting of AP2 in the Zeo1.b barley mutant caused lower mitotic activity, delayed growth dynamics and premature lignification in the peduncle leading to fewer and shorter cells. Stage- and tissue-specific comparative transcriptomics between Zeo1.b and its parent cultivar showed reduced expression of proliferation-associated genes, ectopic expression of maturation-related genes and persistent, elevated expression of genes associated with jasmonate and stress responses. We further show that applying methyl jasmonate (MeJA) phenocopied the stem elongation of Zeo1.b, and that Zeo1.b itself was hypersensitive to inhibition by MeJA but less responsive to promotion by gibberellin. Taken together, we propose that miR172-mediated restriction of AP2 may modulate the jasmonate pathway to facilitate gibberellin-promoted stem growth during flowering.

Keywords: APETALA2; Cereal development; Intercalary meristem; Jasmonate; Phase change; Stem elongation.


Conflict of interest statement

Competing interestsThe authors declare no competing or financial interests.

Figures

Fig. 1.
Fig. 1.
Internode growth and anatomy. (A) Glasshouse-grown Bowman (left) and Zeo1.b (right) plants at heading. Arrowheads indicate the spike. (B) Internode elongation in Bowman and Zeo1.b. Internode labels show position relative to peduncle (p) (n=16/genotype). Numbers in red show proportion of each Zeo1.b internode's length compared with Bowman at 7 weeks. (C) Emerged Bowman spike (left) and enclosed Zeo1.b spike (right). Arrowheads point to spike, arrows to flag leaf sheath. (D) Bowman and Zeo1.b peduncle, flag leaf sheath and spike lengths (n=17 Bowman; n=15 Zeo1.b). (E) Propidium iodide-stained epidermis from Bowman (top) and Zeo1.b (bottom) peduncles. (F) Average long-cell length (µm) per 1 cm peduncle segment (n=3/genotype). (G) Estimated number of long cells per file in Bowman and Zeo1.b peduncles. Box plots show 25th to 75th percentiles; whiskers extend down to 10th and up to 90th percentiles; black line shows median; and red line shows mean. Bw, Bowman; gc, guard cell; lc, long cell; sbc, subsidiary cell; sc, silica-cork cell pair. **P=0.004 (Student's t-test). Scale bars: 2 cm (A); 1 cm (C); 100 μm (E). Error bars represent s.e.m.
Fig. 2.
Fig. 2.
Developmental origin of Zeo1.b semi-dwarfism. (A) Intact upper barley stem (left) and after sectioning down the middle plane with a razor blade (right). Internodes numbered with respect to the peduncle internode. Leaves removed for clarity. (B-E) DAPI-stained sections (B,D) and in situ hybridisation with antisense HISTONE H4 (H4) probe (C,E) through Bowman peduncle initials at 24 days dpg (B,C), and through elongating 1.5 cm Bowman peduncles at 29 dpg (D,E). (F) Lines show average mitotic index of peduncle division zones and bars indicate peduncle length with hatched segments denoting the division zone region (n=3/genotype). (G) Proximo-distal length of the epidermal division zones in Bowman and Zeo1.b peduncles (n=3/genotype). (H) Long cell length (µm) per 1 cm segment of Bowman and Zeo1.b growing peduncles at defined lengths (n=10 cells/segment/3 biological replicates/genotype). (I) Peduncle cell number per file at defined peduncle lengths during growth (n=3/genotype/length). (J,K) Lignin auto-fluorescence in bottom (i) and middle (ii) sections of 2 cm (J) and 5 cm (K) peduncles. (L) Model of peduncle development. Bowman: peduncles entirely proliferative in the first phase, followed by a second phase with distinct division, elongation, maturation and termination zones and a final hyperexpansion phase in the basal peduncle associated with mitotic retreat. Zeo1.b: peduncle initiation is delayed, phase progression and growth in the coupled proliferation-expansion phase are slower, and the final hyperexpansion phase is absent. Bw, Bowman; c, collar; DZ, division zone; e, epidermis; EMZ, expansion-maturation transition zone; EZ, expansion zone; fl, flag leaf; la, central lacuna; MZ, maturation zone; n, node; p, peduncle; pa, parenchyma; pc, chlorenchyma; TZ, termination zone; v, vasculature. *P<0.05 (Student's t-test). Scale bars: 1 mm (A); 100 µm (B-E,J,K). Error bars represent s.e.m.
Fig. 3.
Fig. 3.
Comparative transcriptomes of peduncle initials and young spikes. (A) Venn diagrams show differentially expressed genes in Zeo1.b peduncle initials (PI) and spikes (Sp) compared with Bowman (Bw). (B) Heat maps of key genes misregulated in Zeo1.b peduncle initials. mne, mean normalised expression; AGL, AGAMOUS-LIKE; ERF, ETHYLENE RESPONSE FACTOR; LEA, LATE EMBRYOGENESIS ABUNDANT; PR, PATHOGENESIS-RELATED; SUB, SUBTILISIN.
Fig. 4.
Fig. 4.
Elongating peduncle transcriptome. (A) The 5 cm Bowman peduncle with 1 cm segments classified according to the zonation model. (B) PCA of biological replicates from peduncle segments labelled by zone. (C) Heat map of mean normalised expression of co-expressed clusters showing megaclusters (MGs). (D) Pie chart of differentially expressed genes (DEGs) within each MG. The colour assigned to each MG is consistent throughout the figure. (E) Mean normalised expression profile of each MG in red line. Dark grey line shows mean expression of entire transcriptome and light grey lines show individual DEGs. Colour-coded boxes below each profile show statistically enriched GO terms of the MG. (F,G) Heat maps show mean normalised expression of DEGs encoding cyclins, expansions or cellulose synthases (CESAs) and genes encoding key transcription factor families. Same scale as in C. Coloured bars on the left show the MG assigned to each DEG. Bw, Bowman; DZ, division zone; EZ, expansion zone; EMZ, expansion-maturation transition zone; mne, mean normalised expression; MZ, maturation zone; TZ, termination zone; ERF, ETHYLENE RESPONSE FACTOR; GRF, GROWTH REGULATING FACTOR; GIF, GRF INTERACTING FACTOR; SPL, SQUAMOSA PROMOTER BINDING-LIKE; NAC, NAM/ATAF/CUC; BLH, BEL1-LIKE HOMEODOMAIN; KNAT, KNOTTED-LIKE HOMEODOMAIN; AGL, AGAMOUS-LIKE.
Fig. 5.
Fig. 5.
Comparative transcriptomes of elongating peduncles. (A) The same time (ST) sampling compared 2 cm Zeo1.b and 5 cm Bowman peduncle division zone (DZ) segments harvested at the same time. Venn diagrams show differentially expressed genes (DEGs) in Zeo1.b compared with Bowman. Pie charts showing the elongating peduncle transcriptome megacluster (MG) association for down- and upregulated DEGs. (B) The same length (SL) sampling compared 2 cm Zeo1.b and 2 cm Bowman peduncle DZ and EZ-MZ segments. Venn diagrams show Zeo1.b DEGs and pie charts showing their MG associations. (C) Numbers in grey circles show shared DEGs between DZs of the ST and SL samplings and their MG association. (D) Interaction network of over-represented GO processes in the shared DZ DEGs. The darker the bubble colour, the lower the P-value. (E) Heat maps of transcription factors and stress-responsive DEGs. Bw, Bowman; DZ, division zone; EZ, expansion zone; EMZ, expansion-maturation transition zone; mne, mean normalised expression; MZ, maturation zone; TZ, termination zone; AGL, AGAMOUS-LIKE; ATHB, ARABIDOPSIS THALIANA HOMEOBOX PROTEIN; ERF, ETHYLENE RESPONSE FACTOR; WOX, WUSCHEL-like homeobox; JAZ, JASMONATE INTERACTING FACTORS; JIP, JAMONATE INDUCED PROTEIN; THIO, THIONIN; LOX2, LIPOXYGENASE2; LEA, LATE EMBRYO ABUNDANT; PR, PATHOGENESIS-RELATED.
Fig. 6.
Fig. 6.
Methyl jasmonate responses. (A-F) Plants mock-treated or treated with 1 mM or 5 mM methyl jasmonate (MeJA). (A,B) Bowman (A) and Zeo1.b (B) plants at 42 dpg. (C,D) Bowman (C) and Zeo1.b (D) spikes and upper culms at 35 dpg. Arrows indicate peduncles. (E,F) Bowman (E) and Zeo1.b (F) spikes and culms at 106 dpg; insets show magnification of spikes treated with 5 mM MeJA. (G) Culm elongation in Bowman and Zeo1.b treated with mock, 1 mM or 5 mM MeJA (n=8/Bowman; n=9/Zeo1.b). (H) Relative HvAP2 or miR172 expression in mock or 5 mM MeJA-treated spikes and stem at 35 dpg (n=3/genotype). *P=0.02 (Student's t-test) between mock- and 5 mM MeJA-treated Bowman. Scale bars: 5 cm (A,B,E,F); 1 mm (C,D, except mock 1 cm); 1 cm (E,F insets). Error bars represent s.e.m.
Fig. 7.
Fig. 7.
Gibberellin responses. (A) Bowman and Zeo1.b, uzu1.a and sdw1.a plants treated with mock or 0.01 mM gibberellin (GA3). (B) Culm lengths of Bowman, sdw1.a, uzu1.a and Zeo1.b plants following treatment with mock, 0.001 mM and 0.01 mM GA3 (n=7-10/genotype/treatment). (C) Long-cell length (µm) per 1 cm segment up the peduncle following either mock or 0.01 mM GA3 (n=3/genotype/treatment). (D) Long cell number per file in peduncles treated with mock or 0.01 mM GA3 (n=3 peduncles with 10 cells measured per cm/genotype). Box plots show 25th to 75th percentiles; whiskers extend down to 10th and up to 90th percentiles; black line shows median; and red line shows mean. (E) Culm lengths of Bowman, uzu1.a, Zeo1.b and uzu1.a Zeo1.b plants (n=7-19/genotype). (F) Culm lengths of Bowman, sdw1.a, Zeo1.b and sdw1.a Zeo1.b plants (n=10/genotype). Bw, Bowman. *P<0.05; ***P<0.001 (Student's t-test). nd, not statistically different. Scale bars: 5 cm. Error bars represent s.e.m.
Fig. 8.
Fig. 8.
Hypothetical model of HvAP2 control of stem elongation. Both HvAP2 and JA inhibit internode cell proliferation and expansion, whereas GA promotes these processes following the reproductive transition. Loss of miR172 targeting of HvAP2 is associated with JA-associated gene expression, and JA induces HvAP2 expression, suggesting that HvAP2 and JA may interact to regulate reproductive maturation and stem elongation. Loss of miR172 targeting of HvAP2 also leads to lower responsiveness to GA-mediated promotion of stem growth. We propose that limiting HvAP2 function via miR172 targeting is important for repression of JA signalling and promotion of the GA-mediated internode elongation in the reproductive phase.

References

    1. Anwar N., Ohta M., Yazawa T., Sato Y., Li C., Tagiri A., Sakuma M., Nussbaumer T., Bregitzer P., Pourkheirandish M. et al. (2018). miR172 downregulates the translation of cleistogamy 1 in barley. Ann. Bot. 122, 251-265. 10.1093/aob/mcy058 - DOI - PMC - PubMed
    1. Bai M.-Y., Shang J.-X., Oh E., Fan M., Bai Y., Zentella R., Sun T.-P. and Wang Z.-Y. (2012). Brassinosteroid, gibberellin and phytochrome impinge on a common transcription module in Arabidopsis. Nat. Cell Biol. 14, 810-817. 10.1038/ncb2546 - DOI - PMC - PubMed
    1. Baute J., Herman D., Coppens F., De Block J., Slabbinck B., Dell'Acqua M., Pè M. E., Maere S., Nelissen H. and Inze D. (2015). Correlation analysis of the transcriptome of growing leaves with mature leaf parameters in a maize RIL population. Genome Biol. 16, 168 10.1186/s13059-015-0735-9 - DOI - PMC - PubMed
    1. Bell A. D. and Bryan A. (2008). Plant Form: An Illustrated Guide to Flowering Plant Morphology. Timber Press.
    1. Bell E., Creelman R. A. and Mullet J. E. (1995). A chloroplast lipoxygenase is required for wound-induced jasmonic acid accumulation in Arabidopsis. Proc. Natl. Acad. Sci. USA 92, 8675-8679. 10.1073/pnas.92.19.8675 - DOI - PMC - PubMed

Publication types

MeSH terms

Substances