. 2019 Jun 28;294(26):10131-10145.
doi: 10.1074/jbc.RA119.008294. Epub 2019 May 10.

Biophysical characterization of full-length human phenylalanine hydroxylase provides a deeper understanding of its quaternary structure equilibrium

Affiliations

Biophysical characterization of full-length human phenylalanine hydroxylase provides a deeper understanding of its quaternary structure equilibrium

Emilia C Arturo et al. J Biol Chem. .

Abstract

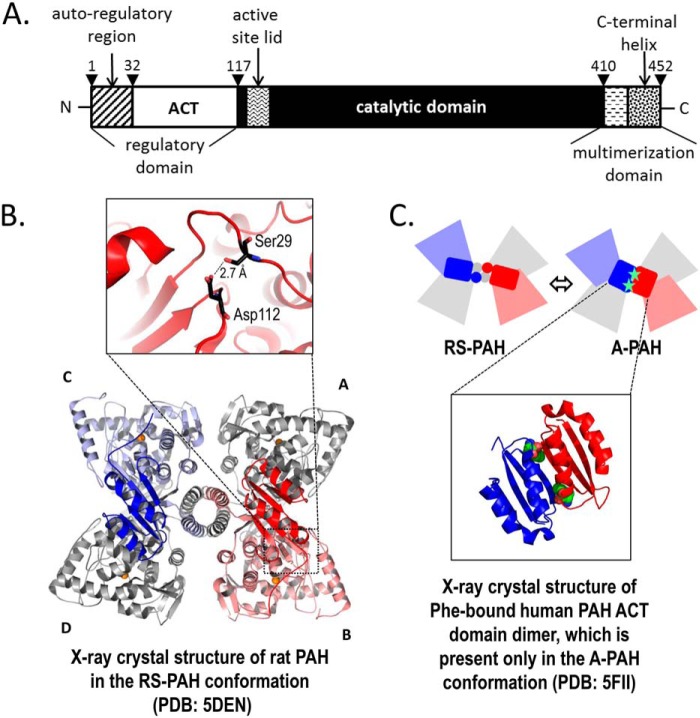
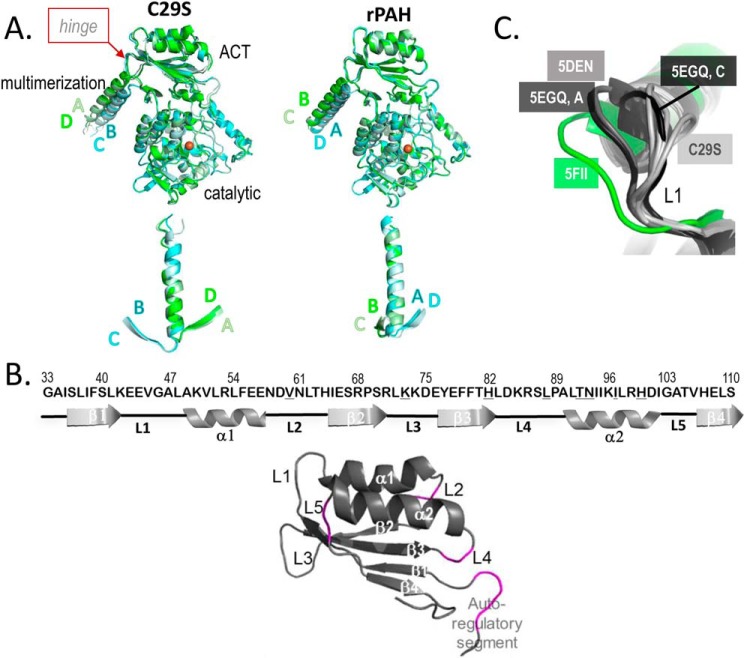
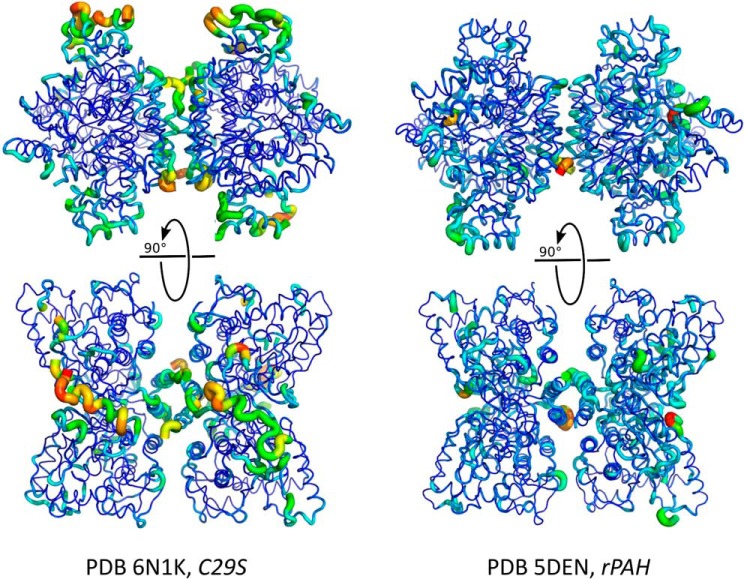
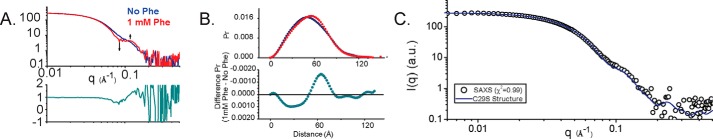
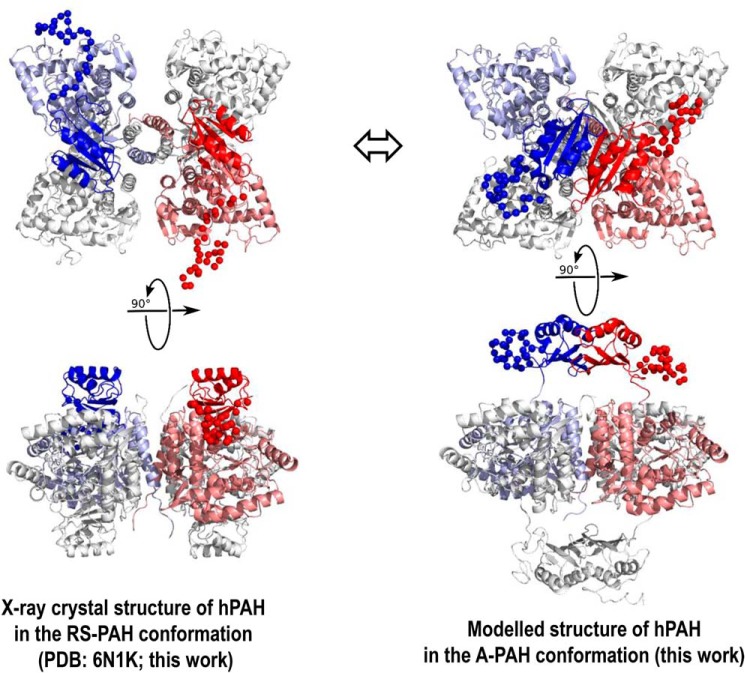
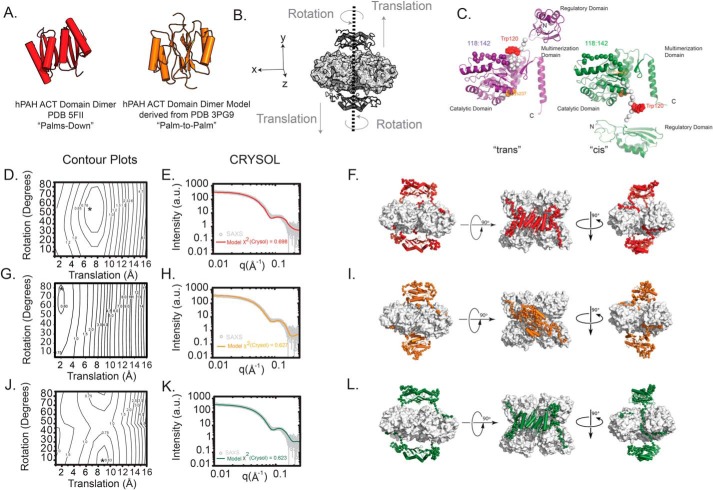
Dysfunction of human phenylalanine hydroxylase (hPAH, EC 1.14.16.1) is the primary cause of phenylketonuria, the most common inborn error of amino acid metabolism. The dynamic domain rearrangements of this multimeric protein have thwarted structural study of the full-length form for decades, until now. In this study, a tractable C29S variant of hPAH (C29S) yielded a 3.06 Å resolution crystal structure of the tetrameric resting-state conformation. We used size-exclusion chromatography in line with small-angle X-ray scattering (SEC-SAXS) to analyze the full-length hPAH solution structure both in the presence and absence of Phe, which serves as both substrate and allosteric activators. Allosteric Phe binding favors accumulation of an activated PAH tetramer conformation, which is biophysically distinct in solution. Protein characterization with enzyme kinetics and intrinsic fluorescence revealed that the C29S variant and hPAH are otherwise equivalent in their response to Phe, further supported by their behavior on various chromatography resins and by analytical ultracentrifugation. Modeling of resting-state and activated forms of C29S against SAXS data with available structural data created and evaluated several new models for the transition between the architecturally distinct conformations of PAH and highlighted unique intra- and inter-subunit interactions. Three best-fitting alternative models all placed the allosteric Phe-binding module 8-10 Å farther from the tetramer center than do all previous models. The structural insights into allosteric activation of hPAH reported here may help inform ongoing efforts to treat phenylketonuria with novel therapeutic approaches.

Keywords: ACT domain; X-ray crystallography; allosteric regulation; inborn error of metabolism; phenylalanine hydroxylase; phenylketonuria; protein conformation; resting-state structure; small-angle X-ray scattering (SAXS); structural biology; structural modeling.


Conflict of interest statement

The authors declare that they have no conflicts of interest with the contents of this article

Figures

Figure 1.
Figure 1.
PAH structure. A, refined description of the domain structure of hPAH. The N-terminal 32 amino acids have been called an autoregulatory sequence, which together with the ACT subdomain (residues 33–110) constitute the regulatory domain (residues 1 to ∼117). The N-terminal ∼20 amino acids are disordered in all PAH crystal structures; residues 111–117 constitute a loop that connects the ACT subdomain to the rest of the protein. The residues between 118 and ∼410 have been defined as the catalytic domain. The region between 118 and 127 contains a tryptophan, whose intrinsic fluorescence changes upon enzyme activation (43), residues 128–148 constitute the active-site lid, and residues 137–141 are disordered in all full-length PAH structures in the RS-PAH conformation. Residues 411–453 have been designated as the multimerization domain based on truncation analysis. However, the crystal structure suggests that the β-hairpin at 411–424 might best be considered part of the catalytic domain. Residues 425 and 426 constitute a connection between this expanded catalytic domain and a long C-terminal α-helix (residues 427–452). The C-terminal helices form a 4-helix bundle that secures the tetramer (see B). The most C-terminal residues are disordered in all full-length mammalian PAH structures. B, illustrated is the highest-resolution structure of full-length rPAH in the RS-PAH conformation (7). The regulatory domains of subunit B (red) and subunit C (blue) are in bolder tones. Subunits A and D are colored gray. The interaction between the auto-regulatory region and the catalytic domain, which partially occludes the active site in the RS-PAH conformation, is stabilized by a 2.7 Å hydrogen bond between Ser-29 and Asp-112 (inset). C, top is a schematic of the RS-PAH ⇔ A-PAH conformational interchange using coloring as in B. Bottom is the crystal structure of the ACT-domain dimer of hPAH with allosteric Phe bound (shown as spheres) (6). The repositioned regulatory domain in the A-PAH conformation releases active-site occlusion (not shown).
Figure 2.
Figure 2.
Characterization of hPAH and C29S. A, intrinsic fluorescence of WT hPAH and C29S in the absence or presence of activating concentrations of Phe. B, activation by Phe promotes oligomerization of C29S. Shown is a linearized plot of S.E. data from a single rotor speed (10,000 rpm) for 2.5 μm C29S in the absence (gray circles) and presence of 1 mm Phe (open circles) at 4 °C. The slopes are proportional to w at the given value of r2. Shown as dashed lines are the calculated lines expected for a monomer, dimer, and tetramer, respectively. See Fig. S2 for global fits to three rotor speeds and two concentrations in each state. C, SEC profiles of C29S in the absence and presence of saturating Phe. Black arrows indicate the elution volume (Ve) for the following standard proteins: 1, blue dextran (2000 kDa); 2, ferritin (440 kDa); 3, catalase (232 kDa); 4, aldolase (158 kDa); 5, BSA (67 kDa); and 6, bovine serum ovalbumin (43 kDa).
Figure 3.
Figure 3.
Flexibility within regulatory and multimerization domains of C29S. A, both C29S (left) and rPAH (PDB code 5DEN, right) are aligned on their respective chain A at catalytic domain residues 144–410 (top) and on their respective chain A C-terminal helices (residues 426–447, bottom). The overlay of helices was created by orienting the models such that Thr-427 is pointing out toward the reader to highlight the different spacing between the BC and AD pairs at the hinge that precedes the C-terminal helix (see top). B, secondary structure elements of the ACT subdomain of hPAH are defined (top), highlighting the connecting loops (L1–L5), and noting different degrees of disorder among the four subunits of tetrameric C29S. Differences in sequence between hPAH and rPAH are denoted with an underlined letter; the two PAH proteins are 89% sequence identical through residue 111. The RMSD after alignment of C29S with rPAH on their regulatory domains (i.e. through residue 111) is 0.76 Å. Colored magenta (bottom) are the loops that contain unmodeled, disordered segments in at least one subunit of the structure of C29S. C, four structures are overlaid on their ACT domains (from the N-terminal most residue through residue 111), and L1 is at center. Only one chain of PDB code 5FII (isolated human PAH ACT domains in an A-PAH conformation, with Phe bound, but not shown) and one chain of PDB entry 5DEN (the full-length rPAH structure in the RS-PAH conformation) are shown because the comparison is identical when using any other chain in those structures. Similarly, only two chains are shown for PDB code 5EGQ; chains B and D are identical to A at this position, whereas chain C is different from any other rPAH structure at this position.
Figure 4.
Figure 4.
C29S demonstrates considerable flexibility in the regulatory (ACT) domain. Molecular dynamics simulations of C29S (this work, left) and rPAH (PDB code 5DEN, right) using diffraction data as an experimental restraint in phenix.ensemble_refinement generated ensembles of compatible structures. Shown is the average structure of the ensemble of structures generated for each coordinate set, rendered as a cartoon putty. The thickness and color (warm is red) of the putty at any particular position is proportional to the RMSD at that position over the ensemble relative to the average structure.
Figure 5.
Figure 5.
Small-angle scattering analysis of C29S in the absence and presence of Phe. A, data were obtained by singular value decomposition-evolving factor analysis (SVD–EFA (8)) of SEC–SAXS data obtained for C29S in the presence and absence of 1 mm Phe (see under “Experimental procedures” and Figs. S2 and S3). Shown in A is a comparison of deconvoluted SAXS data for C29S without (blue) and with (red) incubation with 1 mm Phe. Data are shown as the superposed log–log plots of intensity as a function of q. Shown below this panel is a ratio plot where the discrepancy between the two profiles is highlighted as a function of 1. Identical regions have a value of 1, whereas higher discrepancies will deviate from unity. B, shape distribution function analysis for C29S in the absence (blue, resting state) and presence of 1 mm Phe (red, activated). Lower panel, ΔP(r) is shown, highlighting the change in interatomic vectors that occur upon activation of C29S with 1 mm Phe. C, complete atomistic model of C29S in the resting state derived from the crystal structure reported herein was created using NAMD, with missing inventory simulated as compacted random coil is shown in Fig. 6 (left). This model showed strong correlation with its solution scatter (χ2 = 0.99 using the program CRYSOL).
Figure 6.
Figure 6.
Structures of human PAH. A, X-ray crystal structure of hPAH in the RS-PAH conformation is illustrated (PDB code 6N1K). As in Fig. 1, the regulatory domains of subunit B (red) and subunit C (blue) are in bolder tones. Subunits A and D are colored gray. The disordered regions (missing inventory) are shown as balls and were modeled using NAMD to reconcile the crystal structure with the solution structure obtained from SAXS analysis. B, model of the A-PAH conformation, which contains a repositioned regulatory domain that no longer occludes the active site and contains an ACT-domain dimer. This model, the optimization of which is extensively discussed herein, employs the crystal structure of the truncated ACT domain of human PAH (residues 34–111) with allosteric Phe bound (PDB code 5FII (6)). The illustrated conformation of the entire autoregulatory region is shown as balls, as modeled by NAMD. The best-fit model contains the ACT-domain dimers at 8–10 Å farther from the tetramer center of mass than had previously been considered (see Fig. 7).
Figure 7.
Figure 7.
Modeling the activated form of hPAH. A, two models for the ACT-domain dimer are considered. Shown in red is the hPAH ACT-domain dimer determined by X-ray crystallography that features an eight-stranded β-sheet (PDB 5FII (6), palms-down). Shown in orange is an ACT-domain dimer model derived from the PDB 3PG9 structure (31), where the dimer interface is composed of two four-stranded β-sheets (palm–to–palm). B, all-atom models were constructed where the rotation and translation of the ACT-domain dimer (dark gray) was systematically sampled in 5° and 1 Å increments, respectively, in such a way that preserved the 2-fold symmetry plane across the xz plane. Linker regions with no known atomic structure were generated ab initio to complete the atomic inventory (see “Experimental procedures”). The remainder of the hPAH tetramer (light gray) was templated from the X-ray structure presented herein. These operations yielded an ensemble of theoretical models that could be tested against the experimental data. C, alternative possibilities for the hPAH subunit structure in the A-PAH conformation are shown. On the left (purple) is the traditional, proximal, or trans-connectivity, in which the position of residues 117–142 (spheres) is not substantially different relative to RS-PAH. For this model, the RS-PAH to A-PAH transition includes an ∼90° backbone rotation at residue ∼117 and a repositioning/restructuring of the autoregulatory region. On the right (green) is the newly proposed, reaching, or cis connectivity model, in which the repositioning/restructuring additionally involves residues 117–128 and the regulatory domain swings out and is transposed to the other side of the PAH tetramer. For both images, the backbone of residues 117–128 is colored white, Trp-120 (space-filling) is red, and Cys-237 (space-filling) is orange. D, calculated scattering profiles for each model in the ensemble with the palms-down–activated conformation were tested against the experimental data, and the best matches were identified using the χ2CRYSOL metric as a function of rotation and translation to derive a contour plot. The best model selected is denoted with an asterisk. E, log–log plot of the calculated scattering intensity of the best model (red line) is plotted against the experimental SAXS data (χ2CRYSOL = 0.698). F, orthogonal views of the best atomistic model identified by this approach is illustrated. Highlighted in red is the modeled ACT domains, with the ab initio–generated linkers (residues 1–30, 111:142) shown as red C-α spheres. G, contour plot for the ensemble of models modeled with the palm–to–palm conformation is shown. The best model selected is denoted with an asterisk. H, log–log plot of the calculated scattering intensity of the best model (orange line) is plotted against the experimental SAXS data (χ2CRYSOL = 0.627). I, orthogonal views of the best atomistic model identified is shown. The ACT-domain dimer and linkers are highlighted in orange, and the ab initio–generated linkers (residues 1–30, 111:142) are shown as C-α spheres. J, contour plot for the modeling results testing the palms down conformation is shown, but with an alternative topology of interdomain linkers (C). The best model selected is denoted with an asterisk. K, log–log plot of the calculated scattering intensity of the best model (green line) is plotted against the experimental SAXS data (χ2CRYSOL = 0.623). L, orthogonal views of the best atomistic model identified is shown, with the ACT-domain dimer and linkers highlighted in green and the ab initio-generated linkers (residues 1–30, 111:142) shown as C-α spheres.

References

    1. Blau N. (2016) Genetics of phenylketonuria: then and now. Hum. Mutat. 37, 508–515 10.1002/humu.22980 - DOI - PubMed
    1. Chipman D. M., and Shaanan B. (2001) The ACT domain family. Curr. Opin. Struct. Biol. 11, 694–700 10.1016/S0959-440X(01)00272-X - DOI - PubMed
    1. Grant G. A. (2006) The ACT domain: a small molecule binding domain and its role as a common regulatory element. J. Biol. Chem. 281, 33825–33829 10.1074/jbc.R600024200 - DOI - PubMed
    1. Lang E. J., Cross P. J., Mittelstädt G., Jameson G. B., and Parker E. J. (2014) Allosteric ACTion: the varied ACT domains regulating enzymes of amino-acid metabolism. Curr. Opin. Struct. Biol. 29, 102–111 10.1016/j.sbi.2014.10.007 - DOI - PubMed
    1. Jaffe E. K. (2017) New protein structures provide an updated understanding of phenylketonuria. Mol. Genet. Metab. 121, 289–296 10.1016/j.ymgme.2017.06.005 - DOI - PMC - PubMed

Publication types

LinkOut - more resources