. 2019 Jun 15;202(12):3381-3393.
doi: 10.4049/jimmunol.1801394. Epub 2019 May 10.

A Precision B Cell-Targeted Therapeutic Approach to Autoimmunity Caused by Phosphatidylinositol 3-Kinase Pathway Dysregulation

Affiliations

A Precision B Cell-Targeted Therapeutic Approach to Autoimmunity Caused by Phosphatidylinositol 3-Kinase Pathway Dysregulation

S Elizabeth Franks et al. J Immunol. .

Abstract

The inositol lipid phosphatases PTEN and SHIP-1 play a crucial role in maintaining B cell anergy and are reduced in expression in B cells from systemic lupus erythematosus and type 1 diabetes patients, consequent to aberrant regulation by miRNA-7 and 155. With an eye toward eventual use in precision medicine therapeutic approaches in autoimmunity, we explored the ability of p110δ inhibition to compensate for PI3K pathway dysregulation in mouse models of autoimmunity. Low dosages of the p110δ inhibitor idelalisib, which spare the ability to mount an immune response to exogenous immunogens, are able to block the development of autoimmunity driven by compromised PI3K pathway regulation resultant from acutely induced B cell-targeted haploinsufficiency of PTEN and SHIP-1. These conditions do not block autoimmunity driven by B cell loss of the regulatory tyrosine phosphatase SHP-1. Finally, we show that B cells in NOD mice express reduced PTEN, and low-dosage p110δ inhibitor therapy blocks disease progression in this model of type 1 diabetes. These studies may aid in the development of precision treatments that act by enforcing PI3K pathway regulation in patients carrying specific risk alleles.


Figures

Figure 1.
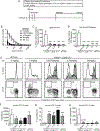
Figure 1.. Low dose Idelalisib delays disease progression in VH125.NOD mice without compromising response to immunization.
(A) A schematic representation of the survival experimental protocol. (B) Disease incidence as measured by % non-diabetic (two consecutive blood glucose readings <250mg/dl) mice receiving vehicle control chow (black line) or 0.9375mg/kg Idelalisib containing chow (grey line) (n = 25/group). (C) A schematic representation of the immunization experimental protocol. (D) The total NP-specific (NP27 binding) and high affinity NP-specific (NP2 binding) IgM (left) and IgG (right) antibody secreting cell response (ASCs/Spleen) 14 days post immunization of mice receiving vehicle control chow (white bar) or 0.9375mg/kg Idelalisib chow (grey bar) (n = 7/group). (E) The total circulating NP-specific (NP27 binding) IgM (left) and IgG (center) and high affinity NP-specific (NP2 binding) IgG (right) at day 14 post-immunization of mice receiving vehicle control chow (white bars) or 0.9375mg/kg Idelalisib containing chow (grey bars) (dashed line represents pre-immunization anti-NP serum levels). (Idel= Idelalisib. BG= blood glucose. Bars in D & E represent mean ± SEM. Log-rank (Mantel-Cox) test was used to calculate statistics in B. One-Way ANOVA was used to calculate statistics in D & E. *=p<0.05, **= p<0.01,***=p<0.005, ****=p<0.0001).
Figure 2.
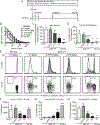
Figure 2.. Autoreactive PTEN−/+ × SHIP-1−/+ B cells re-establish anergy when treated with Idelalisib.
(A) A schematic representation of the experimental protocol. (B) WT Ars/A1 or PTENfl/wt×SHIP-1fl/wt Ars/A1-derived IgMa anti-Ars antibody detected in serum 14 days post tamoxifen treatment of mice receiving vehicle control chow (open circles), 0.9375mg/kg (closed squares), 3.75mg/kg (closed triangles), 30mg/kg (closed circles) and WT Ars/A1 receiving 0mg/kg (open triangles) Idelalisib containing chow. (C) Quantification of relative response of PTENfl/wt×SHIP-1fl/wt Ars/A1-derived IgMa anti-Ars antibody detected in the serum 14 days post tamoxifen treatment. (D) Quantification of relative response of PTENfl/wt×SHIP-1fl/wt Ars/A1-derived IgMa anti-Ars ASCs/spleen 14 days post tamoxifen treatment. (E) Proliferation (top row) and plasmablast differentiation (bottom row) of splenic Ars/A1 Idiotype+ YFP+ B cells of mice on vehicle control chow (open black line, top row) or indicated doses of Idelalisib (shaded line, top row) 14 days post tamoxifen treatment. Enumeration of (F) total recovered transferred PTENfl/wt×SHIP-1fl/wt cells, (G) the unproliferated Ars/A1 Idiotype+ YFP+ population and (H) plasmablasts in the spleens of recipient mice 14 days post tamoxifen treatment (For E, F, G & H gated on: B220+ Ars/A1 Id+ YFP+). (Idel:= Idelalisib. n = 8/group. Data shown are representative of at least three replicated experiments. Bars in C, D, F, G & H represent mean ± SEM. One-Way ANOVA and Tukey’s multiple comparisons test was used to calculate statistics in C, D, F, G & H. *=p<0.05, **= p<0.01, ***=p<0.005, ****=p<0.0001, ND=undetectable).
Figure 3.
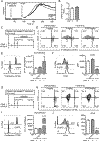
Figure 3.. Autoreactive SHP-1−/− B cells do not maintain anergy when treated with low dose Idelalisib.
(A) A schematic representation of the experimental protocol. (B) WT Ars/A1 or SHP-1fl/fl Ars/A1-derived IgMa anti-Ars antibody detected in serum 14 days post tamoxifen treatment of mice receiving vehicle control chow (open circles), 0.9375mg/kg (closed squares), 3.75mg/kg (closed triangles), 30mg/kg (closed circles) or WT Ars/A1 receiving 0mg/kg (open triangles) Idelalisib containing chow. (C) Quantification of relative response of SHP-1fl/fl Ars/A1-derived IgMa anti-Ars antibody detected in the serum 14 days post tamoxifen treatment. (D) Quantification of relative response of SHP-1fl/fl Ars/A1-derived IgMa anti-Ars ASCs/spleen 14 days post tamoxifen treatment. (E) Proliferation (top row) and plasmablast differentiation (bottom row) of splenic Ars/A1 Idiotype+ CD45.1+ B cells of mice on vehicle control chow (open black line, top row) or indicated doses of Idelalisib (shaded line, top row). Enumeration of (F) total recovered transferred SHP-1fl/fl cells, (G) the unproliferated Ars/A1 Idiotype+ CD45.1+ population and (H) plasmablasts in the spleens of recipient mice 14 days post tamoxifen treatment (For E, F, G & H gated on: B220+ Ars/A1 Id+ CD45.1+). (Idel:= Idelalisib. n = 8/group. Data shown are representative of at least three replicated experiments. Bars in C, D, F, G & H represent mean ± SEM. One-Way ANOVA and Tukey’s multiple comparisons test was used to calculate statistics in C, D, F, G & H. *=p<0.05, **= p<0.01, ***=p<0.005, ****=p<0.0001, ND=undetectable).
Figure 4.
Figure 4.. p110δ inhibition suppresses B cell calcium flux and reduces phosphorylation of downstream signaling intermediaries.
(A) Calcium flux of B220+ cells stimulated with anti-H&L with simultaneous addition of 0nM (black line), 15nM (solid grey line), 60nM (grey long dashed line) or 490nM (grey dashed line) Idelalisib. (B) Quantification of area under the curve (AUC) seen in A. (C) Quantification of phosphorylated signaling intermediaries after preincubation with indicated doses of Idelalisib and BCR stimulation. (Idel:= Idelalisib. n = 5/group. Data shown are representative of at least three replicated experiments. Bars in B & C represent mean ± SEM. Student T test was used to calculate statistics in B. One-Way ANOVA and Tukey’s multiple comparisons test was used to calculate statistics in C. *=p<0.05, **= p<0.01, ***=p<0.005, ****=p<0.0001).
Figure 5.
Figure 5.. Dose-dependent Idelalisib inhibition of antibody responses.
(A) A schematic representation of the experimental protocol. (B) Enumeration of total recovered transferred MD4 B cells and (C) quantification of the unproliferated population of recovered MD4+ B cells in the spleen of recipient mice 5 days post-immunization. (D) MD4-derived IgMa anti-HEL antibody detected in serum 5 days post immunization of mice receiving vehicle control chow (open circles), 0.9375mg/kg (closed squares), 3.75mg/kg (closed triangles), 30mg/kg (closed circles), and unimmunized mice receiving 0mg/kg (open triangles) Idelalisib containing chow. (E) Quantification of relative response of MD4-derived IgMa anti-HEL antibody detected in serum and (F) MD4-derived IgMa anti-HEL ASCs/ spleen 5 days post immunization. (G) Proliferation of splenic MD4+ B cells 5 days post-immunization of mice receiving vehicle control chow (unfilled black line) or indicated doses of Idelalisib (shaded grey line). (Idel:= Idelalisib. -imm= unimmunized. n = 8/group. Data shown are representative of at least three replicated experiments. B, C & G gated on: B220+ HEL binding+. Bars in B, C, E & F represent mean ± SEM. One-Way ANOVA and Tukey’s multiple comparisons test was used to calculate statistics. *=p<0.05, **= p<0.01, ***=p<0.005, ****=p<0.0001).
Figure 6.
Figure 6.. Low dose p110δ inhibition does not inhibit CD4+ or CD8+ T cell responses.
(A) Calcium flux of CD4+ T cells stained with anti-CD3 biotin with simultaneous addition of 0nM (black line) or 15nM (grey line) Idelalisib, and crosslinked with avidin. (B) Quantification of area under the curve of A. (C) A schematic representation of the experimental protocol. (D) Representative flow cytometric plots of proliferation (CFSE) and upregulation of CD44 following immunization. (E) Representative histogram (left) and quantification (right) of proliferation (CFSE) of recovered OT-II T cells from the spleens of recipient mice. (F) Representative histogram (left) and quantification (right) of upregulation of CD44 of recovered OT-II T cells from the spleens of recipient mice. (G) A schematic representation of the experimental protocol. (H) Representative flow cytometric plots of proliferation (CFSE) and upregulation of CD44 following immunization. (I) Representative histogram (left) and quantification (right) of proliferation (CFSE) of recovered OT-I T cells from the spleens of recipient mice. (J) Representative histogram (left) and quantification (right) of upregulation of CD44 of recovered OT-I T cells from the spleens of recipient mice. (Idel:= Idelalisib. imm+/− = immunized/unimmunized. n = 5/group. Data shown are representative of at least two replicated experiments. Bars in B, E, F, I & J represent mean ± SEM. Students T test was used to calculate statistics in B. One-Way ANOVA and Tukey’s multiple comparisons test was used to calculate statistics in E, F, I & J. *=p<0.05, **= p<0.01, ***=p<0.005, ****=p<0.0001).

References

    1. Gay D, Saunders T, Camper S, and Weigert M. 1993. Receptor editing: an approach by autoreactive B cells to escape tolerance. J Exp Med 177: 999–1008. - PMC - PubMed
    1. Tiegs SL, Russell DM, and Nemazee D. 1993. Receptor editing in self-reactive bone marrow B cells. J Exp Med 177: 1009–1020. - PMC - PubMed
    1. Halverson R, Torres RM, and Pelanda R. 2004. Receptor editing is the main mechanism of B cell tolerance toward membrane antigens. Nat Immunol 5: 645–650. - PubMed
    1. Nemazee DA, and Burki K. 1989. Clonal deletion of B lymphocytes in a transgenic mouse bearing anti-MHC class I antibody genes. Nature 337: 562–566. - PubMed
    1. Cyster JG, Hartley SB, and Goodnow CC. 1994. Competition for follicular niches excludes self-reactive cells from the recirculating B-cell repertoire. Nature 371: 389–395. - PubMed

Publication types

MeSH terms

Substances