. 2019 Jul 1;203(1):282-292.
doi: 10.4049/jimmunol.1801068. Epub 2019 May 10.

Microbiota Metabolite Short-Chain Fatty Acids Facilitate Mucosal Adjuvant Activity of Cholera Toxin through GPR43

Affiliations

Microbiota Metabolite Short-Chain Fatty Acids Facilitate Mucosal Adjuvant Activity of Cholera Toxin through GPR43

Wenjing Yang et al. J Immunol. .

Abstract

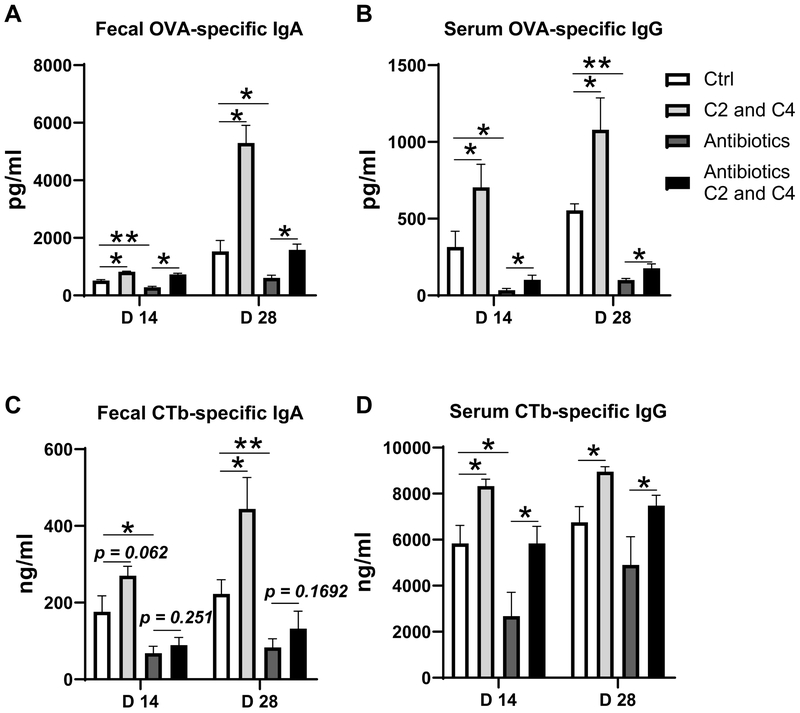
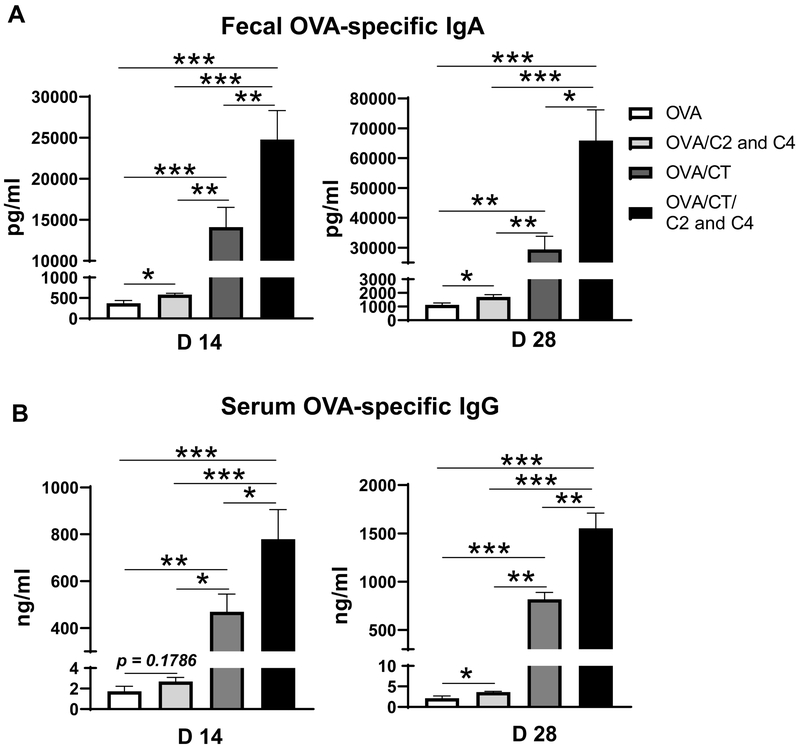
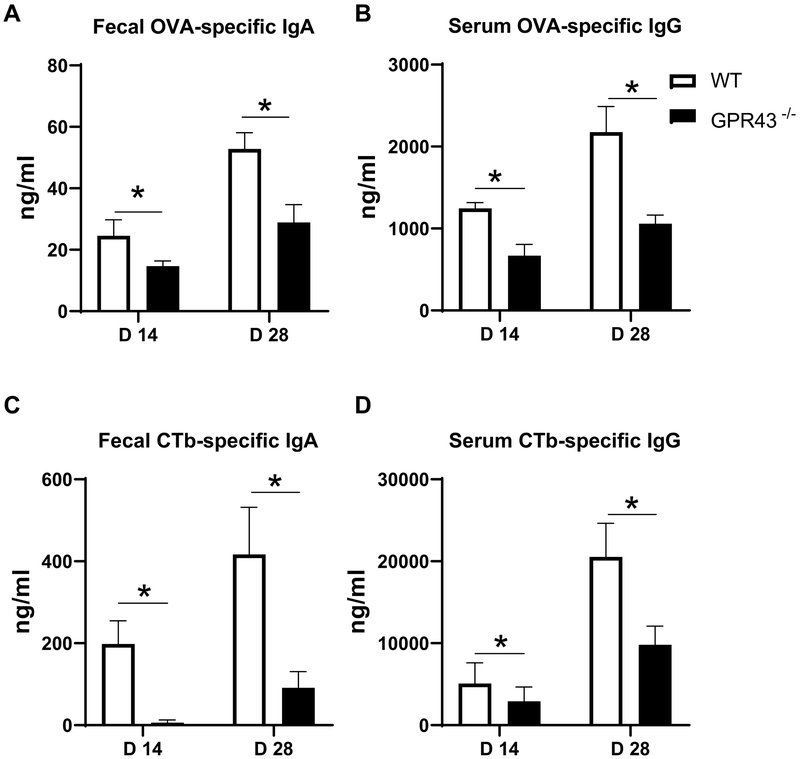
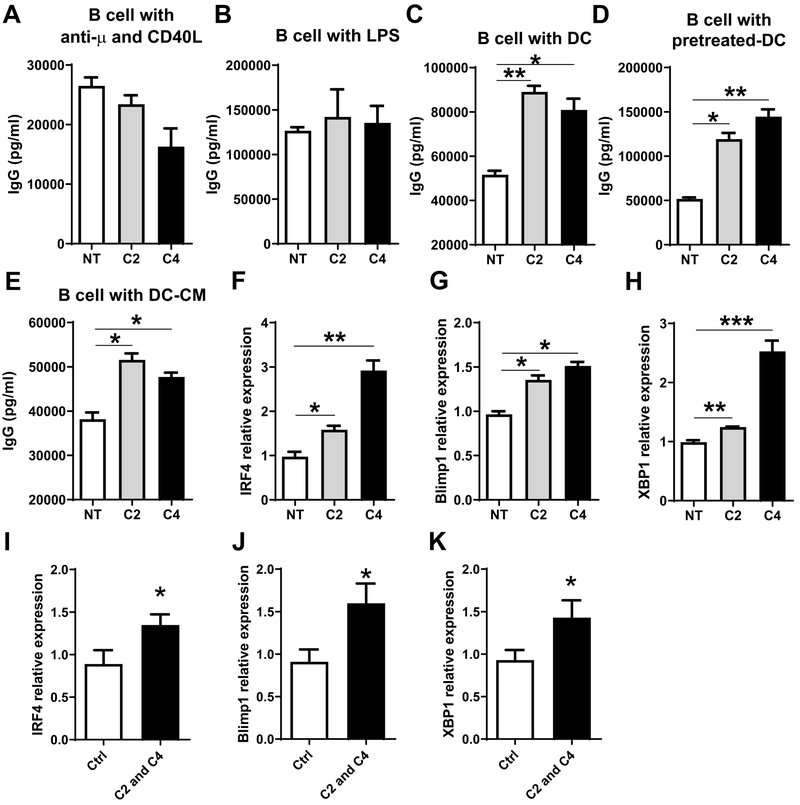
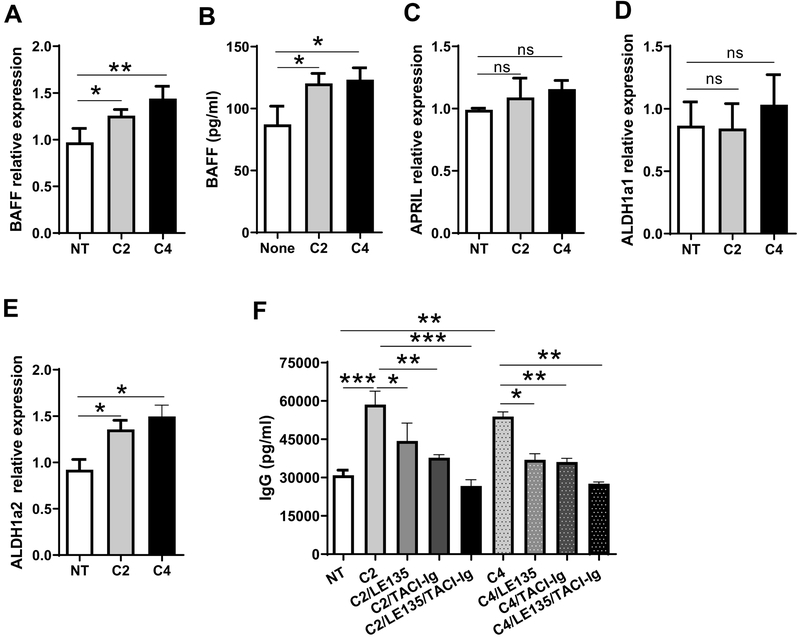
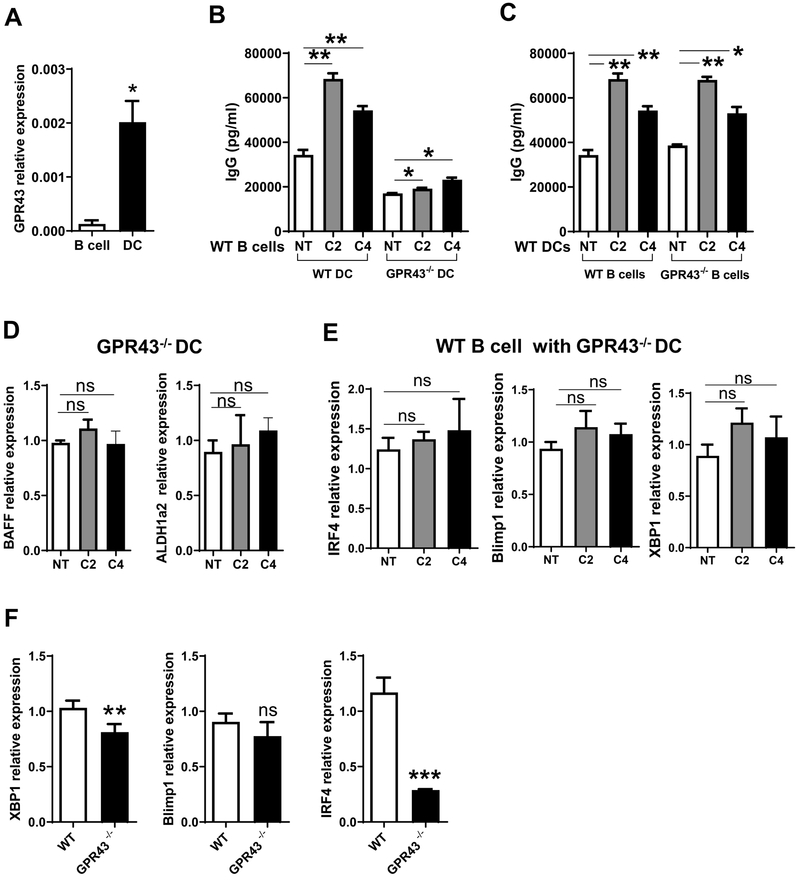
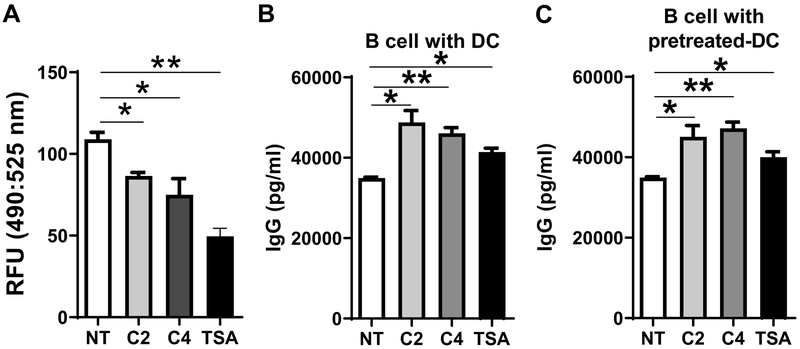
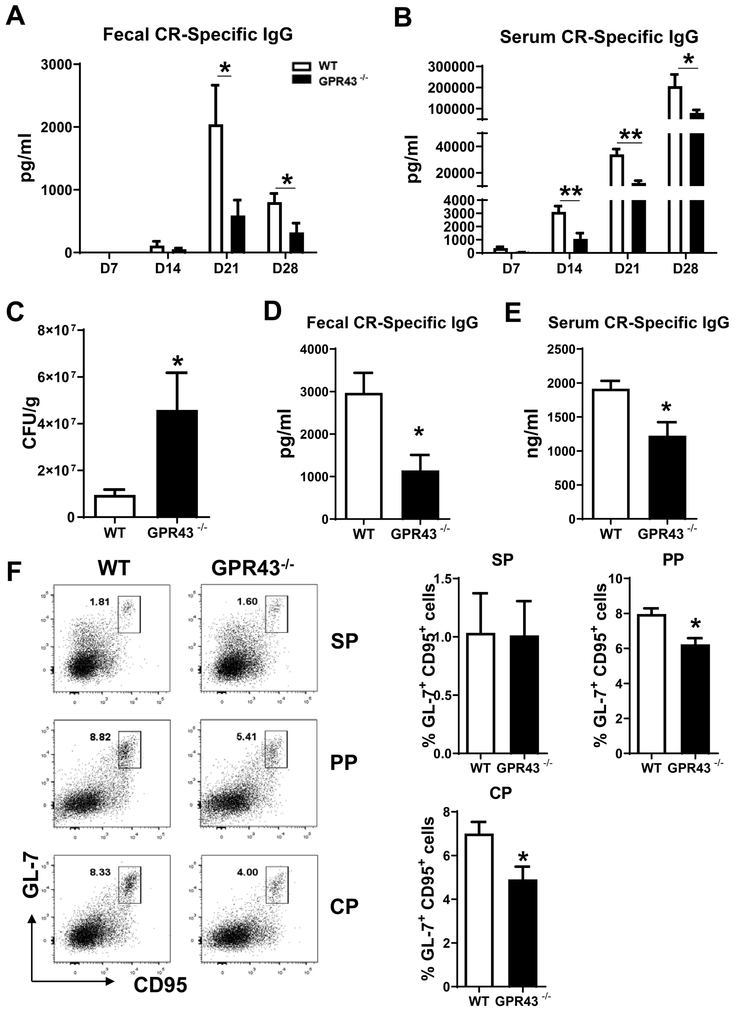
The gut microbiota has been shown critical for mucosal adjuvant activity of cholera toxin (CT), a potent mucosal adjuvant. However, the mechanisms involved remain largely unknown. In this study, we report that depletion of gut bacteria significantly decreased mucosal and systemic Ab responses in mice orally immunized with OVA and CT. Feeding mice short-chain fatty acids (SCFAs) promoted Ab responses elicited by CT, and, more importantly, rescued Ab responses in antibiotic-treated mice. In addition, mice deficient in GPR43, a receptor for SCFAs, showed impaired adjuvant activity of CT. Administering CT did not promote SCFA production in the intestines; thus, SCFAs facilitated but did not directly mediate the adjuvant activity of CT. SCFAs promoted B cell Ab production by promoting dendritic cell production of BAFF and ALDH1a2, which induced B cell expression of IFN regulatory factor 4, Blimp1, and XBP1, the plasma B cell differentiation-related genes. Furthermore, when infected with Citrobacter rodentium, GPR43-/- mice exhibited decreased Ab responses and were more susceptible to infection, whereas the administration of SCFAs promoted intestinal Ab responses in wild-type mice. Our study thereby demonstrated a critical role of gut microbiota and their metabolite SCFAs in promoting mucosal adjuvant activity of CT through GPR43.


Conflict of interest statement

Disclosures: The authors report no financial conflict of interests.

Figures

Figure 1.
Figure 1.. Feeding acetate and butyrate promotes mucosal IgA and systemic IgG responses in mice orally immunized with OVA and CT.
Groups (n = 4–5) of WT mice were fed with or without antibiotics for 10 days. The antibiotic-treated and untreated WT mice were immunized with 100 μg OVA and 10 μg CT on day 0 and day 14 by gavage. The mice were fed with or without a mixture of 200 mM acetate (C2) and butyrate (C4) in drinking water for 28 days. Fecal pellets and serum samples were collected for analysis of OVA-specific IgA in feces (A), OVA-specific IgG in serum (B), CTb-specific IgA in feces (C), and CTb-specific IgG in serum (D) production by ELISA. One representative of three independent experiments was shown. The data were expressed as mean ± s.e.m. *p < 0.05, **p < 0.01.
Figure 2.
Figure 2.. SCFAs and CT promote OVA-specific antibody responses synergistically.
Four groups (n= 4–5) of WT mice were orally immunized with 100 μg OVA alone, or together with 10 μg CT on day 0 and day 14 by gavage, and fed with or without the mixture of acetate and butyrate in drinking water for 28 days. Feces and serum samples were collected on days 14 and 28. (A-B) OVA-specific antibody levels in feces (A) and serum (B) were measured by ELISA. One representative of two independent experiments was shown. The data were expressed as mean ± s.e.m. *p < 0.05, **p < 0.01, ***p < 0.001.
Figure 3.
Figure 3.. Impaired CT adjuvant activity in GPR43−/− mice.
Groups (n = 4–5) of GPR43−/− and WT mice were immunized with 100 μg OVA and 10 μg CT on day 0 and day 14 by gavage. Feces and serum samples were collected on days 14 and 28. OVA-specific IgA (A) and CTb-specific IgA (C) in fecal, and OVA-specific IgG (B) and CTb-specific IgG (D) in serum were measured by ELISA. One representative of three independent experiments was shown. The data were expressed as mean ± s.e.m. *p < 0.05.
Figure 4.
Figure 4.. Acetate and butyrate promote B cell IgG production and plasma B cell differentiation related genes through interaction with DCs.
Splenic naïve IgD+ B cells were cultured with 1 mM acetate (C2) or 0.5 mM butyrate (C4) for 5 days in the presence of 5 μg/ml anti-μ plus 5 μg/ml CD40L (A), or 1 μg/ml LPS (B), and IgG production in supernatants was determined by ELISA. (C) Splenic naïve IgD+ B cells were cultured with BMDCs in the presence of C2 or C4 for 5 days, and IgG levels in supernatants were analyzed by ELISA. (D) BMDCs were treated with or without C2 (1 mM) or C4 (0.5 mM) for 6 hrs, and then cultured with splenic naïve IgD+ B cells for 5 days. IgG levels in supernatants were analyzed using ELISA. (E) Splenic naïve IgD+ B cells were cultured with 5 μg/ml anti-μ plus 5 μg/ml CD40L for 5 days in the conditional medium (CM) from BMDCs treated with or without C2 (1 mM) or C4 (0.5 mM). IgG production in supernatants was measured using ELISA. (F-H) Naïve IgD+ B cells were cultured in different CM in the presence of 5 μg/ml anti-μ plus 5 μg/ml CD40L for 2 days. The expression of IRF4 (F), Blimp1 (G), and XBP1(H) was determined by qRT-PCR and normalized against GAPDH. (I-K) Groups (n = 4–5) of WT mice were immunized with 100 μg OVA and 10 μg CT on day 0 and day 14 by gavage. The mice were fed with or without a mixture of 200 mM acetate (C2) and butyrate (C4) in drinking water for 28 days. Splenic B220+ B cells were isolated from these mice on day 28, and the expression of IRF4 (I), Blimp1 (J), and XBP1 (K) was determined by qRT-PCR and normalized against GAPDH. One representative of three independent experiments was shown. The data were expressed as mean ± s.e.m. *p < 0.05, **p < 0.01, *** p < 0.001.
Figure 5.
Figure 5.. Acetate and butyrate induce DC expression of BAFF and ALDH1a2 for promoting B cell IgG production.
(A-D) BMDCs were treated with C2 (1 mM) or C4 (0.5 mM) for 2 days, and the expressions of BAFF (A), APRIL (C), ALDH1a1 (D), and ALDH1a2 (E) was analyzed by qRT-PCR and normalized against GAPDH. BAFF production in supernatants was analyzed by ELISA (B). (E) Splenic B cells were cultured for 5 days with BMDCs with or without C2 (1 mM) or C4 (0.5 mM) in the presence of TACI-Ig (5 μg/ml) or/and LE135 (10 μM), and IgG production were determined by ELISA. One representative of three independent experiments was shown. The data were expressed as mean ± s.e.m. *p < 0.05, **p < 0.01, ***p < 0.001.
Figure 6.
Figure 6.. GPR43 deficiency in DCs decreases B cell IgG production induced by acetate and butyrate.
(A) GPR43 expression in splenic B cells and BMDCs was determined by qRT-PCR. (B) WT or GPR43−/− BMDCs were cultured with WT B cells for 5 days in the presence of C2 (1 mM) or C4 (0.5 mM), and IgG production in supernatants was analyzed by ELISA. (C) WT BMDCs were cultured with WT or GPR43−/− B cells for 5 days in the presence of C2 (1 mM) or C4 (0.5 mM), and IgG production in supernatants were analyzed by ELISA. (D) GPR43−/− BMDCs were treated with C2 (1 mM) or C4 (0.5 mM) for 2 days, and the expressions of BAFF and ALDH1a2 was analyzed by qRT-PCR and normalized against GAPDH. (E) Splenic naïve IgD+ B cells were cultured with C2 (1 mM) or C4 (0.5 mM) in the presence of GPR43−/− DCs for 2 days. IRF4, Blimp1, and XBP1 expressions were then determined by qRT-PCR and normalized against GAPDH. (F) Groups (n = 4–5) of GPR43−/− and WT mice were immunized with 100 μg OVA and 10 μg CT on day 0 and day 14 by gavage. Splenic B220+ B cells were isolated from these mice on day 28, and the expression of IRF4, Blimp1, and XBP1 was determined by qRT-PCR and normalized against GAPDH. One representative of three independent experiments was shown. The data were expressed as mean ± s.e.m. *p < 0.05, **p < 0.01.
Figure 7.
Figure 7.. SCFAs promote B cell IgG production through HDAC inhibition.
(A) BMDCs were treated with or without C2 (1 mM), C4 (0.5 mM), or TSA (10 nM) for 24 hours, and HDAC activity was measured by the HDAC activity assay kit, and determined by using fluorescence intensity at excitation/emission (490/525 nm). (B) Splenic B cells were cultured with BMDCs in the presence of C2 (1 mM), C4 (0.5 mM), or TSA (10 nM) for 5 days, and IgG production in supernatants determined by ELISA. (C) BMDCs were pretreated with or without C2 (1 mM), C4 (0.5 mM), or TSA (10 nM) for 6 hours, and cultured with B cells for 5 days. IgG levels were determined by ELISA. One representative of three independent experiments was shown. The data were expressed as mean ± s.e.m. *p < 0.05, **p < 0.01.
Figure 8.
Figure 8.. Decreased antibody responses to Citrobactor rodentium in GPR43−/− mice.
Groups (n = 4–5) of WT and GPR43−/− mice were infected with C. rodentium at 1 × 10⁷ CFU by gavage on day 0, and fecal pellets as well as serum samples were collected on days 7, 14, and 28 post infection. C. rodentium-specific IgG production in fecal (A) in serum (B) were analyzed by ELISA. Mice were orally re-infected with C. rodentium at 5 × 10⁹ CFU on day 28 post first infection, and the numbers of CFU in fecal pellets were determined 7 days post re-infection (C). Specific IgG in feces and serum samples were also analyzed on day 7 post re-infection (D-E). Mice were sacrificed on day 10 post re-infection, and GL7+ CD95+ B cells were determined in spleen (SP), Peyer’s patches (PP), and colonic patches (CP) using flow cytometry (F). One representative of two independent experiments was shown. The data were expressed as mean ± s.e.m. *p < 0.05.

References

    1. Chen K, and Cerutti A. 2010. Vaccination strategies to promote mucosal antibody responses. Immunity 33: 479–491. - PMC - PubMed
    1. Ranasinghe C 2014. New advances in mucosal vaccination. Immunol Lett 161: 204–206. - PubMed
    1. Lycke N 2012. Recent progress in mucosal vaccine development: potential and limitations. Nat Rev Immunol 12: 592–605. - PubMed
    1. Freytag LC, and Clements JD. 2005. Mucosal adjuvants. Vaccine 23: 1804–1813. - PubMed
    1. Kim D, Kim YG, Seo SU, Kim DJ, Kamada N, Prescott D, Chamaillard M, Philpott DJ, Rosenstiel P, Inohara N, and Nunez G. 2016. Nod2-mediated recognition of the microbiota is critical for mucosal adjuvant activity of cholera toxin. Nature medicine 22: 524–530. - PMC - PubMed

Publication types

MeSH terms