

Integrative analysis of gene expression, DNA methylation, physiological traits, and genetic variation in human skeletal muscle
- PMID: 31076557
- PMCID: PMC6561151
- DOI: 10.1073/pnas.1814263116
Integrative analysis of gene expression, DNA methylation, physiological traits, and genetic variation in human skeletal muscle
Abstract
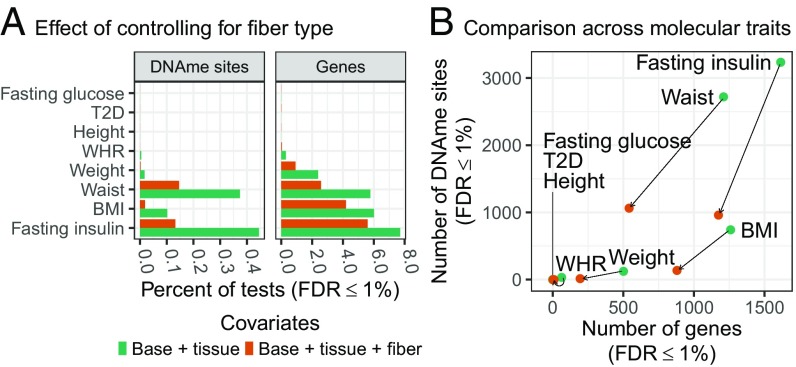
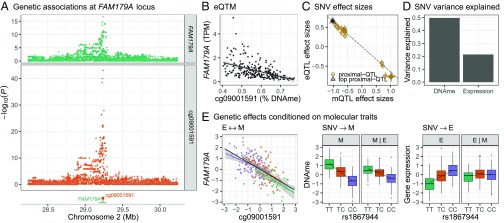
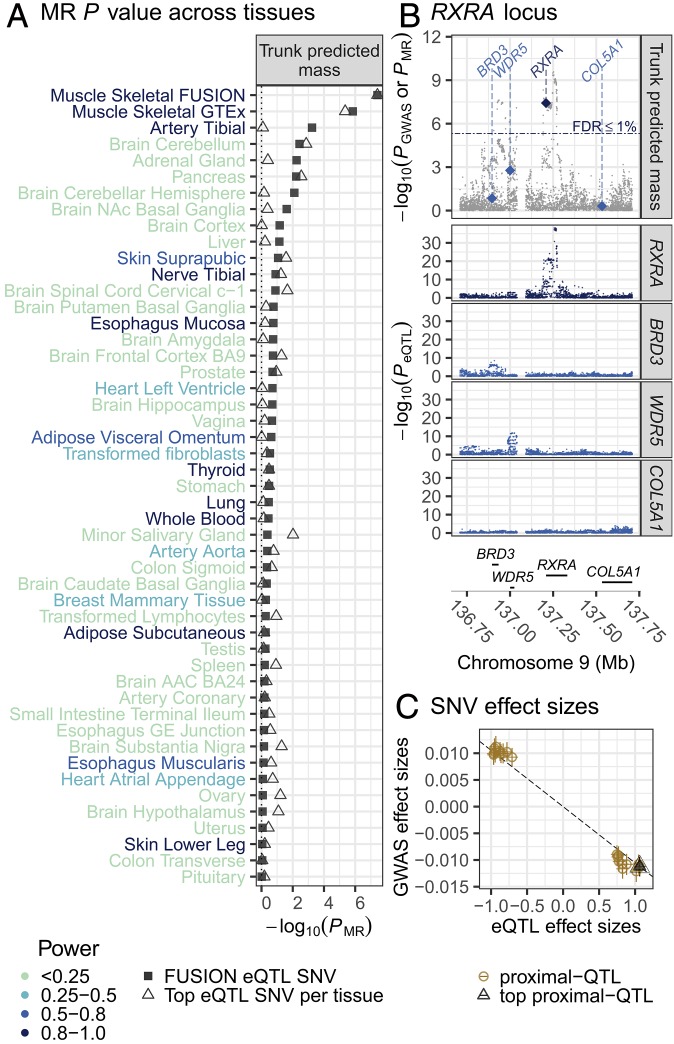
We integrate comeasured gene expression and DNA methylation (DNAme) in 265 human skeletal muscle biopsies from the FUSION study with >7 million genetic variants and eight physiological traits: height, waist, weight, waist-hip ratio, body mass index, fasting serum insulin, fasting plasma glucose, and type 2 diabetes. We find hundreds of genes and DNAme sites associated with fasting insulin, waist, and body mass index, as well as thousands of DNAme sites associated with gene expression (eQTM). We find that controlling for heterogeneity in tissue/muscle fiber type reduces the number of physiological trait associations, and that long-range eQTMs (>1 Mb) are reduced when controlling for tissue/muscle fiber type or latent factors. We map genetic regulators (quantitative trait loci; QTLs) of expression (eQTLs) and DNAme (mQTLs). Using Mendelian randomization (MR) and mediation techniques, we leverage these genetic maps to predict 213 causal relationships between expression and DNAme, approximately two-thirds of which predict methylation to causally influence expression. We use MR to integrate FUSION mQTLs, FUSION eQTLs, and GTEx eQTLs for 48 tissues with genetic associations for 534 diseases and quantitative traits. We identify hundreds of genes and thousands of DNAme sites that may drive the reported disease/quantitative trait genetic associations. We identify 300 gene expression MR associations that are present in both FUSION and GTEx skeletal muscle and that show stronger evidence of MR association in skeletal muscle than other tissues, which may partially reflect differences in power across tissues. As one example, we find that increased RXRA muscle expression may decrease lean tissue mass.
Keywords: DNA methylation; eQTL; gene expression; mQTL; skeletal muscle.
Copyright © 2019 the Author(s). Published by PNAS.
Conflict of interest statement
Conflict of interest statement: D.J.G. and E.B. are members of the Human Induced Pluripotent Stem Cell Initiative and coauthors on a 2017 research article.
Figures
Similar articles
-
Identification of candidate genes for endometrial cancer in multi-omics: a Mendelian randomization analysis.Syst Biol Reprod Med. 2024 Dec;70(1):299-311. doi: 10.1080/19396368.2024.2411458. Epub 2024 Oct 14. Syst Biol Reprod Med. 2024. PMID: 39401154
-
DNA methylation markers associated with type 2 diabetes, fasting glucose and HbA1c levels: a systematic review and replication in a case-control sample of the Lifelines study.Diabetologia. 2018 Feb;61(2):354-368. doi: 10.1007/s00125-017-4497-7. Epub 2017 Nov 21. Diabetologia. 2018. PMID: 29164275 Free PMC article.
-
Adipose Tissue Gene Expression Associations Reveal Hundreds of Candidate Genes for Cardiometabolic Traits.Am J Hum Genet. 2019 Oct 3;105(4):773-787. doi: 10.1016/j.ajhg.2019.09.001. Epub 2019 Sep 26. Am J Hum Genet. 2019. PMID: 31564431 Free PMC article.
-
Magnetic resonance perfusion for differentiating low-grade from high-grade gliomas at first presentation.Cochrane Database Syst Rev. 2018 Jan 22;1(1):CD011551. doi: 10.1002/14651858.CD011551.pub2. Cochrane Database Syst Rev. 2018. PMID: 29357120 Free PMC article.
-
Different intensities of glycaemic control for women with gestational diabetes mellitus.Cochrane Database Syst Rev. 2023 Oct 10;10(10):CD011624. doi: 10.1002/14651858.CD011624.pub3. Cochrane Database Syst Rev. 2023. PMID: 37815094 Free PMC article.
Cited by
-
Multi-Omics Studies in Historically Excluded Populations: The Road to Equity.Clin Pharmacol Ther. 2023 Mar;113(3):541-556. doi: 10.1002/cpt.2818. Epub 2023 Jan 16. Clin Pharmacol Ther. 2023. PMID: 36495075 Free PMC article. Review.
-
DNA methylation QTL mapping across diverse human tissues provides molecular links between genetic variation and complex traits.Nat Genet. 2023 Jan;55(1):112-122. doi: 10.1038/s41588-022-01248-z. Epub 2022 Dec 12. Nat Genet. 2023. PMID: 36510025 Free PMC article.
-
Prefrontal cortex eQTLs/mQTLs enriched in genetic variants associated with alcohol use disorder and other diseases.Epigenomics. 2020 May;12(9):789-800. doi: 10.2217/epi-2019-0270. Epub 2020 Jun 4. Epigenomics. 2020. PMID: 32496132 Free PMC article.
-
Capturing functional epigenomes for insight into metabolic diseases.Mol Metab. 2020 Aug;38:100936. doi: 10.1016/j.molmet.2019.12.016. Epub 2020 Feb 14. Mol Metab. 2020. PMID: 32199819 Free PMC article. Review.
-
Whole genome sequencing of 4,787 individuals identifies gene-based rare variants in age-related macular degeneration.Hum Mol Genet. 2024 Feb 1;33(4):374-385. doi: 10.1093/hmg/ddad189. Hum Mol Genet. 2024. PMID: 37934784 Free PMC article.
References
Publication types
MeSH terms
Substances
Grants and funding
LinkOut - more resources
Full Text Sources
Research Materials
Miscellaneous
