. 2019 May 10;9(1):7233.
doi: 10.1038/s41598-019-43829-9.

Tissue-specific genes as an underutilized resource in drug discovery

Affiliations

Tissue-specific genes as an underutilized resource in drug discovery

Maria Ryaboshapkina et al. Sci Rep. .

Abstract

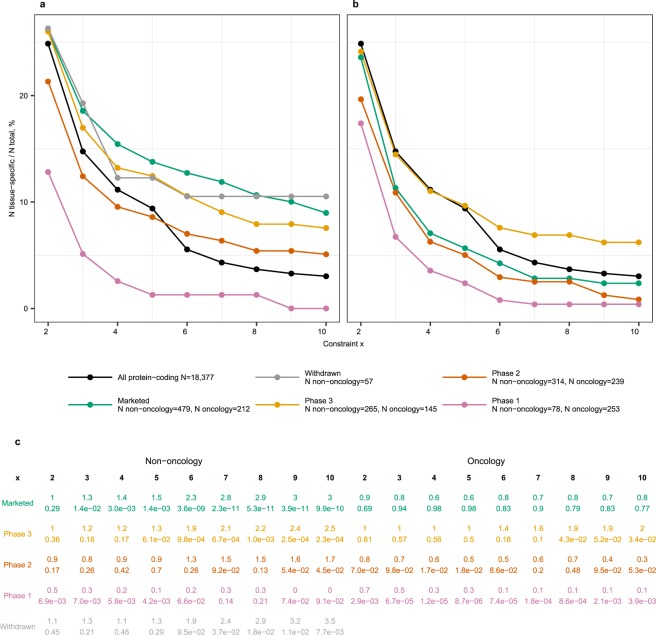
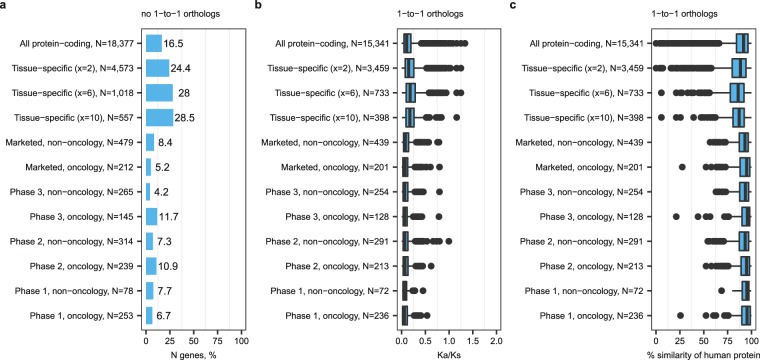
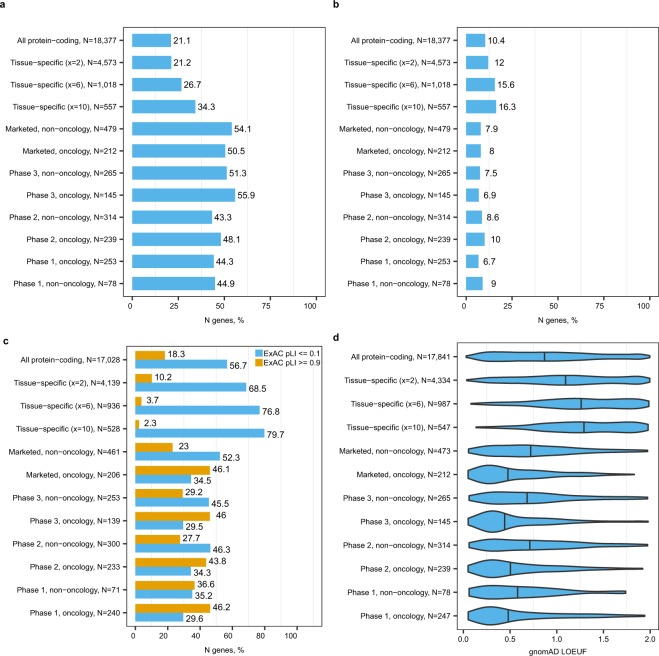
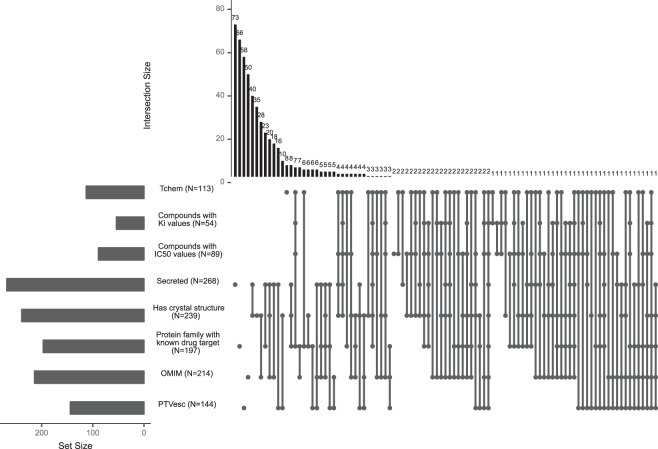
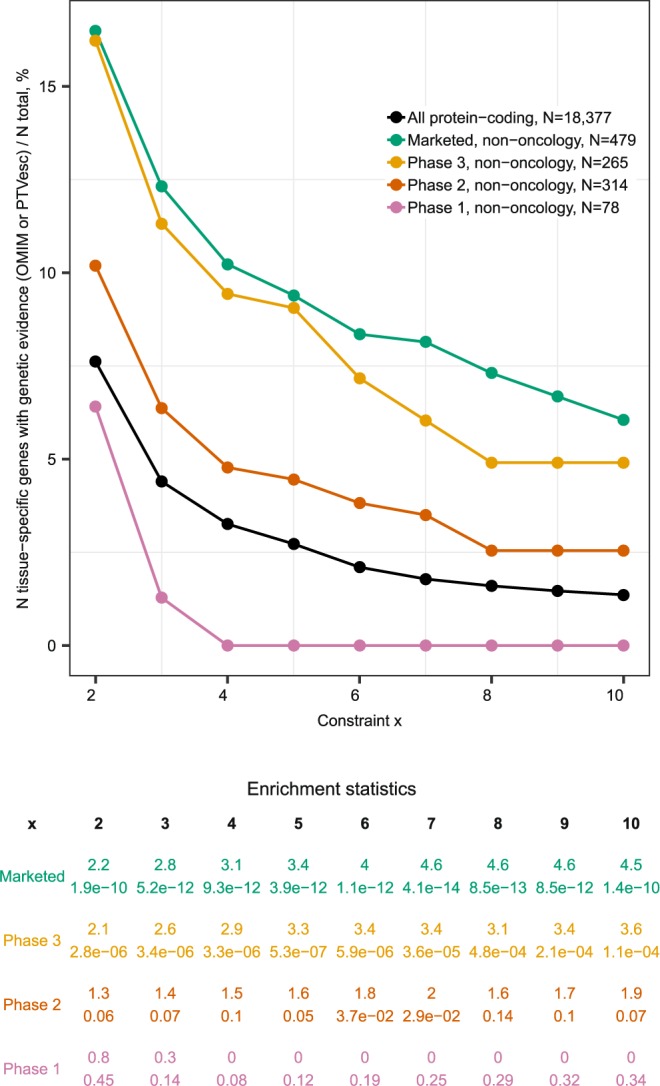
Tissue-specific genes are believed to be good drug targets due to improved safety. Here we show that this intuitive notion is not reflected in phase 1 and 2 clinical trials, despite the historic success of tissue-specific targets and their 2.3-fold overrepresentation among targets of marketed non-oncology drugs. We compare properties of tissue-specific genes and drug targets. We show that tissue-specificity of the target may also be related to efficacy of the drug. The relationship may be indirect (enrichment in Mendelian disease and PTVesc genes) or direct (elevated betweenness centrality scores for tissue-specifically produced enzymes and secreted proteins). Reduced evolutionary conservation of tissue-specific genes may represent a bottleneck for drug projects, prompting development of novel models with smaller evolutionary gap to humans. We show that the opportunities to identify tissue-specific drug targets are not exhausted and discuss potential use cases for tissue-specific genes in drug research.


Conflict of interest statement

M.R. is a contractor to AstraZeneca. M.H. is employed by AstraZeneca. AstraZeneca provided support to the authors in form of salaries, but had no role in conceptualization of the study, data collection, analysis, interpretation and writing. The authors receive no financial or non-financial reward for publication.

Figures

Figure 1
Figure 1
Tissue-specific genes were overrepresented among targets of phase 3 drugs and targets of marketed non-oncology drugs. Prevalence of tissue-specific genes among targets of drugs for (a) non-oncology and (b) oncology indications. Percentages of tissue-specific genes among targets of drugs in each phase of clinical development were plotted in comparison to the ‘background’ distribution among all protein coding-genes (black line). Tissue-specificity was defined at nine increasingly stringent constraints x = 2 to 10. (c) Fisher test p-value and fold enrichment for each gene category and each constraint x. Enrichment values >1 indicated over-representation of tissue-specific genes while values <1 indicated under-representation of tissue-specific genes. Nominal p-values < 0.05 were considered statistically significant.
Figure 2
Figure 2
Tissue-specific targets represented less frequently reused (a,b) and older (c) subsets of targets of marketed drugs. a Numbers and percentages of targets of marketed drugs that were targeted by candidate drugs in clinical trials, i.e., reused. (b) Number of candidate drugs per re-used target. (c) Year of regulatory approval by FDA or another agency of the first drugs modulating tissue-specific targets compared to non-tissue-specific targets of marketed drugs. For example, carglumic acid was the first marketed drug modulating CPS1 and it was approved in 2010.
Figure 3
Figure 3
Tissue-specific genes were less evolutionary conserved in mice compared to all protein-coding genes and drug targets. (a) Percentages of genes without 1-to-1 orthologs in mice. 1-to-1 ortholog refers to a human gene with one unique counterpart in mouse as opposed to 1-to-many or many-to-many orthologs that arise from duplication or gene fusion events. (b) Ka/Ks ratios for human-mouse 1-to-1 orthologs. (c) Sequence similarity of human protein-coding genes and their 1-to-1 orthologs in mice.
Figure 4
Figure 4
Tissue-specific genes were enriched in disease genes with potential gain-of-function mechanism but not loss-of-function mechanism. The bars show percentages of (a) OMIM, (b) PTVesc and (c) loss-of-function tolerant (ExAC pLI < = 0.1) and intolerant (pLI > = 0.9) genes in each gene category. Violin plots in (d) show loss-of-function tolerance as a continuous score according to the gnomAD consortium data. Higher values indicate higher tolerance to loss-of-function variation.
Figure 5
Figure 5
Tissue-specific genes (x = 6) that were not yet explored as targets of marketed or clinical trial drugs but were potentially druggable or had human genetic evidence. Dots indicate overlapping sets, while bars on the top indicate overlap size. For example, the fifth column indicates that 40 secreted proteins had known crystal structures and did not have other indications of druggability. Proteins classified as Tchem in the TCRD data base have potent compounds with binding affinities in the nanomolar (G-protein coupled receptors, nuclear hormone receptors, kinases) or lower micromolar range (ion channels and other target categories). Such chemical compounds can be optimized and transitioned to clinical trials. Secreted proteins may be amenable to antibody therapies. Other tissue-specific genes have some knowledge around them to start a chemical development program. Chemical compounds with binding activities in ChEMBL v23, possibly less potent than the criteria used to define Tchem, offer hints to infer structure-activity relationships, to discover and optimize a lead compound. Known crystal structure may be used to identify binding pockets and design binding molecules. Known drug targets in the same protein family may aid chemical discovery through sequence similarity and homology modelling.
Figure 6
Figure 6
Combining tissue-specificity with genetic evidence may represent an effective de-risking strategy for non-oncology drug targets. The graph shows prevalence of genes that are both tissue-specific at each x and have an OMIM Morbid Map entry or are PTVesc among drug targets compared to all protein-coding genes. The table below contains fold enrichment and p-values. Enrichment <1 indicates depletion in tissue-specific genes with human genetic evidence.

References

    1. Cook D, et al. Lessons learned from the fate of AstraZeneca’s drug pipeline: a five-dimensional framework. Nat Rev Drug Discov. 2014;13:419–431. doi: 10.1038/nrd4309. - DOI - PubMed
    1. Shih HP, Zhang X, Aronov AM. Drug discovery effectiveness from the standpoint of therapeutic mechanisms and indications. Nat Rev Drug Discov. 2018;17:19–33. doi: 10.1038/nrd.2017.194. - DOI - PubMed
    1. Bunnage ME. Getting pharmaceutical R&D back on target. Nat Chem Biol. 2011;7:335–339. doi: 10.1038/nchembio.581. - DOI - PubMed
    1. Oprea TI, et al. Unexplored therapeutic opportunities in the human genome. Nat Rev Drug Discov. 2018;17:317–332. doi: 10.1038/nrd.2018.14. - DOI - PMC - PubMed
    1. Debouck C, Goodfellow PN. DNA microarrays in drug discovery and development. Nat Genet. 1999;21:48–50. doi: 10.1038/4475. - DOI - PubMed

Publication types

MeSH terms