

Performance characteristics of silicon photomultiplier based 15-cm AFOV TOF PET/CT
- PMID: 31076884
- PMCID: PMC6510743
- DOI: 10.1186/s40658-019-0244-0
Performance characteristics of silicon photomultiplier based 15-cm AFOV TOF PET/CT
Abstract
Background: This paper describes the National Electrical Manufacturers Association (NEMA) system performance of the Discovery MI 3-ring PET/CT (GE Healthcare) installed in Bruges, Belgium. This time-of-flight (TOF) PET camera is based on silicon photomultipliers instead of photomultiplier tubes.
Methods: The NEMA NU2-2012 standard was used to evaluate spatial resolution, sensitivity, image quality (IQ) and count rate curves of the system. Timing and energy resolution were determined.
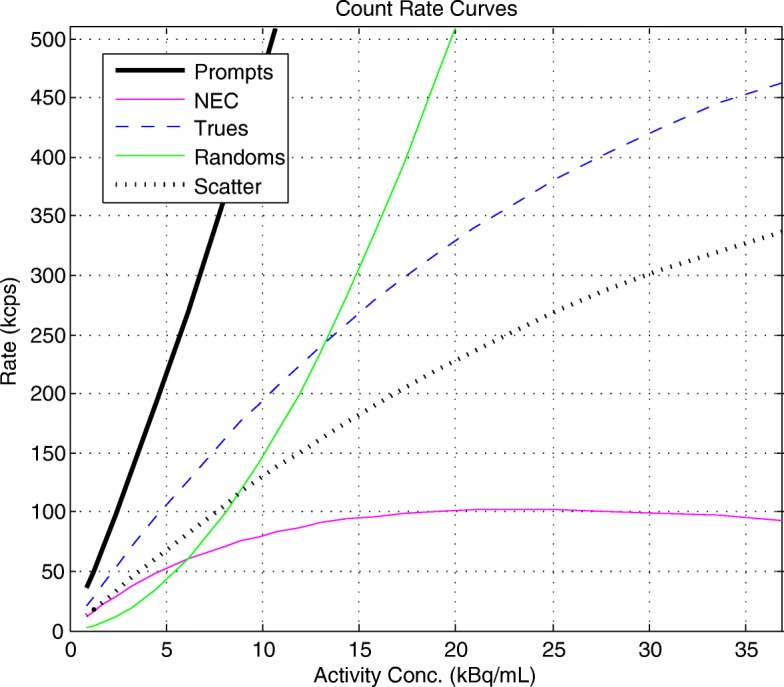
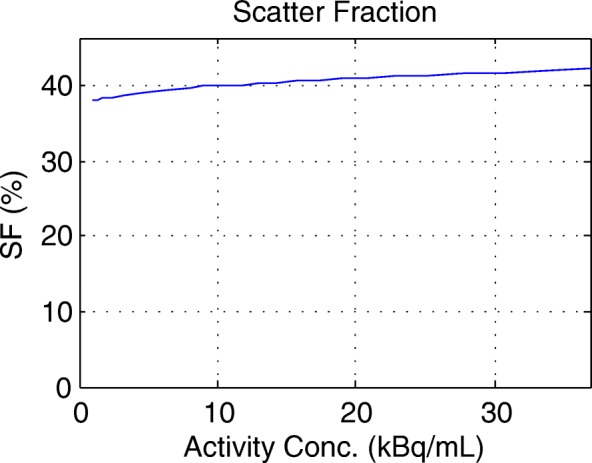
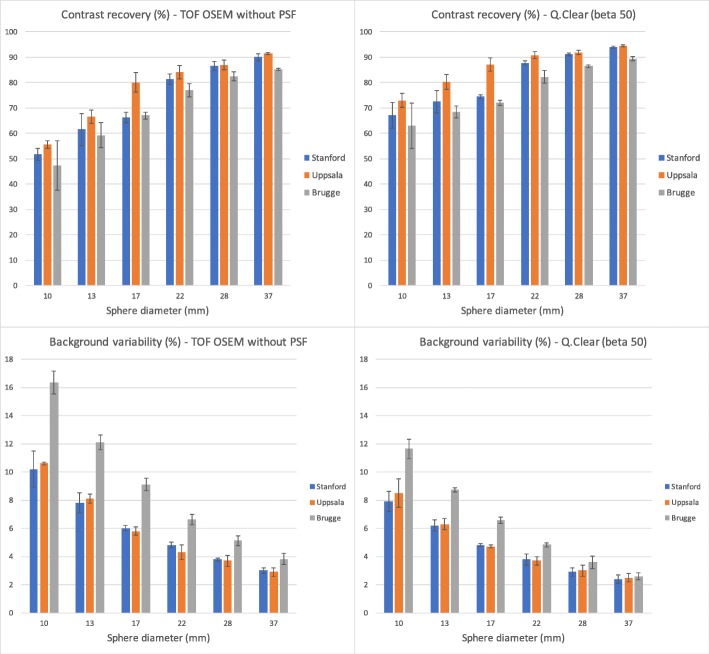
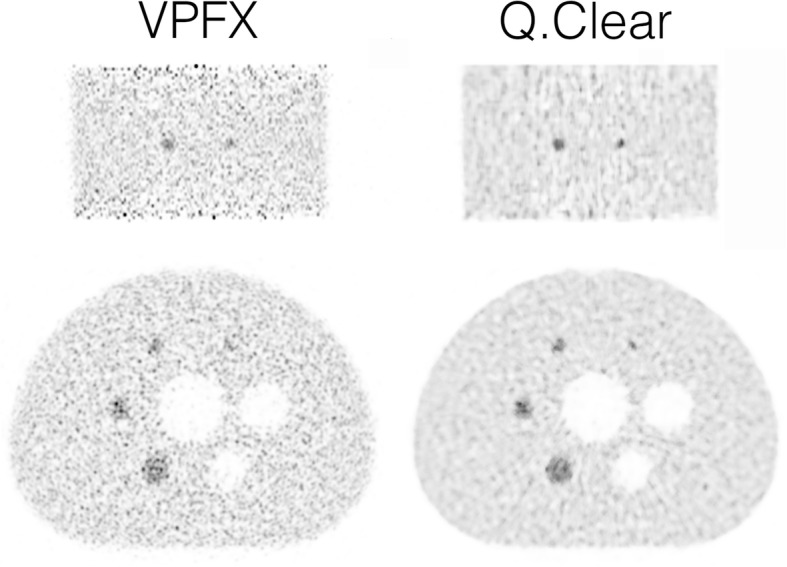
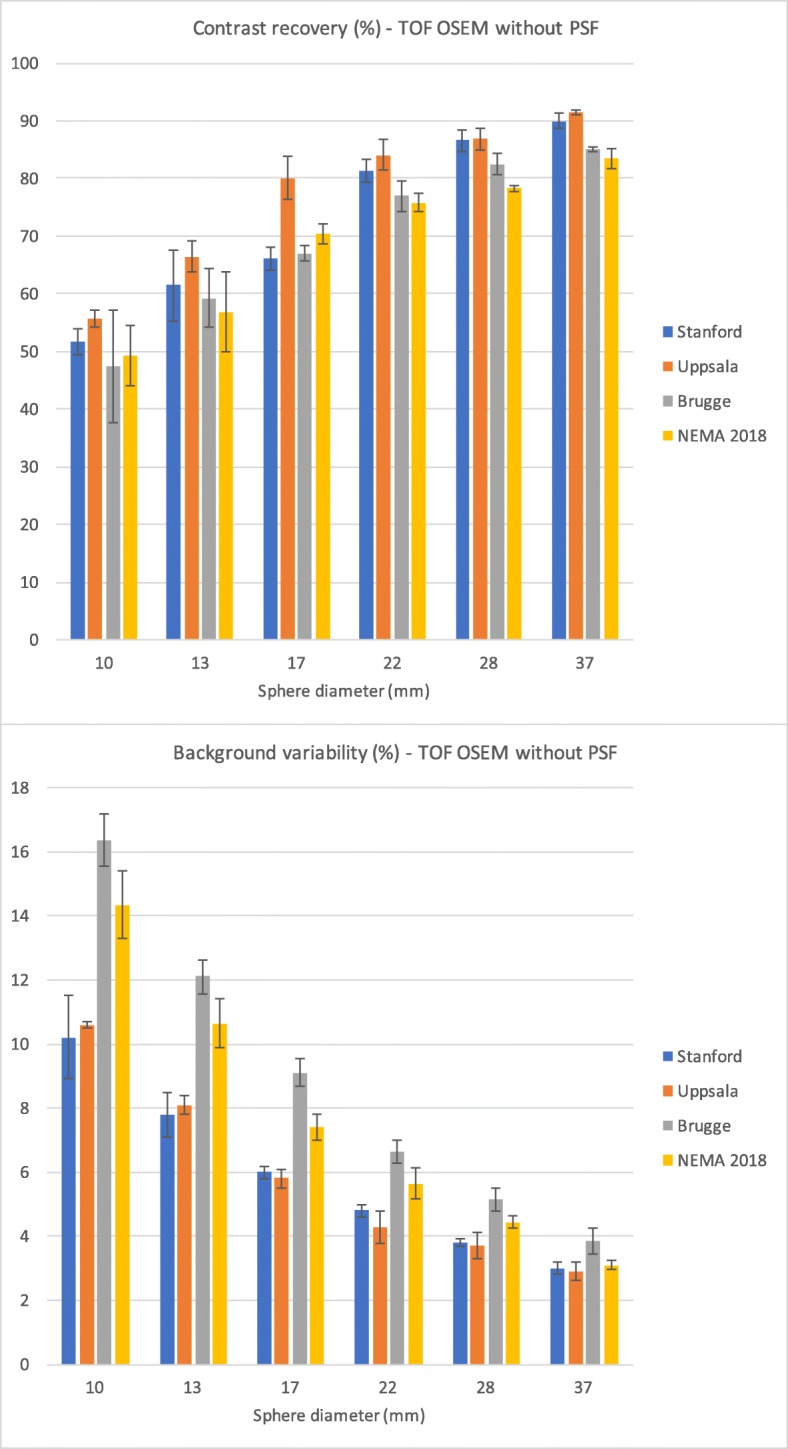
Results: Full width at half maximum (FWHM) of spatial resolution in radial, tangential and axial direction was 4.69, 4.08 and 4.68 mm at 1 cm; 5.58, 4.64 and 5.83 mm at 10 cm; and 7.53, 5.08 and 5.47 mm at 20 cm from the centre of the field of view (FOV) for the filtered backprojection reconstruction. For non-TOF ordered subset expectation maximization (OSEM) reconstruction without point spread function (PSF) correction, FWHM was 3.87, 3.69 and 4.15 mm at 1 cm; 4.80, 3.81 and 4.87 mm at 10 cm; and 7.38, 4.16 and 3.98 mm at 20 cm. Sensitivity was 7.258 cps/kBq at the centre of the FOV and 7.117 cps/kBq at 10-cm radial offset. Contrast recovery (CR) using the IQ phantom for the TOF OSEM reconstruction without PSF correction was 47.4, 59.3, 67.0 and 77.0% for the 10-, 13-, 17- and 22-mm radioactive spheres and 82.5 and 85.1% for the 28- and 37-mm non-radioactive spheres. Background variability (BV) was 16.4, 12.1, 9.1, 6.6, 5.1 and 3.8% for the 10-, 13-, 17-, 22-, 28- and 37-mm spheres. Lung error was 8.5%. Peak noise equivalent count rate (NECR) was 102.3 kcps at 23.0 kBq/ml with a scatter fraction of 41.2%. Maximum accuracy error was 3.88%. Coincidence timing resolution was 375.6 ps FWHM. Energy resolution was 9.3% FWHM. Q.Clear reconstruction significantly improved CR and reduced BV compared with OSEM.
Conclusion: System sensitivity and NECR are lower and IQ phantom's BV is higher compared with larger axial FOV (AFOV) scanners like the 4-ring discovery MI, as expected from the smaller solid angle of the 3-ring system. The other NEMA performance parameters are all comparable with those of the larger AFOV scanners.
Keywords: Discovery MI 3-ring; NEMA; Silicon photomultiplier based PET/CT; Time-of-flight PET/CT.
Conflict of interest statement
Authors’ information
DV, MSc, is an expert in medical radiation physics from the department of Nuclear Medicine, Algemeen Ziekenhuis Sint-Jan, Bruges, Belgium.
JU, PhD, is PET calibrations and performance Senior Architect at GE, Waukesha, WI, USA.
HB, MSc, is Zone Clinical Leader PET/CT at GE, Diegem, Belgium.
FDG, MD, PhD, is head of the department of Nuclear Medicine, Algemeen Ziekenhuis Sint-Jan, Bruges, Belgium.
Ethics approval and consent to participate
Not applicable.
Consent for publication
Not applicable.
Competing interests
FDG received speaker’s fee from the General Electric Company. JU and HB work for the General Electric Company. The other author declares no conflict of interest.
Publisher’s Note
Springer Nature remains neutral with regard to jurisdictional claims in published maps and institutional affiliations.
Figures


References
-
- National Electrical Manufacturers Association . NEMA NU-2-2012 performance measurement of positron emission tomographs. Rosslyn: National Electrical Manufacturers Association; 2013.
LinkOut - more resources
Full Text Sources
