Clinical Trial
. 2019 Oct;16(4):1167-1182.
doi: 10.1007/s13311-019-00735-2.

Biomarker Identification, Safety, and Efficacy of High-Dose Antioxidants for Adrenomyeloneuropathy: a Phase II Pilot Study

Affiliations
Clinical Trial

Biomarker Identification, Safety, and Efficacy of High-Dose Antioxidants for Adrenomyeloneuropathy: a Phase II Pilot Study

Carlos Casasnovas et al. Neurotherapeutics. 2019 Oct.

Abstract

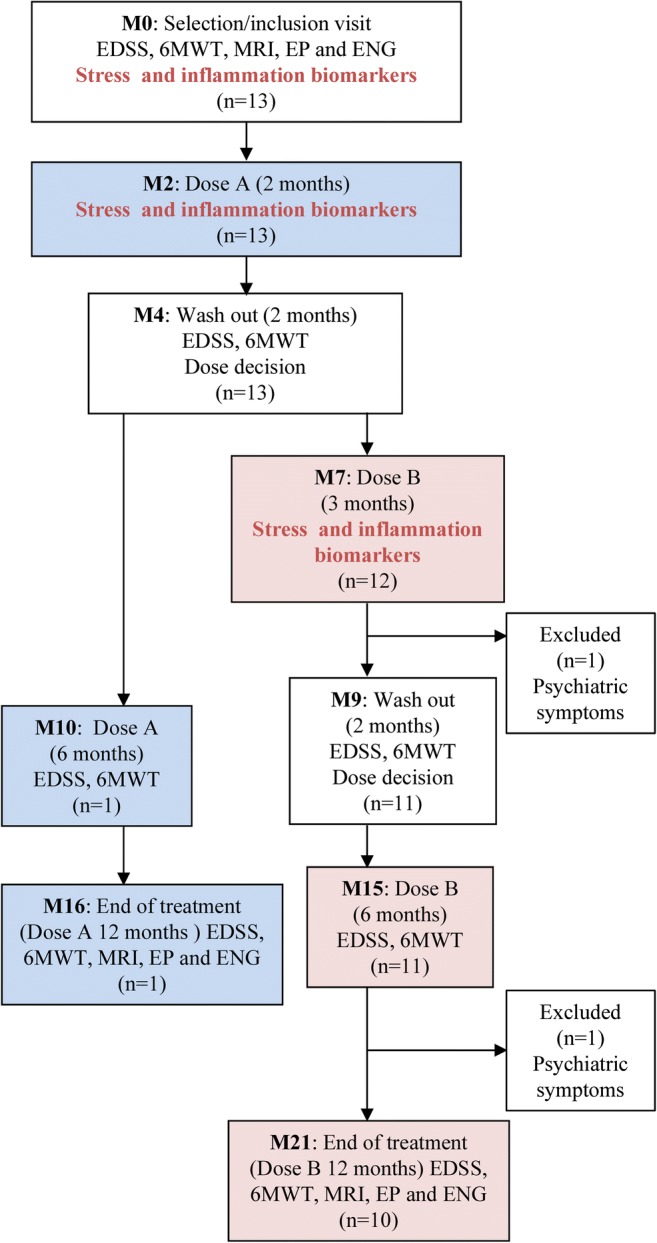
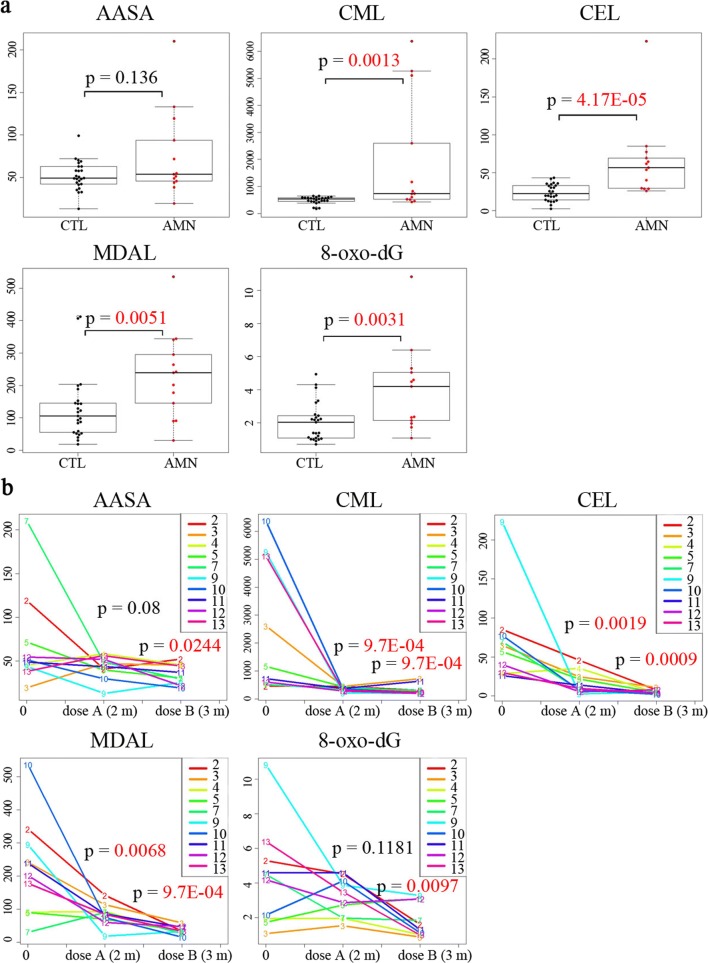
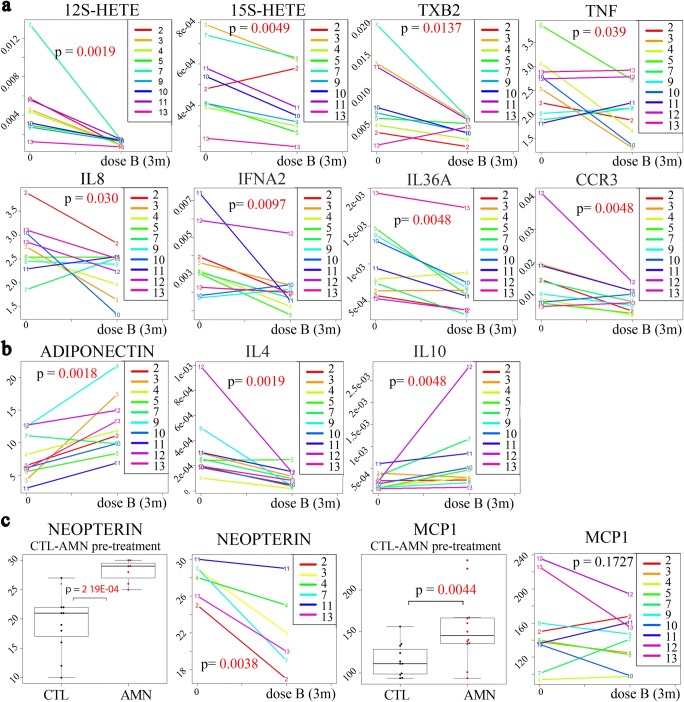
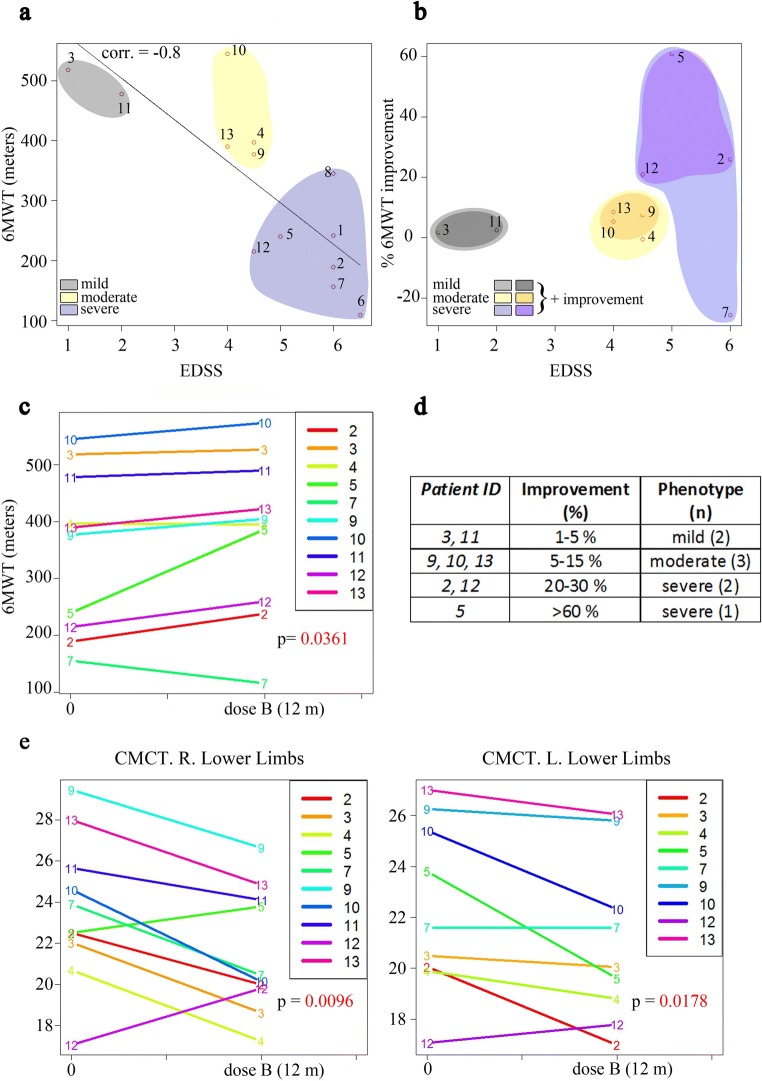
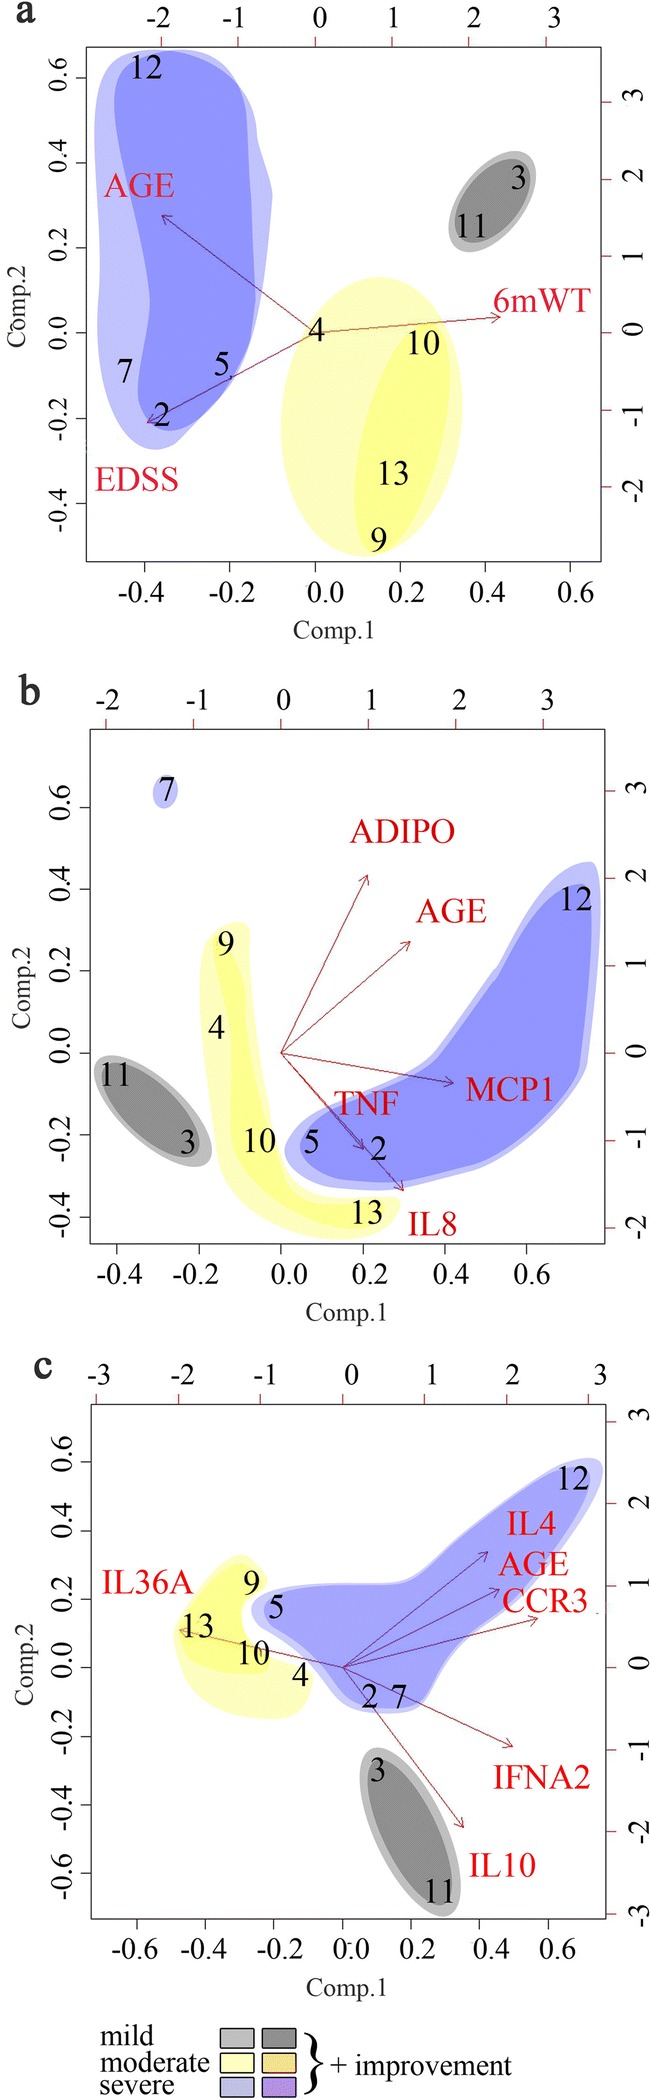
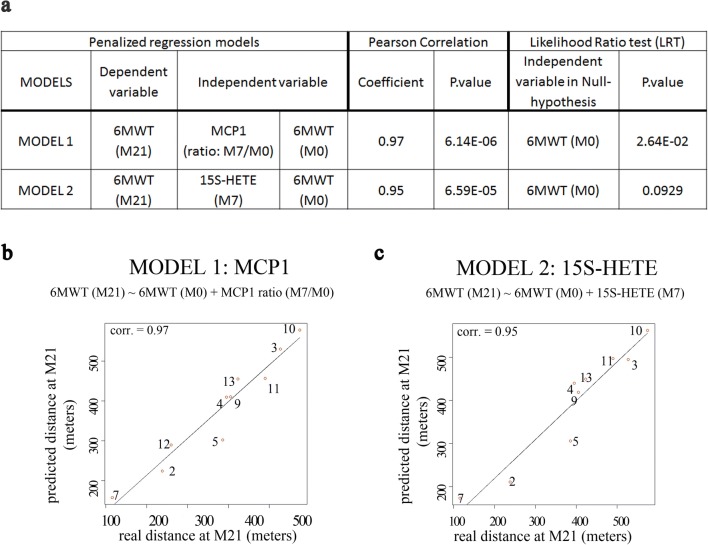
X-Adrenoleukodystrophy (X-ALD) and its adult-onset, most prevalent variant adrenomyeloneuropathy (AMN) are caused by mutations in the peroxisomal transporter of the very long-chain fatty acid ABCD1. AMN patients classically present spastic paraparesis that can progress over decades, and a satisfactory treatment is currently lacking. Oxidative stress is an early culprit in X-ALD pathogenesis. A combination of antioxidants halts the clinical progression and axonal damage in a murine model of AMN, providing a strong rationale for clinical translation. In this phase II pilot, open-label study, 13 subjects with AMN were administered a high dose of α-tocopherol, N-acetylcysteine, and α-lipoic acid in combination. The primary outcome was the validation of a set of biomarkers for monitoring the biological effects of this and future treatments. Functional clinical scales, the 6-minute walk test (6MWT), electrophysiological studies, and cerebral MRI served as secondary outcomes. Most biomarkers of oxidative damage and inflammation were normalized upon treatment, indicating an interlinked redox and inflammatory homeostasis. Two of the inflammatory markers, MCP1 and 15-HETE, were predictive of the response to treatment. We also observed a significant decrease in central motor conduction time, together with an improvement or stabilization of the 6MWT in 8/10 subjects. This study provides a series of biomarkers that are useful to monitor redox and pro-inflammatory target engagement in future trials, together with candidate biomarkers that may serve for patient stratification and disease progression, which merit replication in future clinical trials. Moreover, the clinical results suggest a positive signal for extending these studies to phase III randomized, placebo-controlled, longer-term trials with the actual identified dose. ClinicalTrials.gov Identifier: NCT01495260.

Keywords: Adrenomyeloneuropathy; antioxidants; biomarkers; inflammation.; oxidative stress.


Figures

Fig. 1
Fig. 1
Trial profile. Patients initially received a lower oral dose A daily for 2 months (M2). After that, a 2-month washout period was introduced during which the biomarkers of protein oxidative damage were tested in plasma (M4). In patients showing normalization of biomarkers (patient 8), the treatment was restarted for 12 months at the same dose (M10, M16). In patients showing no normalization of oxidative damage biomarkers, the dosage was increased to dose B for 3 months (M7). After this treatment period, the biomarkers were tested again during a new washout period of 2 months (M9). If normalization of the levels was attained with dose B, the treatment was restarted for 12 more months with the higher dose (M15, M21). In the eventuality that protein oxidative damage biomarkers were not reduced, the patient would have been considered a nonresponder, and the treatment would have been discontinued at that point. This eventually did not apply to any of the patients. Blue boxes, patients taking dose A; pink boxes, patients taking dose B
Fig. 2
Fig. 2
Oxidative lesion markers and treatment effect in subjects. (a) Significant pretreatment increase in the oxidation markers CML, CEL, MDAL in the plasma, and 8-oxo-dG in the urine is observed in subjects compared with controls. Whiskers indicate 1.5 times the interquartile range; the bottom and top of the boxes indicate the first and third quartiles, respectively; the center lines of the boxes indicate the second quartile. (b) A significant decrease was observed in the plasma concentrations of the oxidation markers CML, CEL, and MDAL after 2 months with dose A (M2) and, more strikingly, after 3 months with dose B (M7) compared with pretreatment levels at the initial time point (M0). A significant decrease in AASA in plasma and urine 8-oxo-dG levels was only observed after 3 months with dose B. P values are colored red if they are less than 0.05. AASA, CML, CEL, and MDAL are expressed as μmol/mol lysine; 8-oxo-dG is expressed as ng/mg creatine
Fig. 3
Fig. 3
Effects of the antioxidant treatment on inflammatory markers. (a) A significant decrease was observed in the pro-inflammatory markers 12S-HETE, 15S-HETE, TXB2, TNF, IL-8, IFNA2, IL-36A, and CCR3 after 3 months with dose B compared with pretreatment levels. (b) A significant increase was detected in the levels of the anti-inflammatory markers adiponectin and IL-10 after 3 months with dose B compared with pretreatment levels at the initial time point (time 0). The same treatment led to a significant decrease in IL-4 levels. (c) Significantly higher levels of neopterin in cerebrospinal fluid and MCP1 in plasma were observed in AMN patients before treatment, and neopterin levels exhibited a significant decrease after 3 months of treatment. Whiskers indicate 1.5 times the interquartile range; the bottom and top of the boxes indicate first and third quartiles, respectively; the center lines of the boxes indicate the second quartile. P values are colored red if they are less than 0.05. The 12S-HETE, 15S-HETE, and TXB2 in plasma and neopterin in cerebrospinal fluid are expressed as μmol/l; TNF, IL-8, and MCP1 in plasma are expressed as pg/ml; adiponectin in plasma is expressed as μg/ml; IFNA2, IL-36A, CCR3, IL-4, and IL-10 are expressed as the relative gene expression in PBMCs
Fig. 4
Fig. 4
Effects of treatment on the 6-minute walk test (6MWT) and on motor evoked potentials. (a) The correlation between the 6MWT and EDSS before treatment at the initial time point. (b) The correlation between the 6MWT and EDSS at the end of treatment. In (a) and (b), the colors represent the 3 different phenotypes: mild in gray, moderate in yellow, and severe in blue. Subjects with an improvement are represented by darker colors. The correlation was measured using Pearson’s product moment correlation coefficient test. (c) Significant improvements were observed in the distance walked in the last visit compared with the pretreatment distances. Eight subjects improved in the distance walked, 1 showed no change and 1 worsened. (d) The percentage of improvement of subjects in the 6MWT is indicated. Only subjects with amelioration of their scores are listed. n = number of cases of each phenotype. (e) A significant decrease was observed in central motor conduction time (CMCT) in both legs in the last visit in comparison with baseline. R = right; L = left. P values are colored in red if they are less than 0.05. CMCT is the difference between the shortest peripheral motor and the shortest corticomotor latencies
Fig. 5
Fig. 5
Stratification of patients by integrating biomarkers with clinical variables. PCA was used to distribute patients with AMN according to their clinical phenotype severity (in (a)) and according to their pretreatment biomarker values (b, c). Loading plots: the axes for components 1 and 2 indicate the most varying direction of the data, and the arrows show the direction of the variables. Mild phenotypes are shown in gray, moderate phenotypes in yellow, and severe phenotypes in blue. Darker colors depict patients who improved clinically in the 6MWT after treatment. In (a), the clinical variables EDSS and 6MWT are shown in relation to age. In (b), the plasma levels of inflammatory molecules in relation to age are shown. The most severe phenotypes show higher levels of MCP1, TNF, and IL-8, except for patient 7. In (c), the expression of molecules and mediators of inflammation in PBMCs are shown. Patients 3 and 11, with milder phenotypes, showed higher levels of protective IL-10
Fig. 6
Fig. 6
Association of 15S-HETE and MCP1 with the 6MWT. (a) Penalized regression models showing the best clinical improvement predictors based on the final distance walked by the subjects after treatment. (b, c) Predicted distances versus the real distances at the end of the study for the MCP1 and 15S-HETE regression models, respectively, based on Pearson’s correlation. The numbers in circles indicate the patient code

References

    1. Moser AB, Fatemi A: Newborn Screening and Emerging Therapies for X-Linked Adrenoleukodystrophy. JAMA Neurol 2018:e. - PubMed
    1. Hettema EH, van Roermund CW, Distel B, van den Berg M, Vilela C, Rodrigues-Pousada C, Wanders RJ, Tabak HF. The ABC transporter proteins Pat1 and Pat2 are required for import of long-chain fatty acids into peroxisomes of Saccharomyces cerevisiae. Embo J. 1996;15:3813–3822. - PMC - PubMed
    1. van Roermund CW, Visser WF, Ijlst L, van Cruchten A, Boek M, Kulik W, Waterham HR, Wanders RJ. The human peroxisomal ABC half transporter ALDP functions as a homodimer and accepts acyl-CoA esters. Faseb J. 2008;22:4201–4208. - PubMed
    1. Raymond GV, Moser AB, Fatemi A. GeneReviews®: X-Linked Adrenoleukodystrophy (updated 2018 Feb 15) Seattle (WA): University of Washington, Seattle; 1993. - PubMed
    1. Engelen M, Kemp S, Poll-The BT. X-linked adrenoleukodystrophy: pathogenesis and treatment. Curr Neurol Neurosci Rep. 2014;14:486. - PubMed

Publication types

MeSH terms

Associated data