

Mapping the medical outcomes study HIV health survey (MOS-HIV) to the EuroQoL 5 Dimension (EQ-5D-3 L) utility index
- PMID: 31077251
- PMCID: PMC6511158
- DOI: 10.1186/s12955-019-1135-8
Mapping the medical outcomes study HIV health survey (MOS-HIV) to the EuroQoL 5 Dimension (EQ-5D-3 L) utility index
Abstract
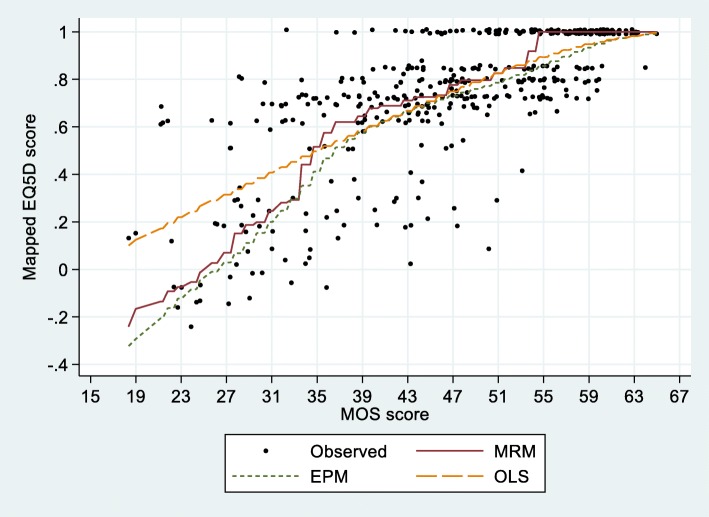
Background: Mapping of health-related quality-of-life measures to health utility values can facilitate cost-utility evaluation. Regression-based methods tend to lead to shrinkage of variance. This study aims to map the Medical Outcomes Study HIV Health Survey (MOS-HIV) to EuroQoL 5 Dimensions (EQ-5D-3 L) utility index, and to characterize the performance of three mapping methods, including ordinary least squares (OLS), equi-percentile method (EPM), and a recently proposed method called Mean Rank Method (MRM).
Methods: This is a secondary analysis of data from a randomized HIV treatment trial. Baseline data from 421 participants were used to develop mapping functions. Follow-up data from 236 participants was used to validate the mapping functions.
Results: In the training dataset, MRM and OLS, but not EPM, reproduced the observed mean utility (0.731). MRM, OLS and EPM under-estimated the standard deviation by 0.3, 26.6 and 1.7%, respectively. MRM had the lowest mean absolute error (0.143) and highest intraclass correlation coefficient (0.723) with the observed utility values, whereas OLS had the lowest mean squared error (0.038) and highest R-squared (0.542). Regressing the MRM- and OLS-mapped utility values upon body mass index and log-viral load gave covariate associations comparable to those estimated from the observed utility data (all P > 0.10). EPM did not achieve this property. Findings from the validation data were similar.
Conclusions: Functions are available for mapping the MOS-HIV to the EQ-5D-3 L utility values. MRM and OLS were comparable in terms of agreement with the observed utility values at the individual level. MRM had better performance at the group level in terms of describing the utility distribution.
Trial registration: NCT00988039 . Registered 30 September 2009.
Keywords: EQ-5D; Health utility; Mapping; Medical outcomes study HIV health survey.
Conflict of interest statement
Ethics approval and consent to participate
This secondary analysis was approved by the National University of Singapore Institutional Review Board (S-17-017E). The trial protocol was approved by ethics committees in all participating countries and by the research ethics committee of the University College London, UK.
Informed consent was obtained from all individual participants or their caregivers, in the case of participants less than 18 years of age, included in the study. Patients below 18 years of age also gave assent.
Consent for publication
Not applicable.
Competing interests
All authors declare that they have no competing interests.
Publisher’s Note
Springer Nature remains neutral with regard to jurisdictional claims in published maps and institutional affiliations.
Figures
References
-
- Drummond MF, Sculpher MJ, Claxton K, et al. Methods for the Economic Evaluation of Health Care Programmes: Oxford University Press. 2015.
Publication types
MeSH terms
Associated data
Grants and funding
LinkOut - more resources
Full Text Sources
Medical
