

Comparison of pharmacokinetics and the exposure-response relationship of dapagliflozin between adolescent/young adult and adult patients with type 1 diabetes mellitus
- PMID: 31077437
- PMCID: PMC6624399
- DOI: 10.1111/bcp.13981
Comparison of pharmacokinetics and the exposure-response relationship of dapagliflozin between adolescent/young adult and adult patients with type 1 diabetes mellitus
Abstract
Aims: To quantitatively compare pharmacokinetics (PK) and the exposure-response (ER) relationship of the sodium-glucose cotransporter-2 inhibitor, dapagliflozin, between adolescents/young adults and adults with type 1 diabetes mellitus (T1DM).
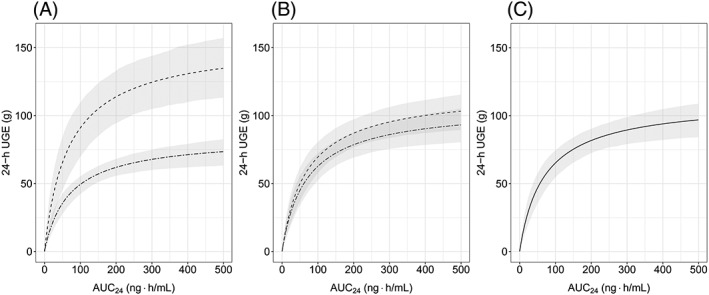
Methods: Data from 2 clinical studies for dapagliflozin were analysed using a non-linear mixed-effects approach. The PK and the relationship between dapagliflozin exposure and response (24-hour urinary glucose excretion) were characterized. PK was evaluated using a 2-compartment model with first-order absorption while the exposure response-relationship was analysed using a sigmoidal maximal-effect model. The 24-hour median blood glucose, estimated glomerular filtration rate (eGFR), sex, age and body weight were evaluated as covariates.
Results: A 2-compartment model with first order absorption provided a reasonable fit to the dapagliflozin PK data. Body weight was found to be a significant covariate on dapagliflozin exposure. The ER relationship was best described by a sigmoidal maximal effect model with 24-hour median blood glucose and eGFR as significant covariates on maximal effect. In accordance with the observed data, model-predicted urinary glucose excretion response following 10 mg dapagliflozin dose was higher in the study in adolescents/young adults (138.0 g/24 h) compared to adults (70.5 g/24 h) with T1DM. This is linked to higher eGFR and 24-hour median blood glucose in this trial.
Conclusions: Dapagliflozin PK and ER relationship were similar in the 2 analysed studies after accounting for covariate effects. These results suggest that no dose adjustment is required for adolescent patients with T1DM.
Keywords: covariates; dapagliflozin; exposure-response; paediatric; pharmacokinetics; type 1 diabetes mellitus.
© 2019 The British Pharmacological Society.
Conflict of interest statement
D.B. was an employee of AstraZeneca at the time of drafting this manuscript. J.P., D.W.B., W.T. and M.F.S. are employees/shareholders of AstraZeneca. T.D. has acted as consultant, advisory board member, steering committee member or speaker for Abbott, Medtronic, Roche, Lexicon, Menarini, Boehringer Ingelheim, AstraZeneca, Novo Nordisk, Sanofi, Dexcom and Eli Lilly, and has received research grants from Abbott, AstraZeneca, Novo Nordisk, Medtronic and Sanofi. V.S. is a contractor of AstraZeneca. NCT02325206 was financially supported by AstraZeneca. T.B. received travel support from AstraZeneca and received honoraria from Medtronic, DexCom, YpsoMed and Roche.
Figures


References
-
- Miller KM, Foster NC, Beck RW, et al. Current state of type 1 diabetes treatment in the U.S.: updated data from the T1D exchange clinic registry. Diabetes Care. 2015;38(6):971–978. - PubMed
-
- Farxiga [Prescribing Information]. Wilmington, DE, USA: AstraZeneca/Bristol Myers Squibb.
Publication types
MeSH terms
Substances
LinkOut - more resources
Full Text Sources
Medical
Research Materials
Miscellaneous
