. 2019 Jun;9(6):1153-1170.
doi: 10.1002/2211-5463.12654. Epub 2019 May 29.

Evaluation of critical design parameters for RT-qPCR-based analysis of multiple dUTPase isoform genes in mice

Affiliations

Evaluation of critical design parameters for RT-qPCR-based analysis of multiple dUTPase isoform genes in mice

Gergely A Rácz et al. FEBS Open Bio. 2019 Jun.

Abstract

The coupling of nucleotide biosynthesis and genome integrity plays an important role in ensuring faithful maintenance and transmission of genetic information. The enzyme dUTPase is a prime example of such coupling, as it generates dUMP for thymidylate biosynthesis and removes dUTP for synthesis of uracil-free DNA. Despite its significant role, the expression patterns of dUTPase isoforms in animals have not yet been described. Here, we developed a detailed optimization procedure for RT-qPCR-based isoform-specific analysis of dUTPase expression levels in various organs of adult mice. Primer design, optimal annealing temperature, and primer concentrations were specified for both nuclear and mitochondrial dUTPase isoforms, as well as two commonly used reference genes, GAPDH and PPIA. The linear range of the RNA concentration for the reverse transcription reaction was determined. The PCR efficiencies were calculated using serial dilutions of cDNA. Our data indicate that organs involved in lymphocyte production, as well as reproductive organs, are characterized by high levels of expression of the nuclear dUTPase isoform. On the other hand, we observed that expression of the mitochondrial dUTPase isoform is considerably increased in heart, kidney, and ovary. Despite the differences in expression levels among the various organs, we also found that the mitochondrial dUTPase isoform shows a much more uniform expression pattern as compared to the reference genes GAPDH and PPIA.

Keywords: RT-qPCR optimization; dUTPase; isoform-specific expression levels; mitochondrial dUTPase isoform; mouse organs; nuclear dUTPase isoform.


Conflict of interest statement

The authors declare no conflict of interest.

Figures
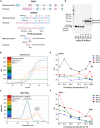
Figure 1
Figure 1
Selection of primers. (A) On the top, genomic sequences of both nuclear and mitochondrial isoforms are shown. Exons are indicated with Roman numerals in rectangles and shown with alternating blue and pink colors; introns are simplified as lines (for longer introns, lines are broken). In the middle, schematic illustration of primer candidates for amplification of both isoforms—after reverse transcription—of the Dut transcript is depicted. Exons are numbered and shown with alternating blue and pink colors. Common part of the sequence where the reverse primers are located is enlarged. All primers are indicated with arrows. On the bottom, PCR products amplified with the Rev1 reverse and the appropriate forward primers for both isoforms are shown. (B) Amplification curves for the mitochondrial isoform with the Rev1 reverse primer performed at a range of annealing temperatures from 53.1 to 69 °C using a gradient thermal block. RFU, relative fluorescence unit. (C) Melting curve analysis of the PCR products of the amplification introduced in panel B. (D) Agarose gel electrophoresis of the PCR products of the amplification introduced in panel B. The specific product is indicated with an arrow. (E) Quantification cycles (Cq) at a range of annealing temperature from 53.1 to 69 °C with all four reverse primer candidates for the mitochondrial isoform. The solid squares indicate specific products as determined with agarose gel electrophoresis and melting curve analysis. Open squares indicate aspecific products. (F) The same representation for the nuclear isoform as shown in panel E
Figure 2
Figure 2
Determination of the optimal common annealing temperature with thermal gradient for the PCR amplification of both isoforms of the Dut transcript, GAPDH, and PPIA. (A, B) Agarose gel electrophoresis of the PCR products for GAPDH (A) and PPIA (B) at a range of annealing temperature from 53.1 to 69 °C. The specific product is indicated with an arrow. (C) Quantification cycles (Cq) at a range of annealing temperatures from 53.1 to 69 °C for GAPDH and PPIA. (D) Agarose gel electrophoresis of the PCR products for both nuclear and mitochondrial isoforms with Rev1 reverse primer at a range of annealing temperature from 61.2 to 66 °C. The specific products are indicated with arrows. (E) Quantification cycles (Cq) at a range of annealing temperatures from 61.2 to 66 °C with the selected primers. The solid squares indicate specific products as determined with agarose gel electrophoresis and melting curve analysis. Open squares indicate aspecific products. (F, G) Melting curve analysis of the PCR products for the mitochondrial isoform with the selected Rev1 reverse primer at 65 °C (F) and 66 °C (G) for the determination of product specificity
Figure 3
Figure 3
Determination of the optimal primer concentrations using concentration gradient of primers for both isoforms of the Dut transcript. (A) Quantification cycles as a function of the concentration of both the forward and reverse primers for the amplification of the nuclear isoform. Decreasing Cq values are indicated with increasing color intensity. The selected concentration point is shown with dark green. The Cq axis is broken from 2 to 28. (B) The same representation for the mitochondrial isoform as shown in panel A. Orange bars indicate aspecific product formation. Amplification at the least concentrated point of both primers did not occur; thus, no associated Cq value is shown in the graph
Figure 4
Figure 4
Determination of the specificity of the PCR products for both isoforms. (A) Agarose gel electrophoresis for both isoforms from one and two rounds of PCR and GAPDH and PPIA. Asterisks (*) indicate products from the second round of PCR. The specific products are indicated with arrows. (B) Melting curve analysis for both isoforms from one and two rounds of PCR. Red indicates the nuclear isoform from the single‐round PCR; orange indicates the second round. Dark blue indicates the mitochondrial isoform from the single‐round PCR; light blue indicates the second round
Figure 5
Figure 5
Selection of an appropriate cDNA synthesis kit for the reverse transcription reaction and determination of the linear concentration range. (A–D) Comparison of Applied Biosystems (AB) and Bio‐Rad (BR) cDNA synthesis kits for the nuclear (A) and mitochondrial (B) isoform, GAPDH (C), and PPIA (D) using heart, ovary, and spleen RNA samples. Fourfold serial dilutions with a starting concentration of 800 nm RNA solutions were introduced to cDNA synthesis followed by qPCR analysis. The points are calculated as the mean of three technical replicates. Error bars show standard deviation. In the linear concentration range, weighted least‐squares linear regression was performed. Solid lines correspond to the Applied Biosystems kit, while dotted lines correspond to the Bio‐Rad kit. (E–H) Fourfold serial dilutions with a starting concentration of 800 nm RNA solutions using five RNA samples derived from different organs introduced to the Applied Biosystems cDNA synthesis kit followed by qPCR analysis for the nuclear (E) and mitochondrial (F) isoforms, GAPDH (G) and PPIA (H). The points are calculated as the mean of three technical replicates. Error bars show standard deviation. In the linear concentration range, weighted least‐squares linear regression was performed.
Figure 6
Figure 6
Evaluation of the amplification efficiency for both nuclear (A) and mitochondrial (B) isoforms of the Dut transcript, GAPDH (C), and PPIA (D). Fourfold serial dilutions of cDNA derived from 200 nm RNA solutions isolated from five different organs were subjected to qPCR measurement. All four technical replicates are shown, and weighted least‐squares linear regression was performed for each serial dilutions. In cases, where no amplification occurred for one or more technical replicates, all four values belonging to the concentration point were excluded from the analysis. For comparability of the slope of the fitted line, the range of the y‐axis on every graph is constant.
Figure 7
Figure 7
Evaluation of the method. (A, B) Amplification curves of male thymus (A) and male heart (B). Red color indicates the nuclear isoform, blue indicates the mitochondrial isoform, green indicates GAPDH, and brown indicates PPIA. Three biological replicates and three technical replicates for each biological replicate are shown for each graph. Threshold values are set to 500 RFU. RFU, relative fluorescent unit. (C–F) Relative quantity of gene expression of the nuclear isoform (C), the mitochondrial isoform (D), GAPDH (E) and PPIA (F) using ΔCq method. In each case, logarithmic scales are used and the relative quantity of gene expression of the biological group with the lowest expression was set to 1. The biological groups of the same organs are juxtaposed with the female sex first. Error bars show standard deviation

References

    1. Vértessy BG and Tóth J (2009) Keeping uracil out of DNA: physiological role, structure and catalytic mechanism of dUTPases. Acc Chem Res 42, 97–106. - PMC - PubMed
    1. Kerepesi C, Szabó JE, Papp‐Kádár V, Dobay O, Szabó D, Grolmusz V and Vértessy BG (2016) Life without dUTPase. Front Microbiol 7, 1768. - PMC - PubMed
    1. Dengg M, Garcia‐Muse T, Gill SG, Ashcroft N, Boulton SJ and Nilsen H (2006) Abrogation of the CLK‐2 checkpoint leads to tolerance to base‐excision repair intermediates. EMBO Rep 7, 1046–1051. - PMC - PubMed
    1. Kumar H, Kehrer J, Singer M, Reinig M, Santos JM, Mair GR and Frischknecht F (2019) Functional genetic evaluation of DNA house‐cleaning enzymes in the malaria parasite: dUTPase and Ap4AH are essential in Plasmodium berghei but ITPase and NDH are dispensable. Expert Opin Ther Targets 23, 251–261. - PubMed
    1. Muha V, Horváth A, Békési A, Pukáncsik M, Hodoscsek B, Merényi G, Róna G, Batki J, Kiss I, Jankovics F et al (2012) Uracil‐containing DNA in Drosophila: stability, stage‐specific accumulation, and developmental involvement. PLoS Genet 8, e1002738. - PMC - PubMed

Publication types

Associated data