

Biosensor-surface plasmon resonance: A strategy to help establish a new generation RNA-specific small molecules
- PMID: 31077819
- PMCID: PMC6756987
- DOI: 10.1016/j.ymeth.2019.05.005
Biosensor-surface plasmon resonance: A strategy to help establish a new generation RNA-specific small molecules
Abstract
Biosensor surface plasmon resonance (SPR) is a highly sensitive technique and is most commonly used to decipher the interactions of biological systems including proteins and nucleic acids. Throughout the years, there have been significant efforts to develop SPR assays for studying protein-protein interactions, protein-DNA interactions, as well as small molecules to target DNAs that are of therapeutic interest. With the explosion of discovery of new RNA structures and functions, it is time to review the applications of SPR to RNA interaction studies, which have actually extended over a long time period. The primary advantage of SPR is its ability to measure affinities and kinetics in real time, along with being a label-free technique and utilizing relatively small quantities of materials. Recently, developments that use SPR to analyze the interactions of different RNA sequences with proteins and small molecules demonstrate the versatility of SPR as a powerful method in the analysis of the structure-function relationships, not only for biological macromolecules but also for potential drug candidates. This chapter will guide the reader through some background material followed by an extensive assay development to dissect the interactions of small molecules and RNA sequences using SPR as the critical method. The protocol includes (i) fundamental concepts of SPR, (ii) experimental design and execution, (iii) the immobilization of RNA using the streptavidin-biotin capturing method, and (iv) affinities and kinetics analyses of the interactions using specific example samples. The chapter also contains useful notes to address situations that might arise during the process. This assay demonstrates SPR as a valuable quantitative method used in the search for potential therapeutic agents that selectively target RNA.
Keywords: Biosensors biacore SPR; Drug discovery; Heterocyclic amidines; RNA- ligand interactions; Small molecules.
Copyright © 2019 Elsevier Inc. All rights reserved.
Conflict of interest statement
Conflicts of interest
The authors declare no conflict of interest.
Figures
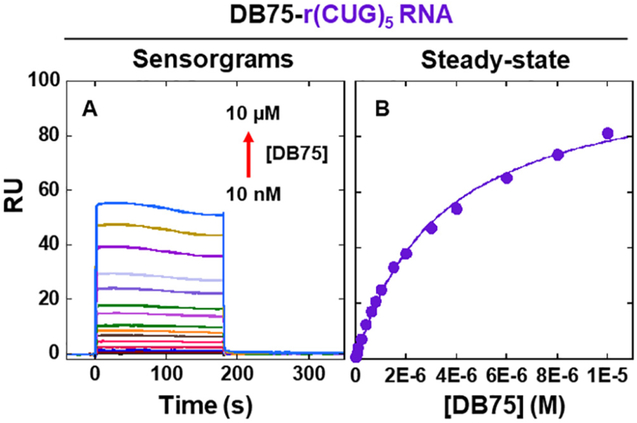
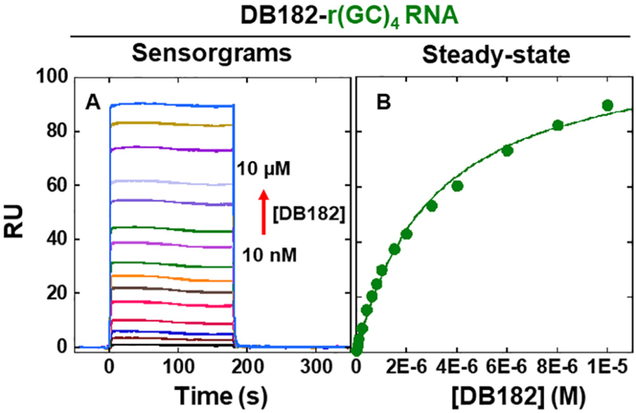
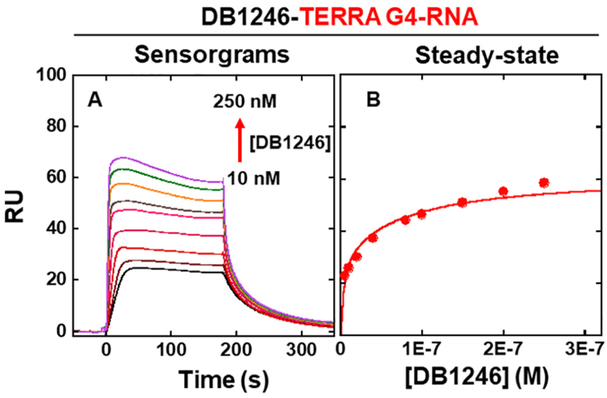
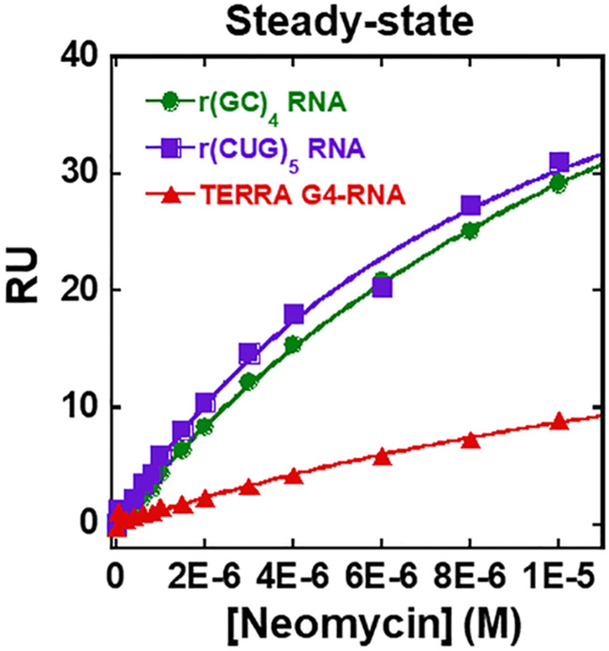
 ), with r(CUG)5 RNA (
 ) and with TERRA G4-RNA (
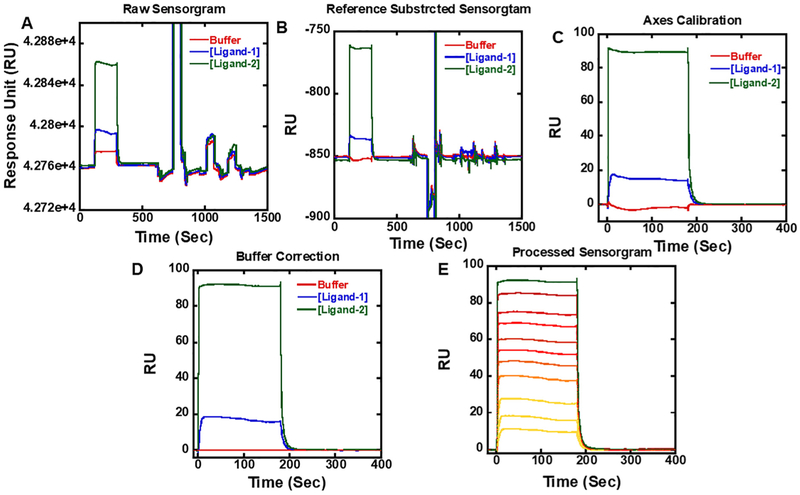
 ). Data were fitted with independent, identical binding site for r(GC)4 DNA KD = 16.2 ± 0.11 μm, N = 2 ± 1; r(CUG)5 RNA KD = 9.6 ± 1.2 μM, N = 3 ± 1; TERRA G4-DNA model KD = 22 ± 7.2 μM, N = 1 ± 1.
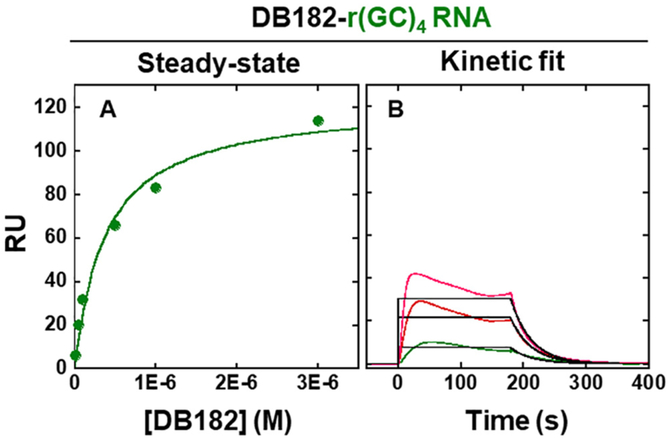
Similar articles
-
Protein-Ligand Interactions Using SPR Systems.Methods Mol Biol. 2013;1008:139-65. doi: 10.1007/978-1-62703-398-5_6. Methods Mol Biol. 2013. PMID: 23729252
-
Protein-Protein Interactions: Surface Plasmon Resonance.Methods Mol Biol. 2017;1615:257-275. doi: 10.1007/978-1-4939-7033-9_21. Methods Mol Biol. 2017. PMID: 28667619
-
Surface plasmon resonance investigation of RNA aptamer-RNA ligand interactions.Methods Mol Biol. 2011;764:279-300. doi: 10.1007/978-1-61779-188-8_19. Methods Mol Biol. 2011. PMID: 21748648
-
Biosensor-surface plasmon resonance: quantitative analysis of small molecule-nucleic acid interactions.Methods. 2007 Jun;42(2):150-61. doi: 10.1016/j.ymeth.2006.09.009. Methods. 2007. PMID: 17472897 Review.
-
Surface plasmon resonance spectroscopy for characterisation of membrane protein-ligand interactions and its potential for drug discovery.Biochim Biophys Acta. 2014 Jan;1838(1 Pt A):43-55. doi: 10.1016/j.bbamem.2013.04.028. Epub 2013 May 9. Biochim Biophys Acta. 2014. PMID: 23665295 Review.
Cited by
-
Giant Goos-Hänchen Shifts in Au-ITO-TMDCs-Graphene Heterostructure and Its Potential for High Performance Sensor.Sensors (Basel). 2020 Feb 14;20(4):1028. doi: 10.3390/s20041028. Sensors (Basel). 2020. PMID: 32075012 Free PMC article.
-
Zooming in on protein-RNA interactions: a multi-level workflow to identify interaction partners.Biochem Soc Trans. 2020 Aug 28;48(4):1529-1543. doi: 10.1042/BST20191059. Biochem Soc Trans. 2020. PMID: 32820806 Free PMC article. Review.
-
RNA-Ligand Interactions Quantified by Surface Plasmon Resonance with Reference Subtraction.Biochemistry. 2022 Aug 2;61(15):1625-1632. doi: 10.1021/acs.biochem.2c00177. Epub 2022 Jul 8. Biochemistry. 2022. PMID: 35802500 Free PMC article.
-
Machine learning-augmented molecular dynamics simulations (MD) reveal insights into the disconnect between affinity and activation of ZTP riboswitch ligands.bioRxiv [Preprint]. 2024 Sep 14:2024.09.13.612887. doi: 10.1101/2024.09.13.612887. bioRxiv. 2024. Update in: Angew Chem Int Ed Engl. 2025 Jul 28;64(31):e202505971. doi: 10.1002/anie.202505971. PMID: 39314358 Free PMC article. Updated. Preprint.
-
Quantitative Structure-Activity Relationship (QSAR) Study Predicts Small-Molecule Binding to RNA Structure.J Med Chem. 2022 May 26;65(10):7262-7277. doi: 10.1021/acs.jmedchem.2c00254. Epub 2022 May 6. J Med Chem. 2022. PMID: 35522972 Free PMC article.
References
-
- Fägerstam LG, Frostell-Karlsson A, Karlsson R, Persson B, Rӧnnberg I, Biospecific interaction analysis using surface plasmon resonance detection applied to kinetic, binding site and concentration analysis, J. Chromatogr. 597 (1-2) (1992) 397–410. - PubMed
-
- West ML, Ramsdale TE, Binding kinetics and bioassay of RRE mRNA fragments to a peptide containing the recognition domain of HIV-1 Rev, Biomed. Pept. Proteins Nucleic Acids 2 (3) (1996) 85–88. - PubMed
Publication types
MeSH terms
Substances
Grants and funding
LinkOut - more resources
Full Text Sources
Other Literature Sources
