

A comparison of resting state functional magnetic resonance imaging to invasive electrocortical stimulation for sensorimotor mapping in pediatric patients
- PMID: 31077983
- PMCID: PMC6514367
- DOI: 10.1016/j.nicl.2019.101850
A comparison of resting state functional magnetic resonance imaging to invasive electrocortical stimulation for sensorimotor mapping in pediatric patients
Abstract
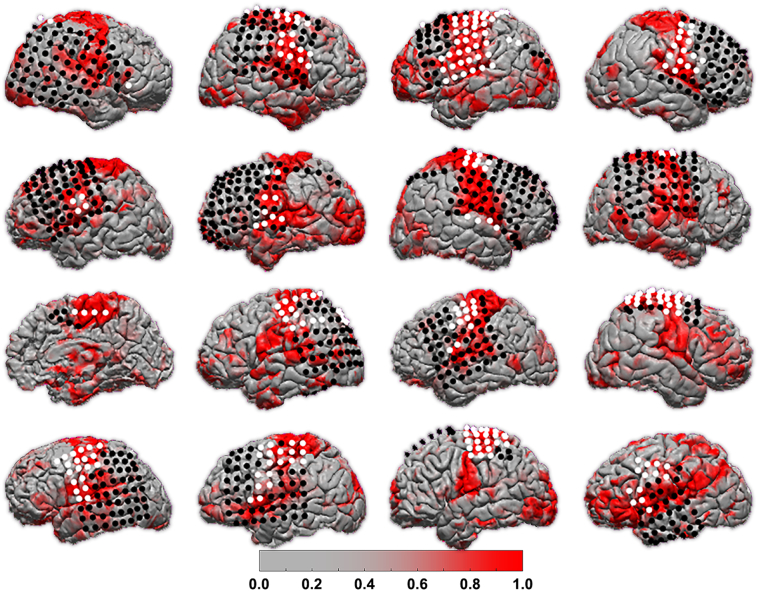
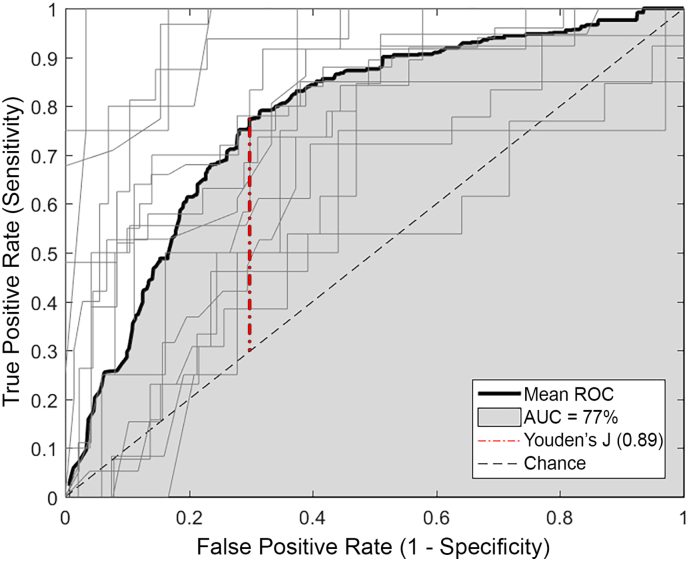
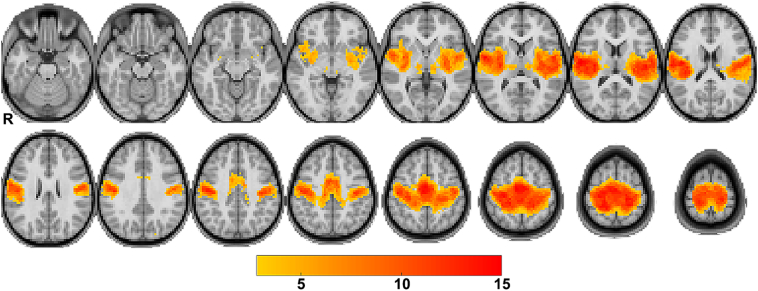
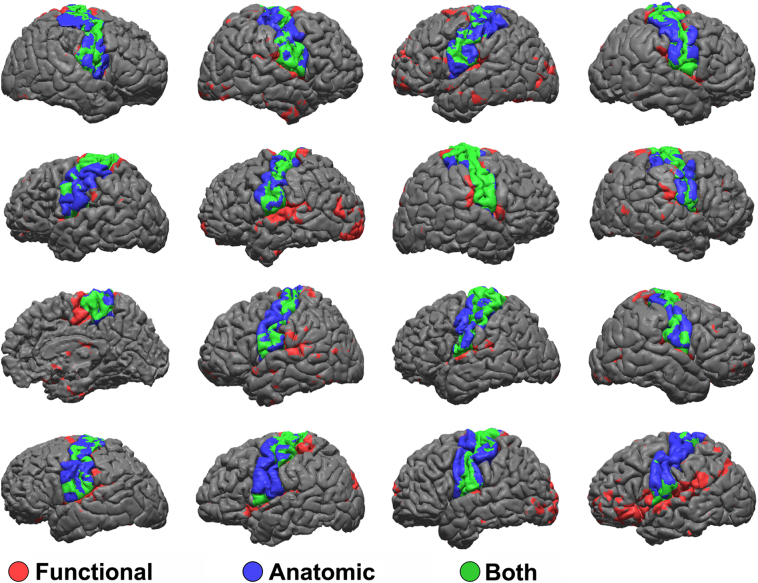
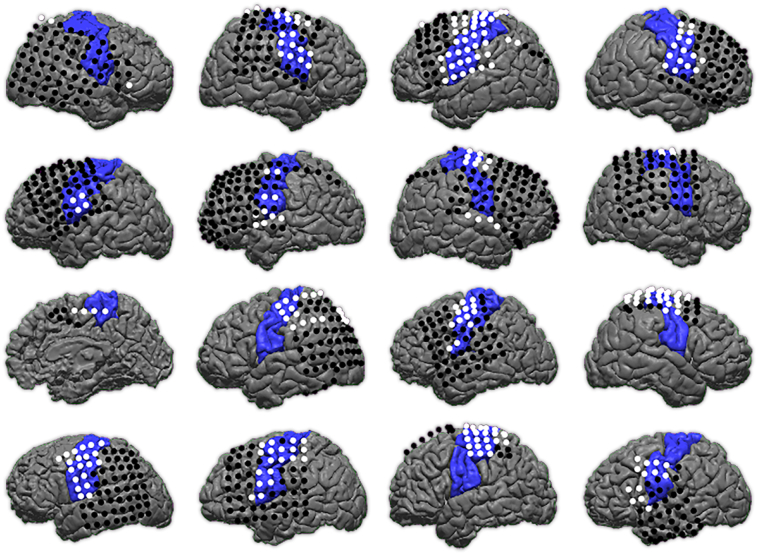
Localizing neurologic function within the brain remains a significant challenge in clinical neurosurgery. Invasive mapping with direct electrocortical stimulation currently is the clinical gold standard but is impractical in young or cognitively delayed patients who are unable to reliably perform tasks. Resting state functional magnetic resonance imaging non-invasively identifies resting state networks without the need for task performance, hence, is well suited to pediatric patients. We compared sensorimotor network localization by resting state fMRI to cortical stimulation sensory and motor mapping in 16 pediatric patients aged 3.1 to 18.6 years. All had medically refractory epilepsy that required invasive electrographic monitoring and stimulation mapping. The resting state fMRI data were analyzed using a previously trained machine learning classifier that has previously been evaluated in adults. We report comparable functional localization by resting state fMRI compared to stimulation mapping. These results provide strong evidence for the utility of resting state functional imaging in the localization of sensorimotor cortex across a wide range of pediatric patients.
Keywords: Functional MRI; Mapping; Neurosurgery; Pediatric; Resting state.
Copyright © 2019 The Author(s). Published by Elsevier Inc. All rights reserved.
Figures


References
-
- Borchers S., Himmelbach M., Logothetis N., Karnath H.-O. Direct electrical stimulation of human cortex — the gold standard for mapping brain functions? Nat. Rev. Neurosci. 2012;13:63–70. - PubMed
-
- Breshears J.D., Gaona C.M., Roland J.L., Sharma M., Bundy D.T., Shimony J.S., Rashid S., Eisenman L.N., Hogan R.E., Snyder A.Z., Leuthardt E.C. Mapping sensorimotor cortex with slow cortical potential resting-state networks while awake and under anesthesia. Neurosurgery. 2012;71:305–316. - PMC - PubMed
-
- Carter J.V., Pan J., Rai S.N., Galandiuk S. ROC-ing along: evaluation and interpretation of receiver operating characteristic curves. Surgery. 2016;159:1638–1645. - PubMed
-
- Corley J.A., Nazari P., Rossi V.J., Kim N.C., Fogg L.F., Hoeppner T.J., Stoub T.R., Byrne R.W. Cortical stimulation parameters for functional mapping. Seizure. 2017;45:36–41. - PubMed
-
- Dale A.M., Fischl B., Sereno M.I. Cortical surface-based analysis: I. segmentation and surface reconstruction. Neuroimage. 1999;9:179–194. - PubMed
