Review
. 2018;40(5-6):475-489.
doi: 10.1159/000498968. Epub 2019 May 10.

A Ferret Model of Encephalopathy of Prematurity

Affiliations
Review

A Ferret Model of Encephalopathy of Prematurity

Thomas Wood et al. Dev Neurosci. 2018.

Abstract

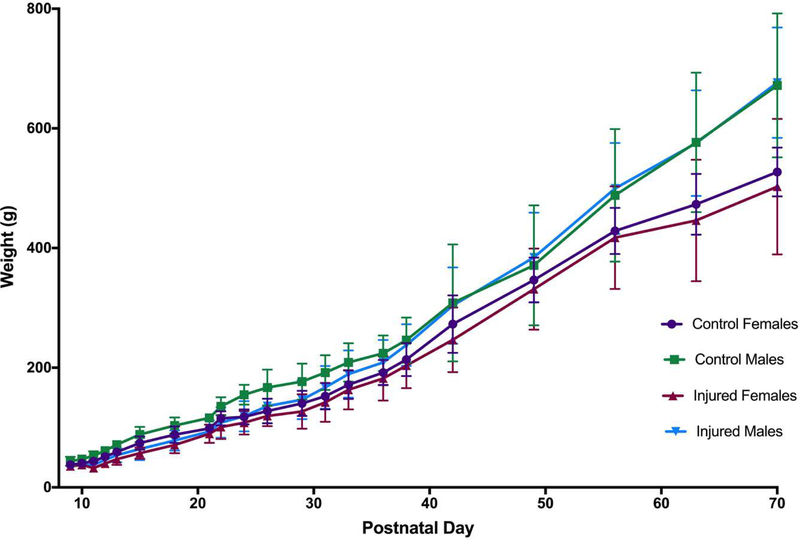
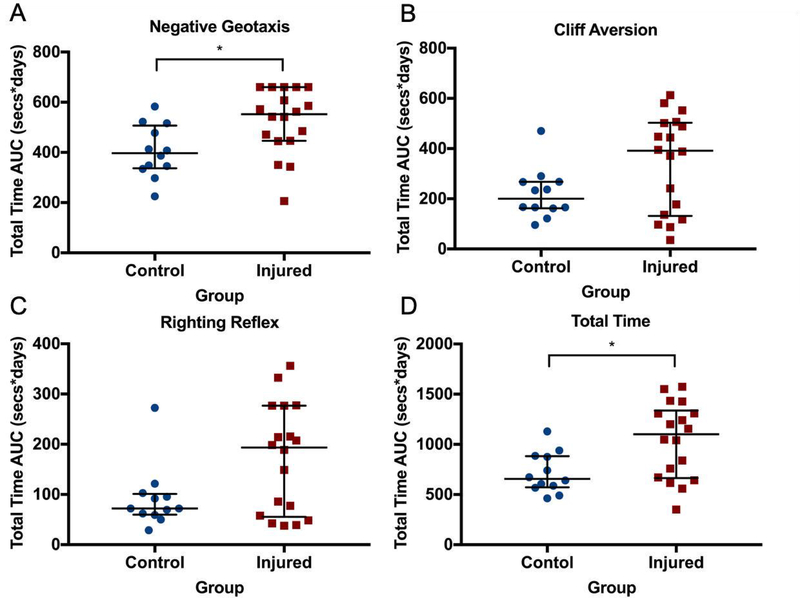
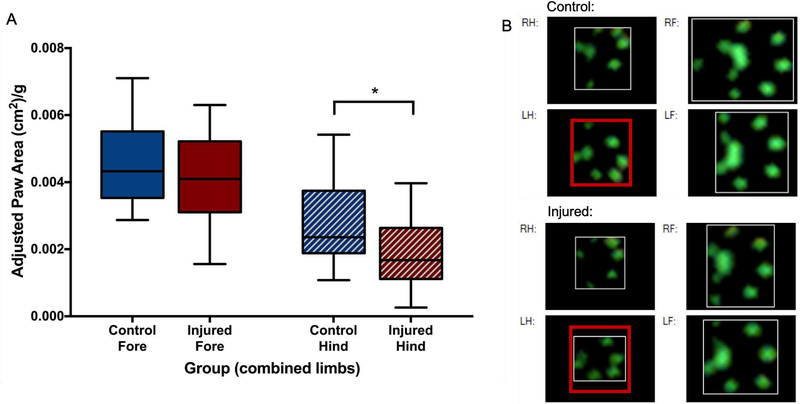
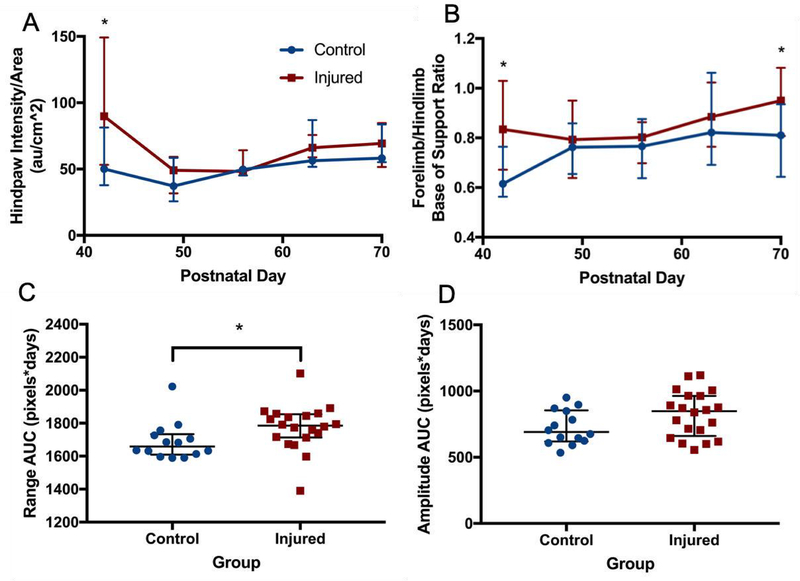
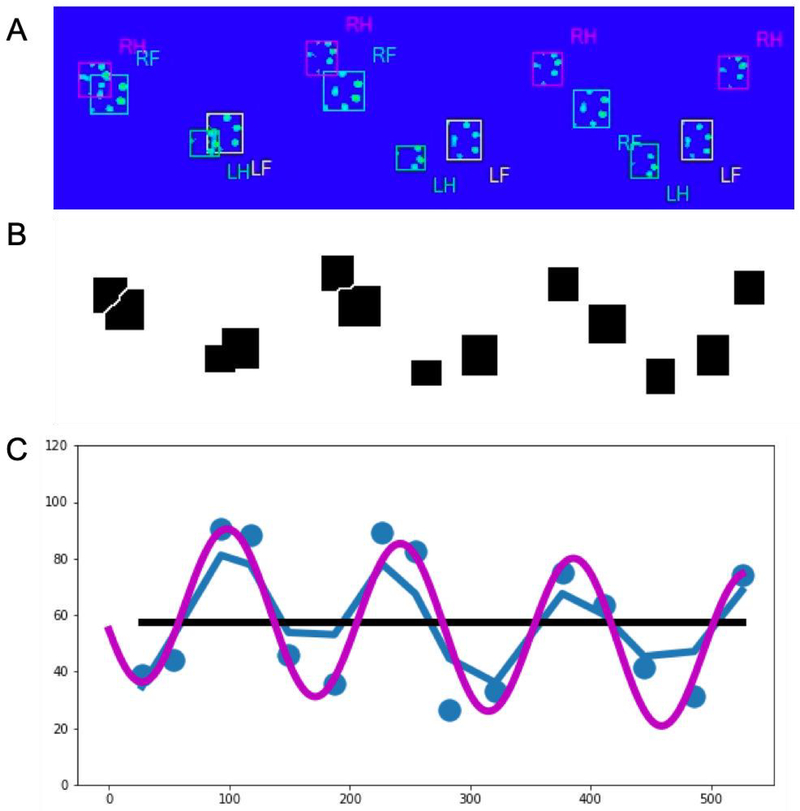
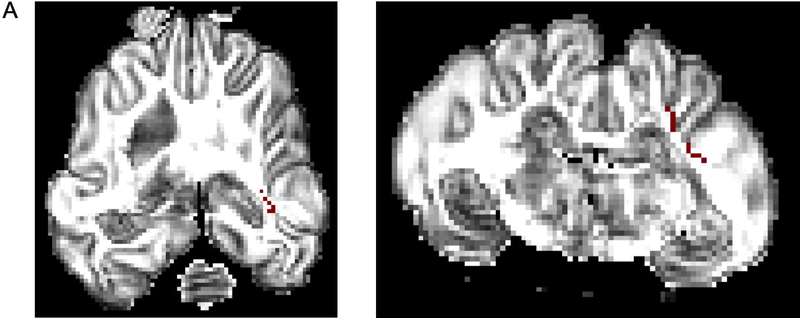
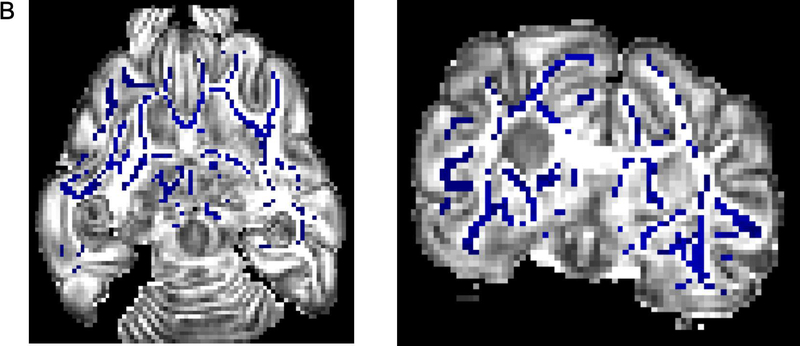
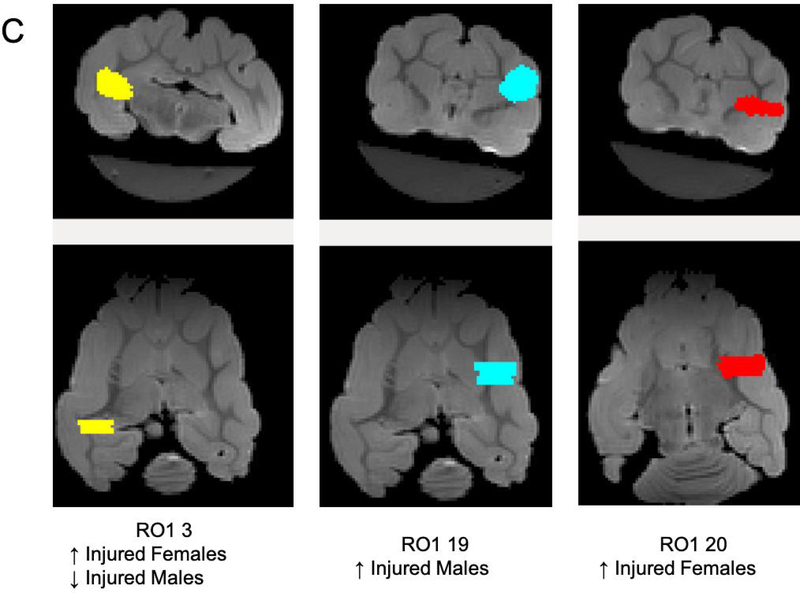
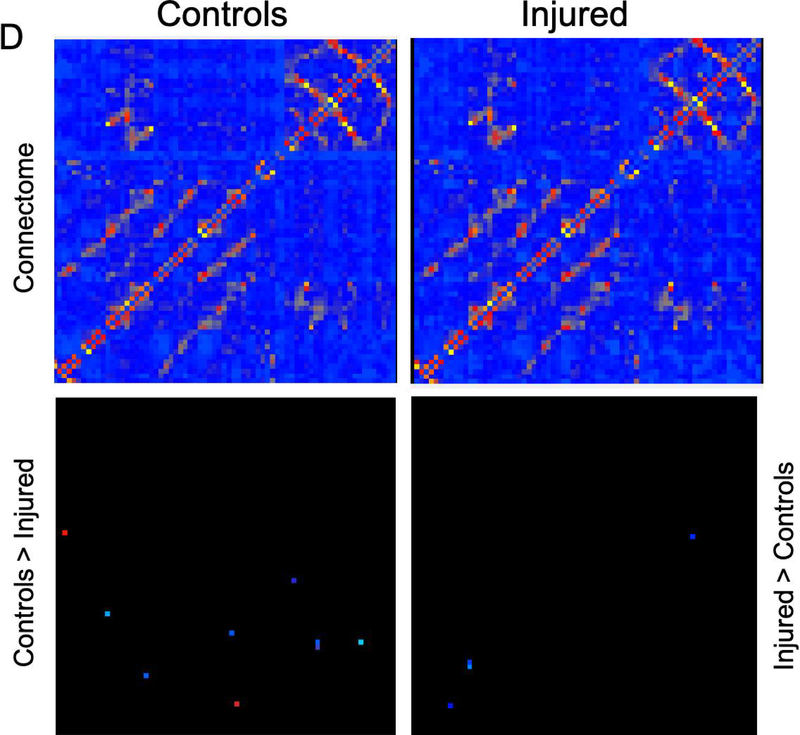
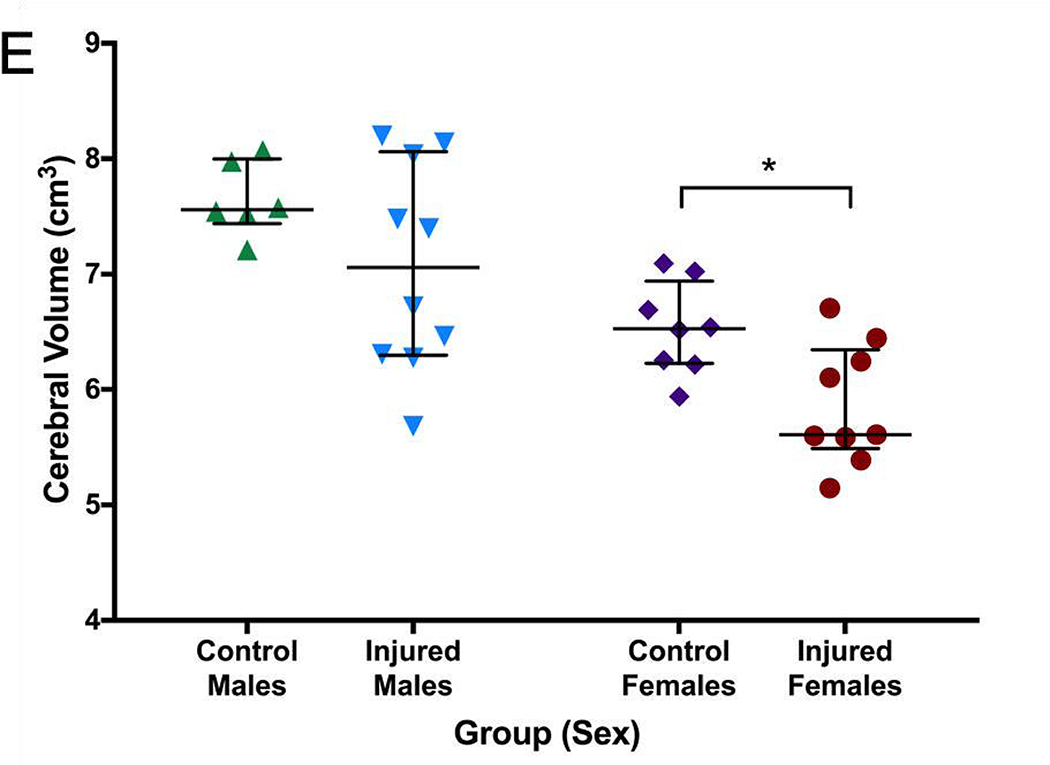
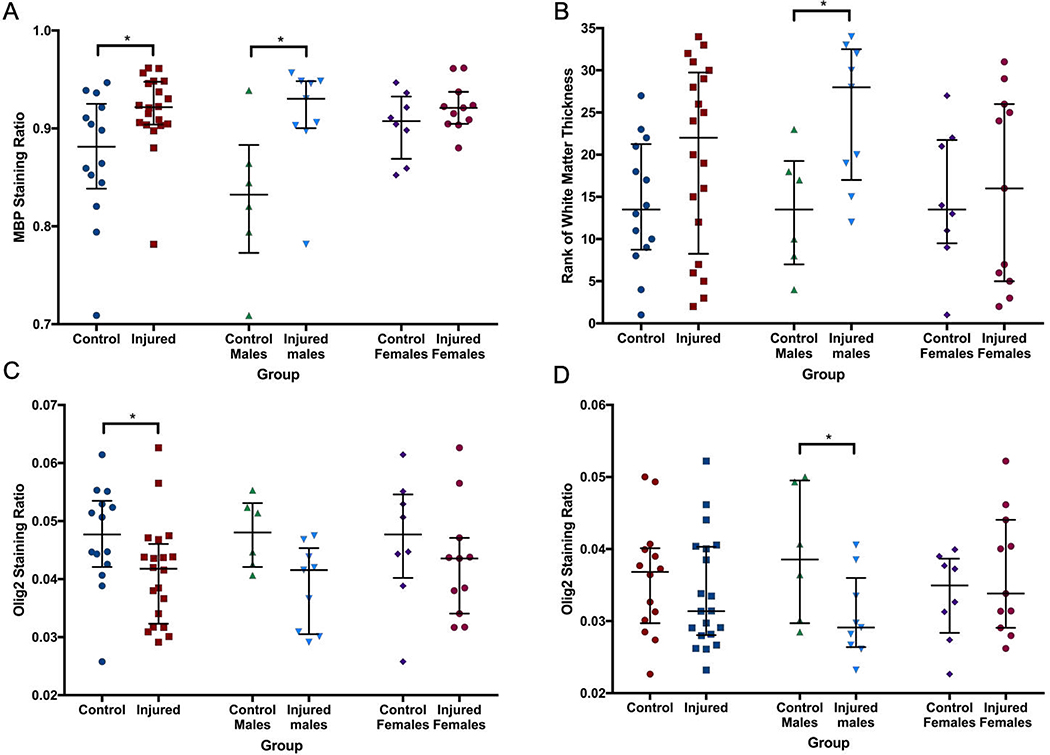
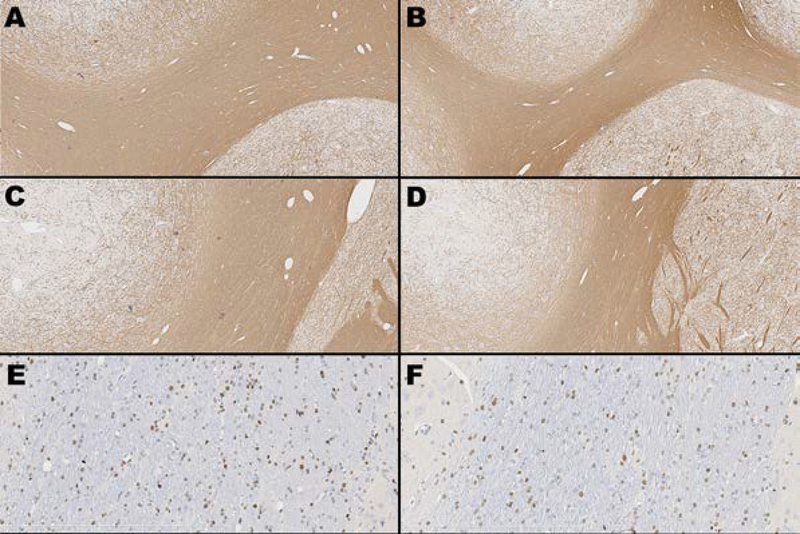
There is an ongoing need for relevant animal models in which to test therapeutic interventions for infants with neurological sequelae of prematurity. The ferret is an attractive model species as it has a gyrified brain with a white-to-gray matter ratio similar to that in the human brain. A model of encephalopathy of prematurity was developed in postnatal day 10 (P10) ferret kits, considered to be developmentally equivalent to infants of 24-26 weeks' gestation. Cross-fostered P10 ferret kits received 5 mg/kg of lipopolysaccharide (LPS) before undergoing consecutive hypoxia-hyperoxia-hypoxia (60 min at 9%, 120 min at 60%, and 30 min at 9%). Control animals received saline vehicle followed by normoxia. The development of basic reflexes (negative geotaxis, cliff aversion, and righting) as well as gait coordination on an automated catwalk were assessed between P28 and P70, followed by ex vivo magnetic resonance imaging (MRI) and immunohistochemical analysis. Compared to controls, injured animals had slower overall reflex development between P28 and P40, as well as smaller hind-paw areas consistent with "toe walking" at P42. Injured animals also displayed significantly greater lateral movement during CatWalk assessment as a result of reduced gait coordination. Ex vivo MRI showed widespread white-matter hyperintensity on T2-weighted imaging as well as altered connectivity patterns. This coincided with white-matter dysmaturation characterized by increased intensity of myelin basic protein staining, white-matter thinning, and loss of oligodendrocyte transcription factor 2 (OLIG2)-positive cells. These results suggest both pathological and motor deficits consistent with premature white-matter injury. This newborn ferret model can therefore provide an additional platform to assess potential therapies before translation to human clinical trials.

Keywords: Brain; Development; Neonatal brain injury; Prematurity; White-matter injury.


Figures

Figure 1.
Figure 1.. Weight gain.
On the day of the insult (P10), mean (SD) weight of the kits was 41.4g (8.8g) for males and 38.8g (7.2g) for females. Injured animals lost, on average, 8.5% (10.4%) bodyweight between P10 and P11 as a result of the insult. By P12 injured animals had gained 9.2% (13.7%) of their P10 bodyweight, compared to a 24.4% (5.2%) weight gain in controls at P12. By the 6th week of age (P35-P42), injured animals had caught up in terms of weight compared to control animals, and males began to become heavier than females. No difference in weight between injured and control animals was seen at P70.
Figure 2.
Figure 2.. Reflex development.
Area under the curve (AUC) analysis for reflex development of negative geotaxis (A), cliff aversion (B), righting reflex (C), and total time across all three tests (D). Median (IQR) negative geotaxis was significantly slower to develop in the injured group compared to the control group. No difference was seen in the AUC for cliff aversion or righting reflex. However, total time AUC was significantly greater in the injured group compared to the control group. The pattern of the AUC results suggested a bimodal distribution of injury, with 6 of 18 animals scoring similarly to control animals, and 12 animals displaying delayed skill development suggestive of cerebral injury. * denotes p<0.05
Figure 3.
Figure 3.. Weight-adjusted paw areas.
At P42, adjusted area of the hind paws of injured animals was significantly smaller than that of control animals (A), with no difference between forepaws. Representative paw prints from the catwalk software (B) show that the hind paws of injured animals (bottom left panels) have a smaller area compared to control animals (top left panels). The red box around the left hind (LH) paw print is the same size, for comparison. * denotes p<0.05.
Figure 4.
Figure 4.. Gait differences over time.
Intensity of pressure per unit area (A) was higher in the hind paws of injured animals at P42 compared to control animals, and the base of support (BOS) ratio of the fore paws relative to the hind paws (B) was also significantly wider in injured animals. However, these differences were absent in subsequent weeks of testing. Using a custom Python package to analyze paw print trajectories, paw print range AUC (C) across the entire testing period was significantly greater in injured animals compared to control animals. A trend towards a greater median path amplitude (D) in the injured group was seen in the injured group compared to the control group. * denotes p<0.05
Figure 5.
Figure 5.. FerretFit paw print analysis.
For each catwalk run, an image showing every paw print was manually extracted from the CatwalkXT software (A). Using a specially-developed ImageJ macro, the paw print boxes were identified and separated out (B) before being analyzed using the FerretFit Python library (C) to determine the total range of paw prints, as well as the amplitude of a sine curve that best fit the trajectory of the prints.
Figure 6.
Figure 6.. MRI and connectome.
Greater fractional anisotropy (A) values were seen in the control group in the right internal capsule dorsolateral to the ventricle at the level of thalamus (marked in red). On T2-weighted imaging (B), significantly greater signal intensity was seen in the injured group throughout the white matter bilaterally (marked in blue). Network connectivity analysis showed three of 71 ROIs that were significantly different between injured and control animals (C). In ROI 3 (right internal capsule at the level of the mesencephalon), connectivity was greater in injured females, compared to control females. In the same ROI, connectivity in injured males was significantly decreased compared to control males. In ROI 19 (left internal capsule and associated white matter at the level of the caudate nucleus), mean connectivity was greater in injured males compared to control males. In ROI 20 (left internal capsule and associated white matter at the level of the caudate nucleus, ventral to ROI 19), mean connectivity was greater in injured females compared to control females. Overall connectivity projections (D) show control (left panels) and injured (right panels) animals, with points of increased connectivity in controls compared to injured animals (bottom left panel), and increased connectivity in injured compared to control animals (bottom right panel). Cerebral volumes (E) in injured females were significantly decreased compared to control females, but no difference in cerebral volume was seen between injured and control males. * denotes P<0.05.
Figure 7.
Figure 7.. Quantitative immunohistochemistry.
Within the internal capsule, MBP (A) staining ratio was significantly greater and less variable in the injured group compared to the control group. This was particularly evident in male animals. The thickness of the corpus callosum and three areas of the internal capsule at the base of consecutive sulci were then measured, and a summary score based on the ranked weight-adjusted thickness of all four areas (B) suggested thinning of the white matter in injured males. Olig2 staining intensity was decreased in the corpus callosum (C) of injured animals compared to control animals. Olig2 staining ratio was also lower in injured males compared to control males within the internal capsule (D). * denotes p<0.05.
Figure 8.
Figure 8.. MBP and Olig2 immunohistochemistry.
Images taken from animals best representing median MBP thickness and Olig2 staining for both control and injured animals. Top two rows, left and right (A-D) depict anti-myelin basic protein (MBP) immunohistochemistry at the level of caudate nucleus showing two areas of the internal capsule - IC1 in a control animal (A) and an injured animal (B), and IC2 in a control (C) and treated animal (D). Original magnification 5x for all images. Positive anti-MBP staining = brown; blue = hematoxylin counterstain. Bottom row depicts anti-Olig2 immunohistochemistry at the level of the internal capsule in a control (E) and injured (F) animal. Original magnification 20x for all images. Positive anti-Olig2 staining = brown; blue = hematoxylin counterstain.

References

    1. Martin JA, Hamilton BE, Osterman MJK, et al. Births: Final Data for 2016. National vital statistics reports : from the Centers for Disease Control and Prevention, National Center for Health Statistics, National Vital Statistics System. 2018;67(1):1–55. - PubMed
    1. Younge N, Goldstein RF, Bann CM, et al. Survival and Neurodevelopmental Outcomes among Periviable Infants. The New England journal of medicine. 2017;376(7):617–28. - PMC - PubMed
    1. Johnson S, Marlow N. Early and long-term outcome of infants born extremely preterm. Archives of Disease in Childhood. 2017;102(1):97. - PubMed
    1. Galinsky R, Polglase GR, Hooper SB, et al. The Consequences of Chorioamnionitis: Preterm Birth and Effects on Development. Journal of Pregnancy. 2013;2013:11. - PMC - PubMed
    1. Reich B, Hoeber D, Bendix I, Felderhoff-Mueser U. Hyperoxia and the Immature Brain. Developmental neuroscience. 2016;38(5):311–30. - PubMed