. 2019 Jul;69(4):661-671.
doi: 10.1007/s12576-019-00683-8. Epub 2019 May 11.

Renal involvement in the pathogenesis of mineral and bone disorder in dystrophin-deficient mdx mouse

Affiliations

Renal involvement in the pathogenesis of mineral and bone disorder in dystrophin-deficient mdx mouse

Eiji Wada et al. J Physiol Sci. 2019 Jul.

Abstract

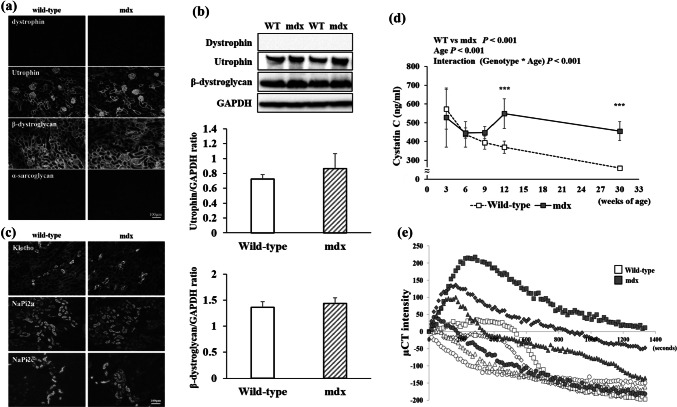
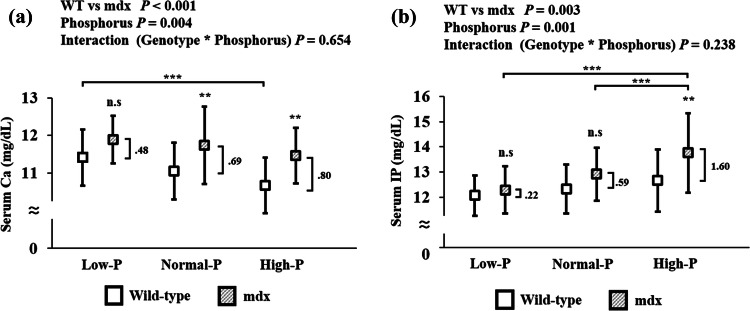
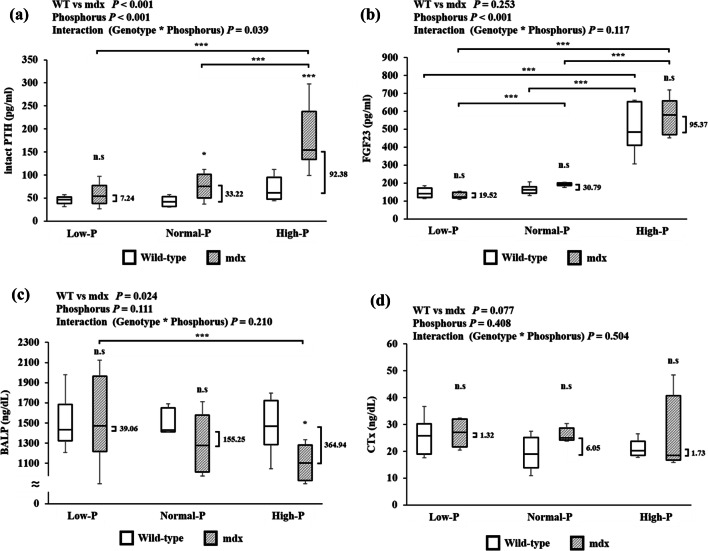
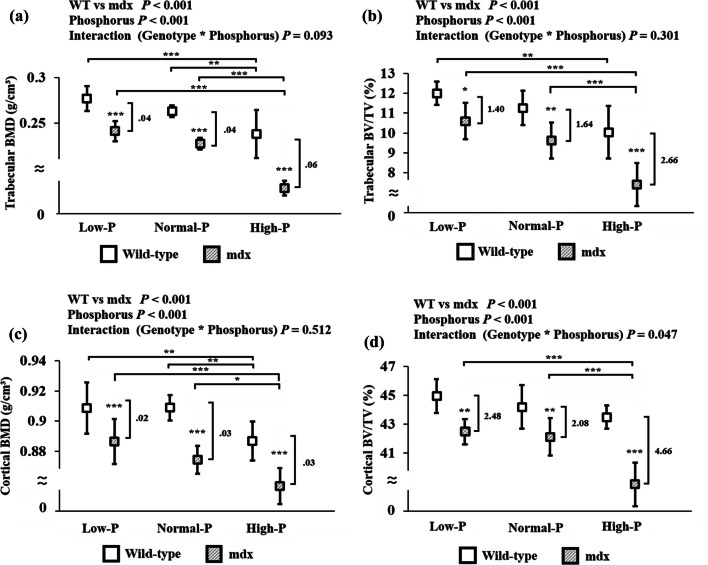
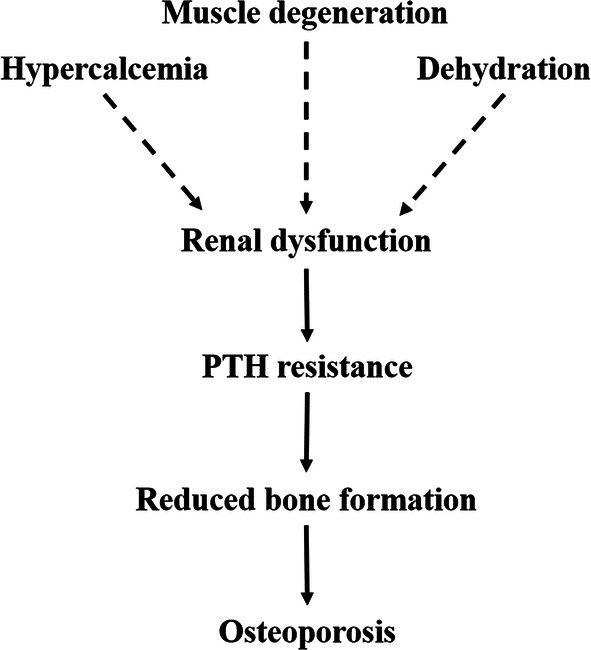
Duchenne muscular dystrophy is a severe muscular disorder, often complicated with osteoporosis, and impaired renal function has recently been featured. We aimed to clarify the involvement of renal function in the pathogenesis of mineral and bone disorder in mdx mice, a murine model of the disease. We clearly revealed renal dysfunction in adult mdx mice, in which dehydration and hypercalcemia were contributed. We also examined the effects of dietary phosphorus (P) overload on phosphate metabolism. Serum phosphate and parathyroid hormone (PTH) levels were significantly increased in mdx mice by dietary P in a dose-dependent manner; however, bone alkaline phosphatase levels were significantly lower in mdx mice. Additionally, bone mineral density in mdx mice were even worsened by increased dietary P in a dose-dependent manner. These results suggested that the uncoupling of bone formation and resorption was enhanced by skeletal resistance to PTH due to renal failure in mdx mice.

Keywords: Duchenne muscular dystrophy; Mineral and bone disorder; Osteoporosis; Phosphate overloading; Renal dysfunction.


Conflict of interest statement

All authors declare that they have no conflicts of interest.

Figures

Fig. 1
Fig. 1
Renal function of wild-type and mdx mice. a Expressions of dystrophin, utrophin, and dystrophin-related proteins in kidney of wild-type and mdx mice. b Western-blot analyses of utrophin and β-dystroglycan. The graph shows quantification of utrophin and β-dystroglycan levels normalized to GAPDH (n = 4, each group). c Expression of klotho, NaPi 2a, and NaPi 2c in the kidney. d Detection of cystatin C in serum of wild-type and mdx mice at age 3, 6, 9, 12, and 30 weeks by ELISA (n = 3-5, each group). Cystatin C levels were significantly increased in mdx mice at 12 and 30 weeks of age. Values of cystatin C are log transformed before analyzed for their skewed distributions; however, the graph and difference are shown in ng/ml. e Measurements of renal function using dynamic CT scanning. Renal excretion rate of an angiographic agent was determined by dynamic CT scanning using a micro CT scanner. The results of wild-type mice are plotted in gray, and those of mdx mice are plotted in black (n = 4, each group). Renal excretion was delayed in most of mdx mice (three in four mice) after 700 s from a trial started. ***P < 0.001
Fig. 2
Fig. 2
Serum levels of calcium and phosphate in mice fed the experimental diets. a Serum calcium (Ca) and b phosphate (IP) levels are shown as the mean (± SD). Difference in the average of wild-type and mdx mice fed the same diet group is shown in number (n = 18–21, each group). **P < 0.01, ***P < 0.001
Fig. 3
Fig. 3
Bone turnover parameters of mice fed the experimental diets. a Plasma levels of intact parathyroid hormone (PTH) (n = 5–6, each group), b serum levels of fibroblast growth factor (FGF) 23 (n = 6–8, each group), c bone-specific alkaline phosphatase (BALP) (n = 6–7, each group) and d C-terminal collagen crosslinks (CTx) (n = 5–6, each group). The data are shown as the interquartile range, with the 75th and 25th percentiles. Difference in the average of wild-type and mdx mice fed the same diet group is shown in numbers. The values are log transformed before being analyzed for their skewed distributions. *P < 0.05, **P < 0.01, ***P < 0.001
Fig. 4
Fig. 4
Bone phenotype and morphometric parameters of mice fed the experimental diets. a Trabecular bone mineral density (BMD), b trabecular bone volume (BV)/tissue volume (TV), c cortical BMD, and d cortical BV/TV. The results are shown as the mean (± SD). Difference in the average of wild-type and mdx mice fed the same diet group is shown in number (n = 4, each group). *P < 0.05, **P < 0.01, ***P < 0.001
Fig. 5
Fig. 5
Schematic model indicating the mineral and bone disorder in mdx mice. Dramatic muscle degeneration and immobilization play a role in hypercalcemia, and renal dysfunction is partly triggered by hypercalcemia and dehydration. Renal dysfunction and increased PTH levels contribute to lower bone density in adult mdx mice

References

    1. Moser H. Duchenne muscular dystrophy: pathogenetic aspects and genetic prevention. Hum Genet. 1984;66(1):17–40. doi: 10.1007/BF00275183. - DOI - PubMed
    1. Hoffman EP, Brown RH, Kunkel LM. Dystrophin: the protein product of the Duchenne muscular dystrophy locus. Cell. 1987;51(6):919–928. doi: 10.1016/0092-8674(87)90579-4. - DOI - PubMed
    1. Villanova M, Brancalion B, Mehta AD. Duchenne muscular dystrophy: life prolongation by noninvasive ventilatory support. Am J Phys Med Rehabil. 2014;93(7):595–599. doi: 10.1097/PHM.0000000000000074. - DOI - PubMed
    1. Liew WK, Kang PB. Recent developments in the treatment of Duchenne muscular dystrophy and spinal muscular atrophy. Ther Adv Neurol Disord. 2013;6(3):147–160. doi: 10.1177/1756285612472386. - DOI - PMC - PubMed
    1. Pouwels S, de Boer A, Leufkens HG, Weber WE, Cooper C, van Onzenoort HA, et al. Risk of fracture in patients with muscular dystrophies. Osteoporos Int. 2014;25(2):509–518. doi: 10.1007/s00198-013-2442-2. - DOI - PubMed