. 2019 Jul 1;377(2148):20180094.
doi: 10.1098/rsta.2018.0094.

The source and engine of coronal mass ejections

Affiliations

The source and engine of coronal mass ejections

Manolis K Georgoulis et al. Philos Trans A Math Phys Eng Sci. .

Abstract

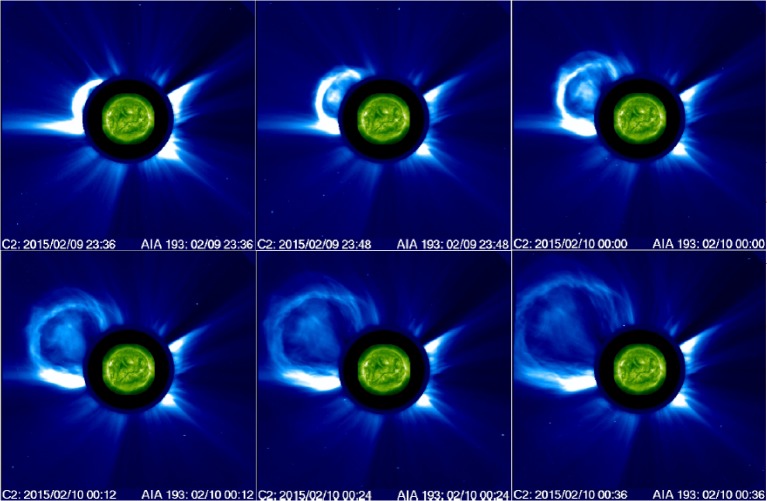
Coronal mass ejections (CMEs) are large-scale expulsions of coronal plasma and magnetic field propagating through the heliosphere. Because CMEs are observed by white-light coronagraphs which, by design, occult the solar disc, supporting disc observations (e.g. in EUV, soft X-rays, Halpha and radio) must be employed for the study of their source regions and early development phases. We review the key properties of CME sources and highlight a certain causal sequence of effects that may occur whenever a strong (flux-massive and sheared) magnetic polarity inversion line develops in the coronal base of eruptive active regions (ARs). Storing non-potential magnetic energy and helicity in a much more efficient way than ARs lacking strong polarity inversion lines, eruptive regions engage in an irreversible course, making eruptions inevitable and triggered when certain thresholds of free energy and helicity are crossed. This evolution favours the formation of pre-eruption magnetic flux ropes. We describe the steps of this plausible path to sketch a picture of the pre-eruptive phase of CMEs that may apply to most events, particularly the ones populating the high end of the energy/helicity distribution, that also tend to have the strongest space-weather implications. This article is part of the theme issue 'Solar eruptions and their space weather impact'.

Keywords: coronal mass ejections; interpretation; solar eruptions.


Conflict of interest statement

We declare we have no competing interests.

Figures

Figure 1.
Figure 1.
A 60-min evolution of a CME in the field of view of the SOHO/LASCO C2 coronagraph. In each panel, the LASCO data are combined with the temporally best-matched SDO/AIA 193 Å data. The CME appears in the top-left quadrant in each image.
Figure 2.
Figure 2.
Evolution of the photospheric magnetic field prior to a twin major eruption. The grey-scale background and the arrows show the normal and horizontal components of the field, respectively. The red curve delineates the PIL, while the red circle and green dashed circles mark sites of flux emergence and shearing motions, respectively. Adapted from Chintzoglou et al. [27].
Figure 3.
Figure 3.
The three left-most columns show the evolution of the line-of-sight component of the magnetic field in a bipolar AR. The yellow contour encircles the area in which significant flux cancellation took place. The other columns show C-Poly filter SXR observations of the same AR. Reproduced with permission from Green et al. [57].
Figure 4.
Figure 4.
A confined flare observed in 131 Å. (a,b) The pre-event corona while (c,d) the development of the hot flux rope. (e,f ) The image of (d) after wavelet enhancement and the corresponding temperature map, respectively. Adapted from Patsourakos et al. [64].
Figure 5.
Figure 5.
Sketch of the standard flare model as supported by Yohkoh observations. Adapted from Shibata et al. [76].
Figure 6.
Figure 6.
Indicative analysis steps followed to enable the evaluation of equations (3.14), (3.15). (a) Mean α-values of the partitioned photospheric flux map of the magnetogram shown on the right. (b) Photospheric projections of coronal magnetic connectivities on the magnetogram. The different segment colours indicate different connected fluxes for each flux tube. Only flux tubes closing within the field-of-view are represented. Magnetic field values in the right are saturated at ±1 kG. Tick mark separation is 20”. Solar north is up; west is on the right. Reproduced with permission from Georgoulis et al. [127].
Figure 7.
Figure 7.
Scatter plot of the relative helicity magnitude |Hm(rel)| as a function of the free magnetic energy Ec for 162 vector magnetograms of several solar ARs at different evolutionary stages. Red symbols indicate eruptive ARs, while blue symbols indicate non-eruptive ones. Dashed horizontal and vertical lines show empirically inferred limits of free energy and relative helicity for ARs to be eruptive, while the dotted and dash-dotted lines show the least-squares best-fit curves using two different regression approximations. Reproduced with permission from Tziotziou et al. [133].
Figure 8.
Figure 8.
Evolution of the normalized mutual and self-terms of (a) relative magnetic helicity and (b) free magnetic energy in NOAA AR 11158 for a five-day period in February 2011. The triangles indicate the onset times of flares triggered in the AR, with GOES C-, M- and X-class events denoted by blue, green and red, respectively. From Tziotziou et al. [37].

References

    1. Webb DF, Howard TA. 2012. Coronal mass ejections: observations. Living Rev. Solar Phys. 9, 3 ( 10.12942/lrsp-2012-3) - DOI
    1. Fletcher L. et al. 2011. An observational overview of solar flares. Space Sci. Rev. 159, 19–106. ( 10.1007/s11214-010-9701-8) - DOI
    1. Andrews MD. 2003. A search for CMEs associated with big flares. Solar Phys. 218, 261–279. ( 10.1023/B:SOLA.0000013039.69550.bf) - DOI
    1. Yashiro S, Gopalswamy N, Akiyama S, Michalek G, Howard RA. 2005. Visibility of coronal mass ejections as a function of flare location and intensity. J. Geophys. Res. (Space) 110, A12S05 ( 10.1029/2005JA011151) - DOI
    1. Hudson HS, Cliver EW. 2001. Observing coronal mass ejections without coronagraphs. J. Geophys. Res. (Space) 106, 25199–25214. ( 10.1029/2000JA904026) - DOI

LinkOut - more resources