. 2019 Jul 1;377(2148):20180095.
doi: 10.1098/rsta.2018.0095.

Sources of solar energetic particles

Affiliations

Sources of solar energetic particles

Loukas Vlahos et al. Philos Trans A Math Phys Eng Sci. .

Abstract

Solar energetic particles are an integral part of the physical processes related with space weather. We present a review for the acceleration mechanisms related to the explosive phenomena (flares and/or coronal mass ejections, CMEs) inside the solar corona. For more than 40 years, the main two-dimensional cartoon representing our understanding of the explosive phenomena inside the solar corona remained almost unchanged. The acceleration mechanisms related to solar flares and CMEs also remained unchanged and were part of the same cartoon. In this review, we revise the standard cartoon and present evidence from recent global magnetohydrodynamic simulations that support the argument that explosive phenomena will lead to the spontaneous formation of current sheets in different parts of the erupting magnetic structure. The evolution of the large-scale current sheets and their fragmentation will lead to strong turbulence and turbulent reconnection during solar flares and turbulent shocks. In other words, the acceleration mechanism in flares and CME-driven shocks may be the same, and their difference will be the overall magnetic topology, the ambient plasma parameters, and the duration of the unstable driver. This article is part of the theme issue 'Solar eruptions and their space weather impact'.

Keywords: coronal mass ejections; flares; shocks; solar energetic particles; solar eruptions.


Conflict of interest statement

The authors declare that they have no competing interests

Figures

Figure 1.
Figure 1.
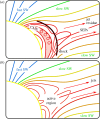
(a) Schematic of the reconnecting field (solid green) forming closed coronal loops and open field lines, presumably extending higher up into the corona and the solar wind. The red foam represents turbulence. Acceleration probably takes place in the outflow regions above and below the X-point. Particles (temporarily) trapped here produce the radiation seen above the closed loops, and particles escaping these regions up and down (blue arrows) are observed at 1 AU as SEPs and produce the non-thermal radiation (mainly at the two footpoints; blue ovals), respectively. (b) Similar schematic view, joining the flare site field lines to the CME, the shock, and beyond (from Lee [3]). The rectangles define the boundary of the acceleration sites and represent the leaky box [4]. (Online version in colour.)
Figure 2.
Figure 2.
(a,b) Proton fluence spectra for two GLE events from Mewaldt et al. [47]. (c,d) Proton fluence spectra from multi-spacecraft observations (STA, STB and near-Earth) for two large SEP events, from Mewaldt et al. [48]. (c, 4 August 2011; d, 27 January 2012). The measured spectra are fitted with a double power-law function. (Online version in colour.)
Figure 3.
Figure 3.
Sketch of possible sources of SEPs. (a) A CME-driven shock wave (grey) that accelerates plasma from the high corona, and residues from jets. Blue field lines track the fast solar wind (SW) from coronal holes that have photospheric sources similar to the slow SW, but less trapping and divergence. (b) An active region (red), containing closed loops from which solar jets emerge. Field lines carrying the slow SW (yellow and green) diverge from open field lines from the photosphere outside of active regions [46].
Figure 4.
Figure 4.
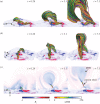
Temporal evolution of the formation and dynamics of an eruptive magnetic flux rope (MFR). (a,b) The field lines from different viewing angles. E and S stand for east and south. An animation of these panels is available in the original article, its duration is 4 s. (c) Temporal evolution of |J|/|B| plotted in the xz plane at y = 0.38, with a viewpoint from the south [58].
Figure 5.
Figure 5.
(a) Images at different times from the initial emergence to the eruption. (b) Top view of the corresponding magnetic field evolution at different times (t = 0, 12, 24, 48 and 57) from the MHD model. The field lines are traced from footpoints evenly distributed at the bottom surface, which is shown with the photospheric magnetic flux map. Field lines closed (open) in the box are coloured black (green), while those becoming open from closed during the eruption are coloured red. (c) Side view of the magnetic field lines from south (i.e. the horizontal and vertical axes are x and z, respectively). The background shows a 2D central cross-section of the 3D volume and its colour indicates the value of the vertical component of the velocity. (d) Vertical cross-sections of the evolving magnetic topology show the spontaneous formation of a large-scale current sheet [59].
Figure 6.
Figure 6.
Iso-contours of the supercritical current density component Jz (positive in brown negative in violet) [76].
Figure 7.
Figure 7.
(a) Current density in an x-y-plane cross-section of data. Red indicates negative current and blue indicates positive current. Identified current sheets in the plane are marked by green colour. (b) Probability distribution of the current sheet Ohmic dissipation rate. The distribution from all current sheets (black) shows a power-law tail with index near −1.8 (from [87]).
Figure 8.
Figure 8.
(a) Particle orbits inside the simulation box, coloured according to their kinetic energy (b) Typical particle trajectories in energy of some accelerated particles. (c) Initial and final (at t = 0.002 s) kinetic energy distribution from the test-particle simulations, together with a power-law fit, and the solution of the fractional transport equation (FTE) at final time [76].
Figure 9.
Figure 9.
(a) The trajectory of a typical particle (blue tube) inside a grid with linear dimension L. Active points are marked by spheres in red colour. The particle starts at a random grid-point (green sphere), moves along a straight path on the grid till it meets an active point and then it moves into a new random direction, and so on, until it exits the simulation box. (b) Energy distribution of the ions at t = 0 s and t = 30 s (stabilized) [91].
Figure 10.
Figure 10.
Side-view (a) and top view (b) of the 3D fieldline topology and velocity (isosurface greater than or equal to 200 km s−1) during the blowout jet emission (t = 54 min). The direction of the fieldlines is shown by the (black) arrows [99]. (Online version in colour.)
Figure 11.
Figure 11.
MHD simulations, zoom into the coronal part: (a) Magnetic field lines (blue tubes), together with an iso-contour plot of the parallel electric field (red and yellow 3D-surfaces). At the bottom x-y-plane, the photospheric component Bz is shown as a 2D filled contour plot. (b) As left, zoomed, and the region in which the spatial initial conditions for the particles are chosen is out-lined by a green cube [106].
Figure 12.
Figure 12.
Snapshot 30: Kinetic energy distribution of electrons after ≈ 0.1 s, without collisions, together with a fit at the low energy, Maxwellian part and the high energy, power-law part, the initial distribution and the distribution of the leaving particles (for every particle at the time it leaves) [106]. (Online version in colour.)
Figure 13.
Figure 13.
(a) Small version of the simulation box with the planar shock wave in the middle. The strongly turbulent environments upstream and downstream are acting as active scatterers. Particles not only return back to the shock, as in the case of the traditional DSA model but also gain energy upstream and downstream. (b) Trajectory of a typical particle inside the simulation box. [52].

References

    1. Reames DV. 1995. Solar energetic particles: a paradigm shift. Rev. Geophys. 33, 585–589. (10.1029/95RG00188) - DOI
    1. Klein KL, Trottet G. 2001. The origin of solar energetic particle events: coronal acceleration versus shock wave acceleration. Space Sci. Rev. 95, 215–225. (10.1023/A:1005236400689) - DOI
    1. Lee MA. 2005. Coupled hydromagnetic wave excitation and ion acceleration at an evolving coronal/interplanetary shock. Astrophys. J. Suppl. 158, 38–67. (10.1086/428753) - DOI
    1. Petrosian V. 2016. Particle acceleration in solar flares and associated CME shocks. Astrophys. J. 830, 28 (10.3847/0004-637X/830/1/28) - DOI
    1. Petrosian V. 2012. Stochastic acceleration by turbulence. Space Sci. Rev. 173, 535–556. (10.1007/s11214-012-9900-6) - DOI

LinkOut - more resources