. 2019 Jul 1;377(2148):20180387.
doi: 10.1098/rsta.2018.0387.

The emergence of magnetic flux and its role on the onset of solar dynamic events

Affiliations

The emergence of magnetic flux and its role on the onset of solar dynamic events

V Archontis et al. Philos Trans A Math Phys Eng Sci. .

Abstract

A plethora of solar dynamic events, such as the formation of active regions, the emission of jets and the occurrence of eruptions is often associated with the emergence of magnetic flux from the interior of the Sun to the surface and above. Here, we present a short review on the onset, driving and/or triggering of such events by magnetic flux emergence. We briefly describe some key observational examples, theoretical aspects and numerical simulations, towards revealing the mechanisms that govern solar dynamics and activity related to flux emergence. We show that the combination of important physical processes like shearing and reconnection of magnetic fieldlines in emerging flux regions or at their vicinity can power some of the most dynamic phenomena in the Sun on various temporal and spatial scales. Based on previous and recent observational and numerical studies, we highlight that, in most cases, none of these processes alone can drive and also trigger explosive phenomena releasing considerable amount of energy towards the outer solar atmosphere and space, such as flares, jets and large-scale eruptions (e.g. coronal mass ejections). In addition, one has to take into account the physical properties of the emerging field (e.g. strength, amount of flux, relative orientation to neighbouring and pre-existing magnetic fields, etc.) in order to better understand the exact role of magnetic flux emergence on the onset of solar dynamic events. This article is part of the theme issue 'Solar eruptions and their space weather impact'.

Keywords: eruptions; jets; magnetic fields; sun.


Conflict of interest statement

We declare we have no competing interests.

Figures

Figure 1.
Figure 1.
Formation of an active region following magnetic flux emergence: (a) vertical component of photospheric magnetic field (white is positive and black is negative magnetic polarity). Small-scale mixed polarity magnetic field appears between the two sunspots. (b) View of (a) in EUV 171 Å (transition region), showing how magnetic loops join the opposite polarity fields in the AR. Adapted from [3].
Figure 2.
Figure 2.
(a,c) Field lines showing the ‘sheared arcade’ configuration (blue lines) and the formation of new long magnetic loops (e.g. orange line, c). (b,d) Field lines showing the J-loops configuration (blue lines) and the formation of a twisted MFR (orange lines, d). The horizontal slice is photospheric Bz (black and white). The yellow arrows show the photospheric velocity field and the red contours show the photospheric vorticity. The purple isosurface is |J/B|. Adapted from Syntelis et al. [75].
Figure 3.
Figure 3.
(a) Field lines showing the emerged magnetic field and the external magnetic field. The emerged field consists of a core field (similar to the red lines) and an outermost ‘envelope’ field (similar to the blue lines). The external field is horizontal and is antiparallel to the envelope field (Φ = 180°) (white lines). (b) Same as (a), but for an external field oriented by Φ = 90°. (c) The magnetic field strength and projected vector at the cross-section of the emerged magnetic field region. This panel shows the location of the internal reconnection region, the MFR centre, the envelope field and the height of the axis of the sub-photospheric flux tube. (d) Height–time profile of the MFR for ‘confined’ eruptions. The solid line is a case with no external field. Tha dashed line is a case with external field parallel to the envelope field (Φ = 0). (e) Height–time profiles of the MFR for ‘ejective’ eruptions. Different lines show different relative orientation of the field. (f ) Vz component of the velocity at the cross-section of the MFR showing the enhanced internal reconnection during fast rising eruptive phase. Adapted from Archontis & Hood [36].
Figure 4.
Figure 4.
(a) Height–time profile of the MFR showing a slow rise and a fast rise phase. The vertical lines indicate the onset of torus instability (left) and tether cutting reconnection (right). The inset shows a close-up of the height–time profile around the initiation of torus instability. (b) The decay index n measured at the MFR centre. (c) Magnetic field topology prior the tether-cutting reconnection. Blue lines show low lying J-loops. Yellow lines show the MFR. Green lines show the outermost envelope field lines. Red lines show the stretched envelope field lines above the MFR about to reconnect via tether-cutting. The purple isosurface is a low-lying current sheet. (d) Same as (c) but after the tether-cutting reconnection. Here, the red lines have reconnected and have now become part of the MFR. Cyan lines show the flare loops. Adapted from Syntelis et al. [75].
Figure 5.
Figure 5.
(a) Height–time profile of a confined eruption (solid line) inside a high decay index environment. Dashed line shows the height–time profile of the envelope field, inside which the confined eruption takes place. (b) The decay index measured at the MFR centre.
Figure 6.
Figure 6.
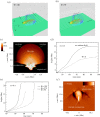
(a) Temperature distribution at the vertical midplane showing the configuration prior to the blowout jet eruption. Arrows indicate the projected velocity field on the plane. (b) Temperature distribution during the MFR eruption, leading to the onset of the blowout jet. (c) Distance-time diagram of ρ2, showing the propagation of the Alfvén wave along the spire of a blowout jet. (d) Three-dimensional magnetic field topology during the ejection of the blow-out jet. See text for details. (a,b,d) Are adapted from Archontis & Hood [86]. (c) Adapted from Lee et al. [68]).
Figure 7.
Figure 7.
(a,b) Temperature (first row) and density (second row) of a standard (first column) and a blowout (second column) jet driven by a minifilament eruption.

References

    1. Parker EN. 1955. The formation of sunspots from the solar toroidal field. Astrophys. J. 121, 491 (10.1086/146010) - DOI
    1. Zwaan C. 1985. The emergence of magnetic flux. Sol. Phys. 100, 397–414. (10.1007/BF00158438) - DOI
    1. Schmieder B, Archontis V, Pariat E. 2014. Magnetic flux emergence along the solar cycle. Space Sci. Rev. 186, 227–250. (10.1007/s11214-014-0088-9) - DOI
    1. van Driel-Gesztelyi L, Green LM. 2015. Evolution of active regions. Living Rev. Sol. Phys. 12, 1 (10.1007/lrsp-2015-1) - DOI - PubMed
    1. Green LM, Török T, Vršnak B, Manchester W, Veronig A. 2018. The origin, early evolution and predictability of solar eruptions. Space Sci. Rev. 214, 46 (10.1007/s11214-017-0462-5) - DOI

LinkOut - more resources