. 2019 Jun 19;102(6):1127-1142.e3.
doi: 10.1016/j.neuron.2019.04.013. Epub 2019 May 9.

Mitochondrial Dysfunction Leads to Cortical Under-Connectivity and Cognitive Impairment

Affiliations

Mitochondrial Dysfunction Leads to Cortical Under-Connectivity and Cognitive Impairment

Alejandra Fernandez et al. Neuron. .

Abstract

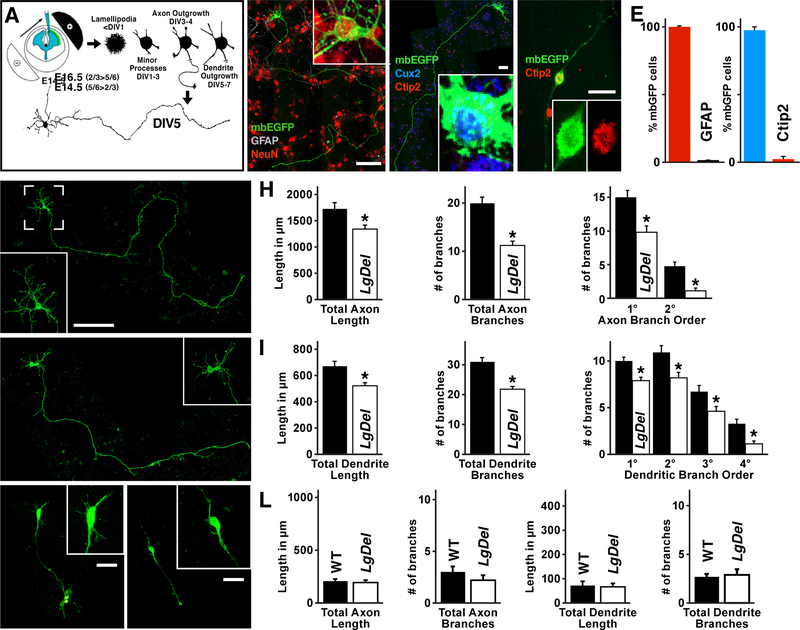
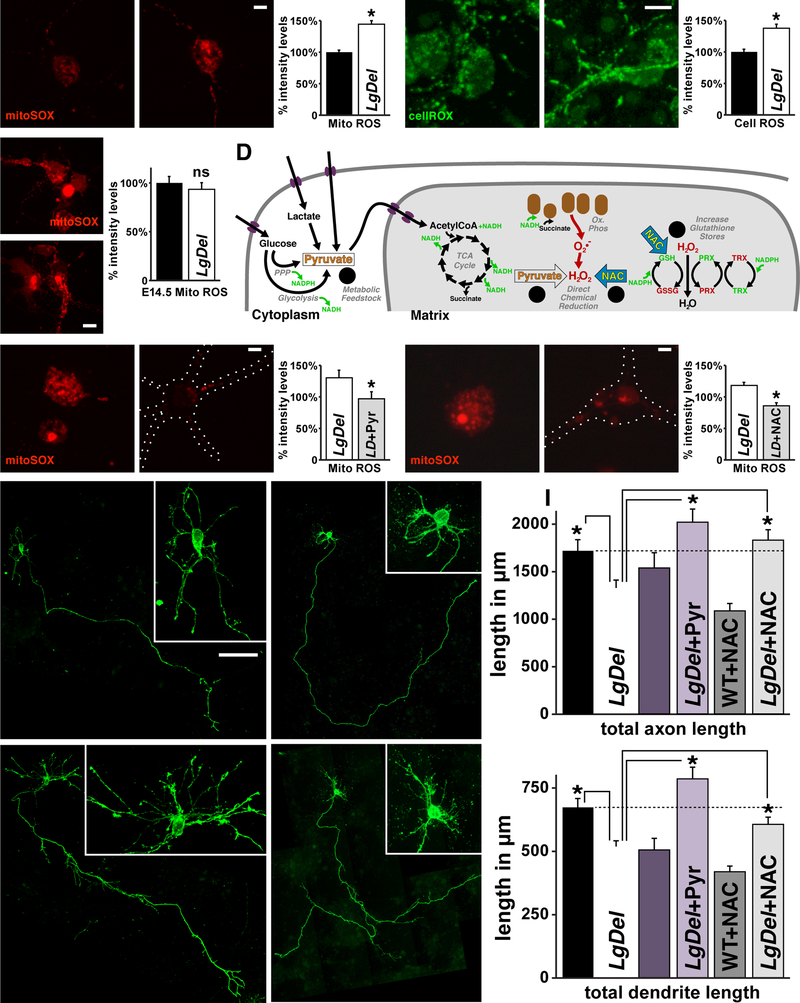
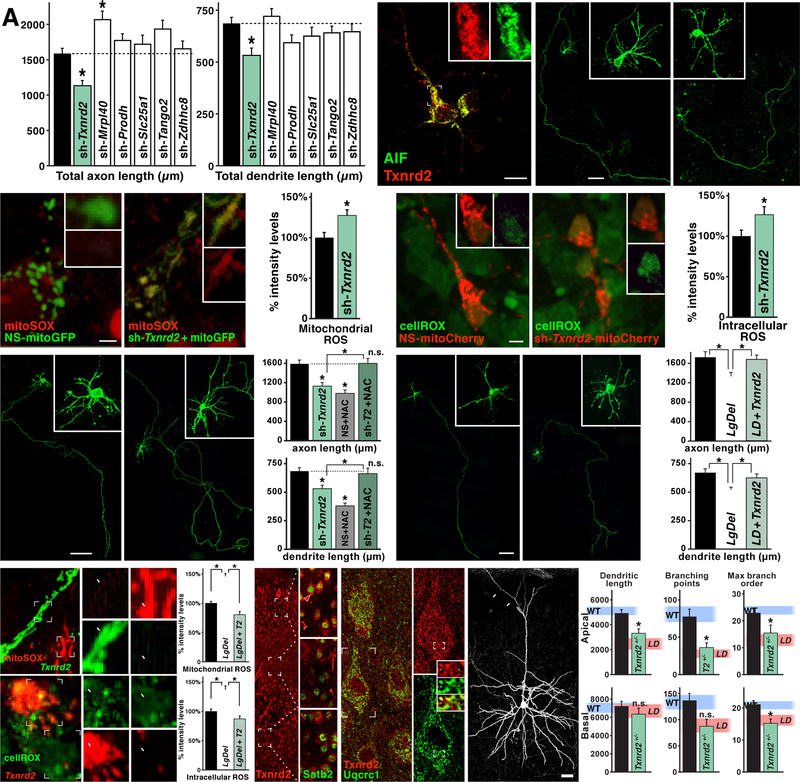
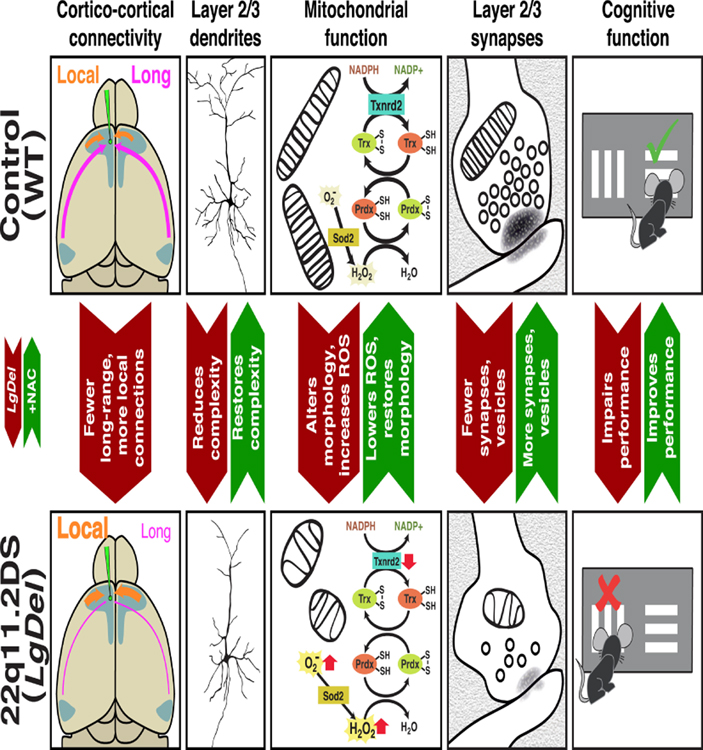
Under-connectivity between cerebral cortical association areas may underlie cognitive deficits in neurodevelopmental disorders, including the 22q11.2 deletion syndrome (22q11DS). Using the LgDel 22q11DS mouse model, we assessed cellular, molecular, and developmental origins of under-connectivity and its consequences for cognitive function. Diminished 22q11 gene dosage reduces long-distance projections, limits axon and dendrite growth, and disrupts mitochondrial and synaptic integrity in layer 2/3 but not 5/6 projection neurons (PNs). Diminished dosage of Txnrd2, a 22q11 gene essential for reactive oxygen species catabolism in brain mitochondria, recapitulates these deficits in WT layer 2/3 PNs; Txnrd2 re-expression in LgDel layer 2/3 PNs rescues them. Anti-oxidants reverse LgDel- or Txnrd2-related layer 2/3 mitochondrial, circuit, and cognitive deficits. Accordingly, Txnrd2-mediated oxidative stress reduces layer 2/3 connectivity and impairs cognition in the context of 22q11 deletion. Anti-oxidant restoration of mitochondrial integrity, cortical connectivity, and cognitive behavior defines oxidative stress as a therapeutic target in neurodevelopmental disorders.

Keywords: autism spectrum disorders; cortical projection neurons; mitochondria; neurodevelopmental disorders; reactive oxygen species; schizophrenia; under-connectivity.


Conflict of interest statement

Declaration of Interest: The authors declare no competing interests.

Figures

Figure 1:
Figure 1:
Long-distance cortico-cortical connectivity is altered in the LgDel. A) Representative coronal section from a mouse brain injected stereotaxically with Biocytin3Alexafluor488 in medial frontal association cortex (mFAC). Retrogradely labeled cells throughout the anterior-posterior cortical axis were plotted and transformed to polar coordinates to generate raster plots relative to the mid-point of the horizontal midline. B) Laminar distribution of labeled cells in WT and LgDel lateral entorhinal cortex (laEC) is similar; however, their overall density appears diminished in LgDel. Graph represents the mean percentage of cells in each of 5 equidistant bins and error bars SEM. C) Schematic of injection site and location of coronal sections analyzed for retrogradely labeled cortical neurons (left). On this cartoon of a dorsal view of the adult mouse brain, key cortical areas are indicated in the left hemisphere to define the location of labeled neurons in each of the representative sections, and the relationship to the raster plots (right); AC: medial frontal association cortex, SS: somatosensory cortex, Ent: Entorhinal cortex, Vis: Visual cortex, RS: retrosplenial cortex. For each section, the angular location and frequency of all retrograde labeled cortical cells (right) is shown in raster plots for WT (n=3; black) and LgDel (n=3; red) in the ipsilateral (left) and contralateral (right) hemispheres. Colored bars directly beneath raster plots indicate regions of LgDel over-connectivity (red bars; ≥ 5× density v. WT) or under-connectivity (black bars; ≤5× density v. WT). D) Representative ipsilateral and contralateral sections at location 5 (posterior, panel 1C). Reduced labeling is apparent in LgDel laEC (90–120°, arrows) and visual/visual association cortex (~40°, arrowheads). Increased labeling is seen in a small medial dorsal region in the ipsilateral hemisphere (asterisk). Scale bar 500 μm.
Figure 2:
Figure 2:
Layer 2/3 projection neuron (PN) cytological and synaptic integrity is compromised in LgDel frontal cortex. A) Block-face SEM image of a WT layer 2/3 PN at low magnification showing the cell body, the nucleus with deep nuclear indentations (inset), and a well-defined apical dendrite with high density of ribosome rosettes, elongated mitochondria, filamentous and tubular cytoskeletal elements. A1) Higher magnification images of WT mitochondria (m), ribosomes (arrowheads), neurofilaments (arrow) and microtubules (arrow) in a layer 2/3 apical dendrite. A2–4) WT mitochondria and synapses (asterisks), in and around an apical dendrite in the adjacent neuropil and WT layer 2/3 neuropil synapses. The dendrite and adjacent neuropil elements have healthy mitochondria (A2,3), typical pre- and post-synaptic specializations, and a high frequency of presynaptic vesicles (A3,4). B) Block-face SEM image of LgDel layer 2/3 PN. The nucleus is pale and labeled chromatin is sparse, the nuclear envelope smooth with few, shallow, nuclear indentations (inset). B1) The apical dendrite cytoplasm has fewer, shorter mitochondria, diminished ribosomes, as well as fewer filamentous and tubular cytoskeletal elements. B2–4) Mitochondria and synapses in and around the apical dendrite of a layer 2/3 PN. The mitochondria are swollen and round rather than elongated; their cristae are distended and disordered. B5,6) Layer 2/3 pre-synaptic terminals (asterisks) are dilated, and have few organelles or synaptic vesicles as well as diminished presynaptic densities. Postsynaptic profiles (ps) are similarly organelle-sparse. C) WT and D) LgDel layer 5/6 PNs are indistinguishable. Insets Apical dendrites have substantial density of ribosome rosettes, robust neurofilament and microtubules networks, and deep nuclear indentations. C1–3, D1–3) WT (C1–3) and LgDel (D1–3) layer 5/6 PN mitochondria do not differ in morphology or apparent distribution. C4–6, D4–6) Synaptic vesicle density in WT (C4–6) and LgDel (D4–6) layer 5/6 PN-adjacent neuropil appears equivalent. E) Left to right: Quantification of WT and LgDel PN cell body, dendrite, and neuropil mitochondria, pre-synaptic frequency, and synaptic vesicle density in layer 2/3 and 5/6. (*p<0.0021, 0.00057, 0.0001, 0.008, 0.011, respectively). Data are represented as Mean +SEM Scale bar 5 μm.
Figure 3:
Figure 3:
Diminished growth of LgDel layer 2/3 PNs in vitro (PNivt). A) The experimental paradigm used to establish layer 2/3 versus 5/6 PN cultures. B) These cultures (neurons for analysis identified via electroporation of membrane bound Enhanced GFP (mbEGFP), as shown in panel A) yield nearly all neurons (NeuN; red nuclear labeling), with few if any glial cells (GFAP; no labeling apparent in this panel). C) Cultured neurons harvested from E16.5 cerebral cortices (2/3 PNivt; mbEGFP) uniformly express Cux2 (blue), a selective marker layer for layer 2/3 PNs in vivo. D) Cultured neurons harvested from E14.5 cerebral cortices (5/6 PNivt) more frequently express Ctip2 (red), a layer 5/63selective marker. E) mbEGFP labeled neurons in E16.5 (layer 2/3 PNivt) cultures have been quantified for co-expression of NeuN (neuronal marker), Cux2, and Ctip2 frequency. F) A WT layer 2/3 PNivt with highly branched dendrites (brackets, inset) and long branching axon. G) A LgDel layer 2/3 PNivt; its dendrites appear shorter and less complex (brackets, inset), and the axon appears shorter. H) Quantitative comparisons of WT and LgDel layer 2/3 axon length (p<0.0272), branching (p<4×10⁶), and branch order (* indicates p<0.011 and 0.0001 respectively). I) Quantitative comparisons of WT and LgDel layer 2/3 dendrite length (p<0.0013), branching (p<0.00003), and branch order (* indicates 0.013, 0.002, 0.012, 0.013 respectively). J,K) WT (J) and LgDel (K) layer 5/6 PNivt (identity confirmed as +Ctip2; not shown) do not have apparent differences in growth or differentiation. Axons and dendrites of layer 5/6 PNivt in both genotypes, however, are shorter and less branched than those of layer 2/3 PNs (brackets, inset). L) Quantitative comparisons of WT and LgDel layer 5/6 PN axon and dendrite length and branching; all measures in the two genotypes are statistically indistinguishable (p>0.3). All graphs represent mean values +SEM. Scale bar 100 μm for 3B, C, F, G and 25 μm for 3D, J, and K.
Figure 4:
Figure 4:
LgDel layer 2/3 PN growth and differentiation is disrupted in vivo. A) A schematic of the genetic strategy used to selectively and sparsely label WT and LgDel layer 2/3 PNs in vivo. Low doses of tamoxifen were given to P8 pups to elicit recombination of the floxed eGFP allele in a small subset of layer 2/3 PNs. B) Selectively genetically labeled individual WT layer 2/3 PNs in 2D projections of confocal 3D image sets. Dendritic branching is frequent, and arborization is extensive. C) Selectively genetically labeled LgDel layer 2/3 PNs in 2D projections of confocal 3D image sets. Dendritic branching, especially for the apical dendrite, appears diminished, and the terminal portion of some apical dendrites (large arrows) are beaded, a sign of apical dendritic retraction (inset). D) Quantitative comparison between WT and LgDel layer 2/3 PNs of apical dendrite length (*p<0.0001), and branching (*p<0.0002), as well as basal dendritic length (n.s.; no significant differences) and branching (n.s.). Maximum branch order was significantly reduced for LgDel apical dendrites (*p<0.0042) as well as basal dendrites (*p<0.0264). All graphs represent mean value + SEM. Scale bar 25 μm.
Figure 5:
Figure 5:
Increased Reactive Oxygen Species (ROS) underlies LgDel layer 2/3 PN growth deficits. A) Mitochondrial (Mito) ROS levels, detected with the ROS specific probe mitoSOX, are elevated in LgDel layer 2/3 PNivt. Mitochondria in LgDel 2/3 PNivt are more intensely and frequently labeled. Densitometric quantification in spinning-disk confocal images of individual live WT and LgDel layer 2/3 PNivt (right) confirms apparent differences in ROS levels in the two genotypes (*p<0.0001). B) Cytosolic (Cell) ROS, detected with the cellROX probe, shows enhancement of ROS levels in cell bodies and processes of LgDel layer 2/3 PNivt, similar to the change in mitochondrial ROS (*p< 0.0001). C) mitoSOX levels do not differ significantly (ns) in E14.5 (5/6 PNivt) cortical cultures between genotypes. D) Schematic of anti-oxidant activities of Pyruvate (Pyr), and N-acetylcysteine (NAC) used to assess mitochondrial dysregulation in LgDel PNivt. Pyr acts as a metabolic feedstock (1) by generating AcetylCoA that can directly enter the TCA Cycle. Furthermore, Pyr can directly reduce ROS formed during oxidative phosphorylation (2). NAC directly reduces ROS (3) while also providing cysteine required in the synthesis of Glutathione (GSH), which reduces hydrogen peroxides via the TRX/PRX pathway (4). E) Pyr restores mitoSOX in LgDel layer 2/3 PNivt to WT levels, confirmed by densitometric measurement in live cells (right; *p<0.046). F) NAC restores mitoSOX labeling in LgDel layer 2/3 PNs to WT levels, (right; *p<0.0001). Images in (E) and (F) were collected and processed identically. Dotted lines (right panels) in (E) and (F) indicate outlines of imaged layer 2/3 PNivt where mitoSOX labeling has diminished to low levels compared to untreated LgDel layer 2/3 PNivt. G) Axon and dendrite differentiation in WT+Pyr and LgDel+Pyr treated layer 2/3 PNivt are indistinguishable. H) WT+NAC and LgDel+NAC treated layer 2/3 PNivt are indistinguishable. I) Pyr and NAC restore LgDel layer 2/3 PNivt axon and dendrite length to WT levels. Quantification of total axon and dendritic length in untreated WT, as well as Pyr or NAC treated WT and LgDel layer 2/3 PNivt (LgDel & LgDel+Pyr: *p<0.0004, axons; *p<0.0001, dendrites; LgDel & LgDel+NAC: *p<0.0047, axons; *p<0.0461, dendrites). All graphs represent mean values +SEM. Scale bar 5 μm for 5A, B, E, and F. 10 μm for 5C. 50 μm for 5G, and H.
Figure 6:
Figure 6:
Txnrd2 regulates ROS levels, axonal and dendritic growth in layer 2/3 PNivt. A) shRNA-mediated diminished expression (knock-down) of six mitochondrial localized 22q11 genes (Maynard et al., 2008) in LgDel in WT layer 2/3 PNivt. Knock-down of only one gene, Txnrd2, recapitulates LgDel axon and dendrite growth deficits (*p<0.0084), and does so at similar magnitudes seen in LgDel. The mitochondrial ribosomal protein Mrpl40, when depleted, results in a significant increase of axon, but not dendrite length in WT layer 2/3 PNs (*p<0.0049). B) Txnrd2 protein (red) is expressed in a pattern consistent with mitochondrial localization in layer 2/3 PNivt based upon substantial co-localization with the mitochondrial marker Apoptosis Inhibitory Factor (AIF; green) in the cell body and initial segment of neurites. Inset single channel, higher magnification images of Txnrd2 (red) and AIF (green) showing punctate, presumed mitochondrial labeling from a proximal neurite of the layer 2/3 PNivt shown at low power in (B). C) Differences in axon and dendrite growth in non-sense shRNA control (NS-shRNA) and sh-Txnrd2 electroporated layer 2/3 PNs. D) Enhanced mitoSox labeling of mitochondrial ROS in sh-Txnrd2 electroporated WT layer 2/3 PNs (*p,0.0058). E) Enhanced cellROX labeling of cytosolic ROS in sh-Txnrd2 electroporated WT layer 2/3 PNs (*p,0.042). F) NAC-mediated rescue of diminished axon and dendrite growth of sh-Txnrd2 electroporated WT layer 2/3 PNs. NAC restores sh-Txnrd2 layer 2/3 PN axon and dendrite lengths to WT levels, dotted lines, no significant difference (ns). As for non-electroporated WT layer 2/3 PNs, NAC treatment decreases NS-shRNA axon and dendrite growth. G) Txnrd2 re-expression restores LgDel layer 2/3 PN axon and dendrite growth. H, I) Txnrd2 re-expression restores mitochondrial and cytosolic ROS to WT levels in LgDel layer 2/3 PNivt. Insets adjacent to (H) Txnrd2-electroporated cells (t; green) have low levels of mitoSOX (red); untransfected cells (u, not green) have high levels of ROS (red). Insets adjacent to (I): Txnrd2-electroporated cells (t; red) have low levels of cellROX (green); untransfected cells (u, not red) have high levels of ROS (green). At right of (H) and (I) quantification confirms restoration of mitochondrial and intracellular ROS by Txnrd2 re-expression (* p<0.0001). J) Txnrd2 protein (red) in cortical PNs is enhanced in layer 2/3 PNs. The insets, imaged at identical gain, show at higher magnification enhanced Txnrd2 (cytoplasmic labeling; red) in Satb2 expressing (nuclear labeling; green) layer 2/3 (arrowhead) versus 5/6 PNs. K) In P21 layer 2/3 PNs, Txnrd2 protein (punctate cytoplasmic labeling; red) co-localizes with Uqcrc1 (green), a mitochondrial marker. At right, higher magnification images of a single layer 2/3 PN shows Txnrd2 (red; top) labeling of a single layer 2/3 PN as well as the coincident Uqcrc1 labeling in the same neuron (green, bottom). Insets Punctate, presumed mitochondrial, labeling for Txnrd2 (red, top) and Uqcr1 (green, bottom). In the middle panel, arrows indicate punctate co-localization of Txnrd2 and Uqcrc1 in presumed individual mitochondria. L) Apical dendrite length and dendritic branching is significantly decreased in sparsely recombined, eYFP, individual Txnrd2+/− layer 2/3 PNs in vivo, in an otherwise P21 WT mouse compared to WT controls. Apical dendrite retraction is not seen (arrows). Quantification confirms that this decline (apical dendrite length *p<0.0077; apical branch points *p<0.0007; apical max branch order *p<0.0225; basal max branch order *p<0.02) is similar to that in LgDel layer 2/3 PNs in vivo. Pink, shaded horizontal bands on each histogram indicate mean LgDel (LD) values (see Figure 4D) ± S.E.M. All histogram data represent mean values + SEM. Scale bar 10 μm for 6B. 50 μm for 6C, F, and G. 2.5 μm for 6D, and E. 25 μm for 6L.
Figure 7:
Figure 7:
NAC rescues neuronal and synaptic deficits in Txnrd2+/− and LgDel PNs. A, B) NAC, administered from birth onward, restores dendrite length and branching deficits in sparsely recombined Txnrd2+/− and LgDel layer 2/3 PNs in vivo to WT levels, but does not compromise WT layer 2/3 PN differentiation. The blue, green, and pink shaded horizontal bands indicate mean values, ± S.E.M, for untreated WT (blue), LgDel (LD, pink) and Txnrd2+/− (T2, green) neurons (see Figure 4D, 6L). C, D) NAC administered from birth onward restores cytological and synaptic integrity of LgDel layer 2/3 PNs. Mitochondrial and cytoskeletal elements (C1,2; D1,2) and synapses (C3,4; D3,4) are indistinguishable in the two genotypes. E) Quantitative analysis of mitochondrial frequency, synapse frequency, and synaptic vesicle density confirms restoration of layer 2/3 PN and neuropil cellular and synaptic integrity. Blue (WT) and pink (LD: LgDel) horizontal bands indicate values for untreated layer 2/3 PNs (see Figure 2E). F) NAC, administered from birth onward, restores deficits in visual reversal learning in LgDel mice to WT levels (*p=0.005; *p=0.0385 2-way ANOVA, reversal session 1–4 scores × genotype, Holm-Sidak). The blue and pink horizontal bars provide a visual indication of the mean sessions to criterion values, ± SEM, for untreated WT and LgDel (LD) mice, respectively. All histogram data represent mean values + SEM. Scale bar 25 μm for 7A. 5 μm for 7C.
Figure 8:
Figure 8:
Mitochondrial regulation of cortico-cortical connectivity in developing and adult association cortices. Top Row; left to right: Normal quantitative connectivity is established by layer 2/3 projection neurons that extend axons between distal as well as local association areas. These connections rely critically upon mitochondria-mediated metabolic homeostasis for initial growth and elaboration of axons and dendrites, as well as cytological and synaptic integrity. The mitochondrial enzyme, Thioredoxin-reductase 2, a regulator of reactive oxygen species clearance in the mitochondrial matrix, is key in regulating layer 2/3 projection neuron growth and cortico-cortical connections made by these neurons. Finally, when long distance cortico-cortical connections, in this instance between medial frontal and lateral entorhinal association cortices, are quantitatively sufficient, mice perform optimally on a complex cognitive task, visual reversal learning. Bottom Row: left to right: Disruption of mitochondrial regulation of ROS levels due to diminished Txnrd2 dosage in the LgDel mouse model of 22q11.2 Deletion Syndrome reduces connectivity by selectively compromising layer 2/3 PN growth and synaptic differentiation. These ROS-dependent quantitative changes are rescued by Txnrd2 re-expression in vitro, or by the ROS scavenger N-acetyl cysteine in vitro or in vivo. The restoration of several aspects of mitochondria-regulated layer 2/3 PN cortico-cortical connectivity is accompanied by restored performance on the visual reversal task.

Comment in

References

    1. Ahlemeyer B, and Baumgart-Vogt E (2005). Optimized protocols for the simultaneous preparation of primary neuronal cultures of the neocortex, hippocampus and cerebellum from individual newborn (P0.5) C57Bl/6J mice. J Neurosci Methods 149, 110–120. - PubMed
    1. Alcamo EA, Chirivella L, Dautzenberg M, Dobreva G, Farinas I, Grosschedl R, and McConnell SK (2008). Satb2 regulates callosal projection neuron identity in the developing cerebral cortex. Neuron 57, 364–377. - PubMed
    1. Aruoma OI, Halliwell B, Hoey BM, and Butler J (1989). The antioxidant action of N-acetylcysteine: its reaction with hydrogen peroxide, hydroxyl radical, superoxide, and hypochlorous acid. Free radical biology & medicine 6, 593–597. - PubMed
    1. Atkuri KR, Mantovani JJ, Herzenberg LA, and Herzenberg LA (2007). N-Acetylcysteine:--a safe antidote for cysteine/glutathione deficiency. Current opinion in pharmacology 7, 355–359. - PMC - PubMed
    1. Bannister AP (2005). Inter- and intra-laminar connections of pyramidal cells in the neocortex. Neuroscience research 53, 95–103. - PubMed

Publication types

MeSH terms