. 2019 Jun 6;104(6):1073-1087.
doi: 10.1016/j.ajhg.2019.04.002. Epub 2019 May 9.

Bi-allelic Variants in DYNC1I2 Cause Syndromic Microcephaly with Intellectual Disability, Cerebral Malformations, and Dysmorphic Facial Features

Affiliations

Bi-allelic Variants in DYNC1I2 Cause Syndromic Microcephaly with Intellectual Disability, Cerebral Malformations, and Dysmorphic Facial Features

Muhammad Ansar et al. Am J Hum Genet. .

Abstract

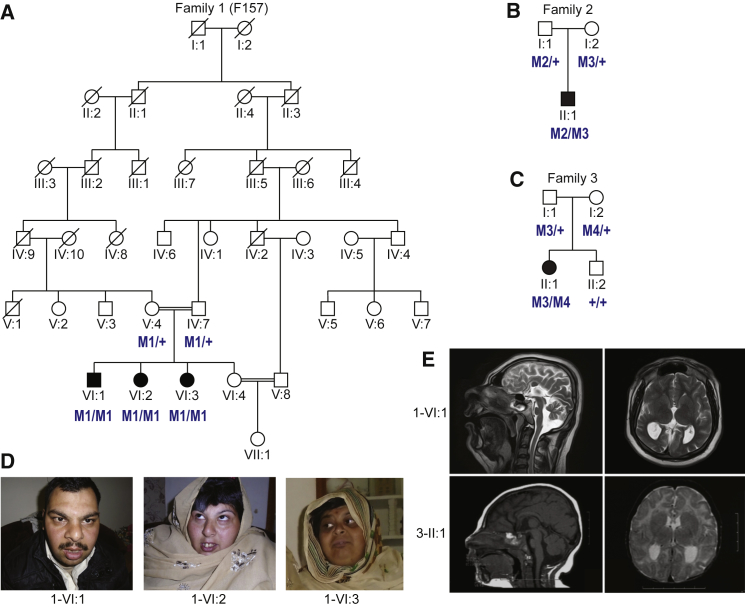
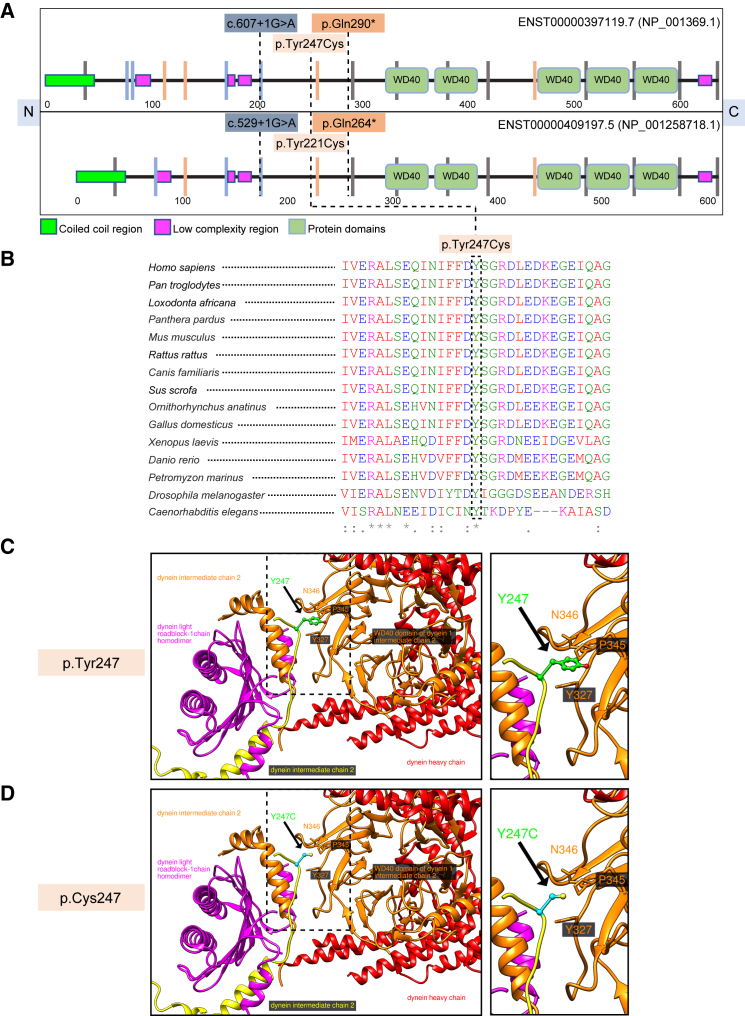
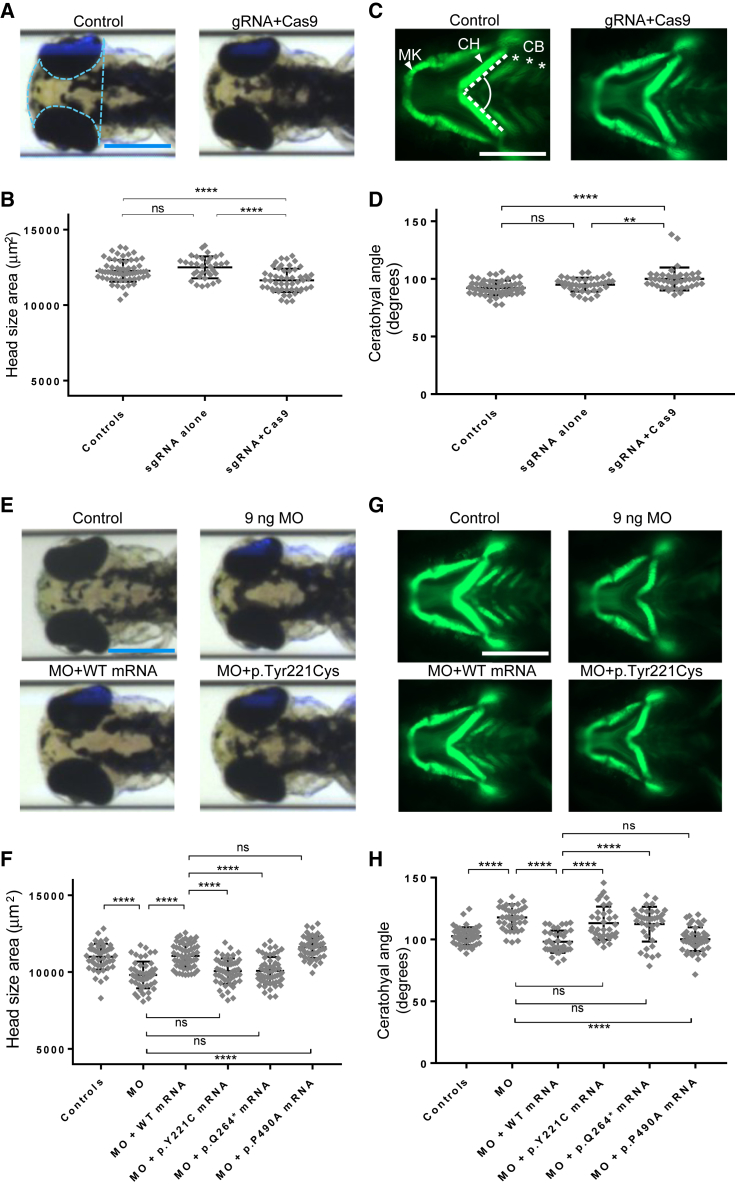
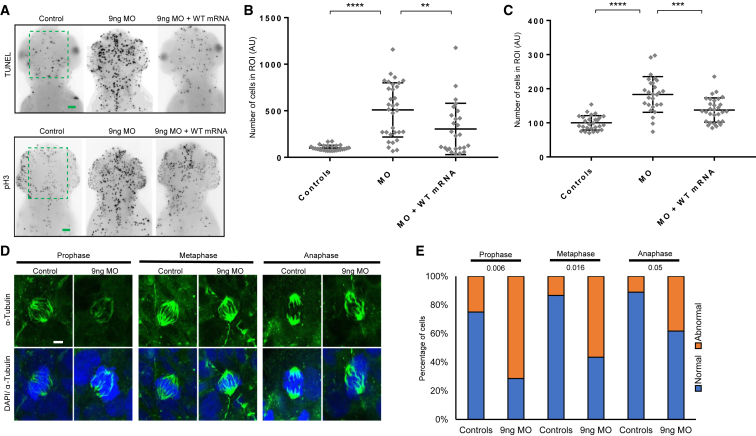
Cargo transport along the cytoplasmic microtubular network is essential for neuronal function, and cytoplasmic dynein-1 is an established molecular motor that is critical for neurogenesis and homeostasis. We performed whole-exome sequencing, homozygosity mapping, and chromosomal microarray studies in five individuals from three independent pedigrees and identified likely-pathogenic variants in DYNC1I2 (Dynein Cytoplasmic 1 Intermediate Chain 2), encoding a component of the cytoplasmic dynein 1 complex. In a consanguineous Pakistani family with three affected individuals presenting with microcephaly, severe intellectual disability, simplification of cerebral gyration, corpus callosum hypoplasia, and dysmorphic facial features, we identified a homozygous splice donor site variant (GenBank: NM_001378.2:c.607+1G>A). We report two additional individuals who have similar neurodevelopmental deficits and craniofacial features and harbor deleterious variants; one individual bears a c.740A>G (p.Tyr247Cys) change in trans with a 374 kb deletion encompassing DYNC1I2, and an unrelated individual harbors the compound-heterozygous variants c.868C>T (p.Gln290) and c.740A>G (p.Tyr247Cys). Zebrafish larvae subjected to CRISPR-Cas9 gene disruption or transient suppression of dync1i2a displayed significantly altered craniofacial patterning with concomitant reduction in head size. We monitored cell death and cell cycle progression in dync1i2a zebrafish models and observed significantly increased apoptosis, likely due to prolonged mitosis caused by abnormal spindle morphology, and this finding offers initial insights into the cellular basis of microcephaly. Additionally, complementation studies in zebrafish demonstrate that p.Tyr247Cys attenuates gene function, consistent with protein structural analysis. Our genetic and functional data indicate that DYNC1I2 dysfunction probably causes an autosomal-recessive microcephaly syndrome and highlight further the critical roles of the dynein-1 complex in neurodevelopment.

Keywords: DYNC1I2; apoptosis; autosomal recessive; developmental delay; dynein; dysmorphic facial features; intellectual disability; microcephaly; mitotic spindle; zebrafish.


Figures

Figure 1
Figure 1
Segregation of Rare DYNC1I2 Variants in Three Pedigrees with Overlapping Neurodevelopmental Phenotypes (A–C) Pedigrees showing segregation of rare deleterious DYNC1I2 variants. The variants, named according to GenBank: NM_001378.2, are coded as: M1, c.607+1G>A; M2, 374 kb deletion at 2q31.1; M3, c.740A>G (p.Tyr247Cys); and M4, c.868C>T (p.Gln290). Unfilled and shaded shapes denote healthy and affected individuals, respectively. Squares represent males, circles represent females, and double horizontal lines represent consanguineous marriage. (D) Photographs of three affected individuals (VI:1, VI:2, and VI:3) in family 1. (E) Representative MRI images of an affected individual (VI:1, age 20 years; T-2 weighted) from family 1 and an affected individual (II-1, age 8 months; T-1 weighted) from family 3.
Figure 2
Figure 2
DYNC1I2 Protein Schematic, Multiple Sequence Alignment, and Molecular Modeling of the Recurrent p.Tyr247Cys Variant (A) Top, a schematic diagram of the DYNC1I2 (GenBank: NP_001369.1) protein sequence showing the location of three variants, c.607+1G>A, c.740A>G (p.Tyr247Cys), and c.868C>T (p.Gln290), found in affected individuals from three different families. Bottom, a schematic diagram of the DYNC1I2 (GenBank: NP_001258718.1) protein sequence showing the location of the same three variants, c.529+1G>A, c.662A>G (p.Tyr221Cys), and c.790C>T (p.Gln264), in the most abundantly expressed isoform that we used in our zebrafish experiments. The schematic was adapted from SMART. N = amino terminus; C = carboxy terminus; and vertical lines indicate intron position and phase (gray = phase 0; blue = phase 1; and orange = phase 2). (B) A multiple-sequence alignment generated with Clustal Omega showing conservation of the missense variant. The amino acid color scheme is: red = hydrophobic or aromatic (AVFPMILWY); blue = acidic (DE); magenta = basic (RHK); and green = hydroxyl, amine, basic, and glutamine (STYHCNGQ). Asterisks () indicate conserved sequence identity and (:) indicates amino acid similarity. (C) A model of the position of GenBank: NP_0011378.2 p.Tyr247 residue (green) of DYNC1I2 in the 6F1T cryo-EM structure of the dynein-dynactin complex. The residue is located on the linker, and its side chain is pointing toward the WD40 domain (orange). The linker seems to be involved in the homodimerization and in the interactions of the WD40 domain with the light roadblock chain of dynein (magenta). (D) Modeling of the GenBank: NP_0011378.2 p.Tyr247Cys (cyan) mutant in the 6F1T cryo-EM structure of dynein/dynactin complex. The mutation to Cys might also influence the folding process and change the structure of the DYNC1I2 protein, impairing its interactions in the complex. Panels C and D show an overview (left) and a magnified view, outlined by a dashed line (right).
Figure 3
Figure 3
Zebrafish Models of dync1i2a Disruption Display Neuroanatomical and Craniofacial Patterning Defects, and GenBank: NM_001271789.1: c.662A>G (p.Tyr221Cys) Is a Loss-of-Function Variant (A) Representative dorsal bright field images of control and F0 mutant larvae. (B) Quantification of head size area in F0 mosaic mutants (C) Representative ventral images of the GFP signal in the anterior region of -1.4col1a1:egfp transgenic reporters for control and F0 mutant larvae. Abbreviations are as follows: MK = Meckel’s cartilage; CH = ceratohyal cartilage; and CB = ceratobranchial arches. (D) Quantification of the CH angle in F0 mutants (E) Representative dorsal bright field images of control, e2i2 morphant (MO), WT, or mutant mRNA rescue larvae. (F) Quantification of complementation assays that used head size as a phenotype readout; p.P490A is a negative control variant (dbSNP: rs767705533, 2 homozygotes in ∼120,000 individuals in gnomAD) (G) Representative ventral images of the GFP signal in the anterior region of -1.4col1a1:egfp transgenic reporters for control, e2i2 morphant, WT, or mutant mRNA rescue larvae. (H) Quantification of complementation assays that used the CH angle as a phenotype readout; data are concordant with the scoring of head size. All phenotyping was performed at 3 days post-fertilization. The pale blue dotted line in panel A indicates the area measured to obtain the data in panels B and F. The angle indicated between the dashed white lines in panel C indicates the measurement used to obtain data for panels D and H. Scale bars in panels A, C, E, and G represent 300 μm; image sizing is consistent across panels. ∗∗∗∗p < 0.0001; ∗∗p < 0.01; and ns = not significant; n = 40–67/condition, and three biological replicates showed similar results for data shown in panels B, D, F, and H. Error bars represent standard deviation of the mean. Note that the amino acid codons Y221C, Q264, and P490A of the most abundant isoform (GenBank: NM_001271789.1) used in the zebrafish experiments correspond to Y247C, Q290, and P516A of the longest isoform (GenBank: NM_001378.2) of DYNC1I2.
Figure 4
Figure 4
Apoptosis, Altered Cell Cycle Progression, and the Effect on Mitotic Spindle Organization in dync1i2a Morphants (A) Representative dorsal inverted fluorescent images showing TUNEL-positive cells (top) and phospho-histone H3 (pH3) immunostained cells (bottom) in controls, e2i2 morphants (MO), and WT mRNA rescue animals. The green dashed box indicates the region of interest (ROI) quantified in panels B and C. The scale bars represent 30 μm, and there is consistent image sizing across panels. (B) Quantification of TUNEL-positive cells as a readout of apoptosis; n = 30–35/condition; repeated twice with similar results. (C) Quantification of pH3-positive cells as an indicator of cell cycle progression (G2/M transition); n = 28–32/condition; repeated twice with similar results. In panels B and C, experiments were performed on larvae at 2 days post-fertilization (dpf). ∗∗∗∗p < 0.0001; ∗∗∗p < 0.0001; and ∗∗p < 0.01; error bars represent standard deviation of the mean. (D) Representative confocal microscope images of fluorescently stained dividing cells scored at three different stages of the cell cycle on the spinal cord of wholemount embryos at 1 dpf. α-tubulin marks mitotic spindles and DAPI indicates nuclei. The scale bar represents 2 μm. (E) Qualitative scoring of the embryos shown in panel D for the appearance of normal versus abnormal mitotic spindle organization. Stages of mitosis were defined as follows: prophase = chromosomes are condensed, centrosomes are at opposite poles, and spindle fibers begin to emerge; metaphase = chromosomes are lined up at the metaphase plate, and each chromatid is attached to a spindle fiber; and Anaphase = chromatids are pulled to opposite poles, and the cell is elongated. If a cell displayed misalignment of poles and/or uneven distribution of spindle fibers to chromosomes it was scored as abnormal. P values showing statistical differences between controls versus morphants are shown at the top of the chart. n = 33–42 embryos/condition; repeated.

References

    1. Akhmanova A., Hammer J.A., 3rd Linking molecular motors to membrane cargo. Curr. Opin. Cell Biol. 2010;22:479–487. - PMC - PubMed
    1. Fu M.M., Holzbaur E.L. Integrated regulation of motor-driven organelle transport by scaffolding proteins. Trends Cell Biol. 2014;24:564–574. - PMC - PubMed
    1. Pfister K.K. Distinct functional roles of cytoplasmic dynein defined by the intermediate chain isoforms. Exp. Cell Res. 2015;334:54–60. - PMC - PubMed
    1. Kuta A., Deng W., Morsi El-Kadi A., Banks G.T., Hafezparast M., Pfister K.K., Fisher E.M. Mouse cytoplasmic dynein intermediate chains: Identification of new isoforms, alternative splicing and tissue distribution of transcripts. PLoS ONE. 2010;5:e11682. - PMC - PubMed
    1. Roberts A.J. Emerging mechanisms of dynein transport in the cytoplasm versus the cilium. Biochem. Soc. Trans. 2018;46:967–982. - PMC - PubMed

Publication types

MeSH terms