. 2019 Jun:24:30-43.
doi: 10.1016/j.molmet.2019.03.005. Epub 2019 Mar 15.

Heterogeneity in the perirenal region of humans suggests presence of dormant brown adipose tissue that contains brown fat precursor cells

Affiliations

Heterogeneity in the perirenal region of humans suggests presence of dormant brown adipose tissue that contains brown fat precursor cells

Naja Z Jespersen et al. Mol Metab. 2019 Jun.

Abstract

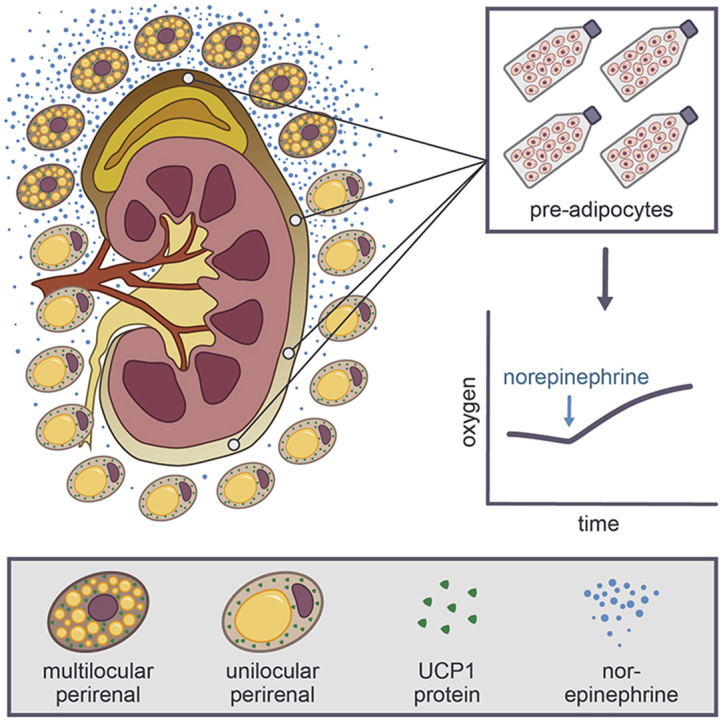
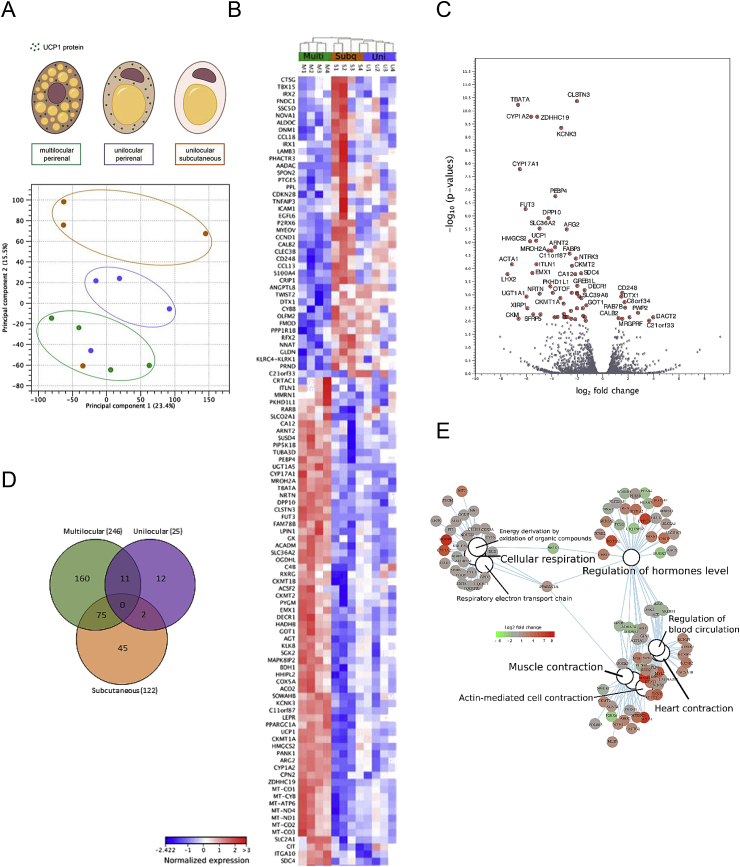
Objective: Increasing the amounts of functionally competent brown adipose tissue (BAT) in adult humans has the potential to restore dysfunctional metabolism and counteract obesity. In this study, we aimed to characterize the human perirenal fat depot, and we hypothesized that there would be regional, within-depot differences in the adipose signature depending on local sympathetic activity.

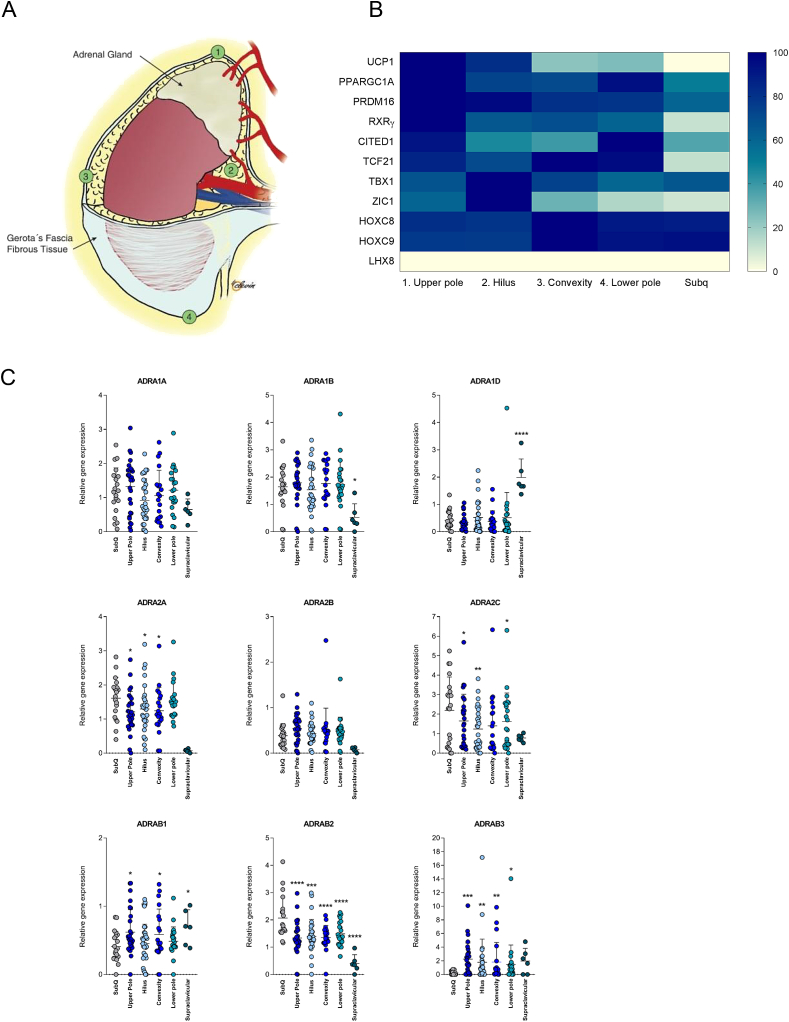
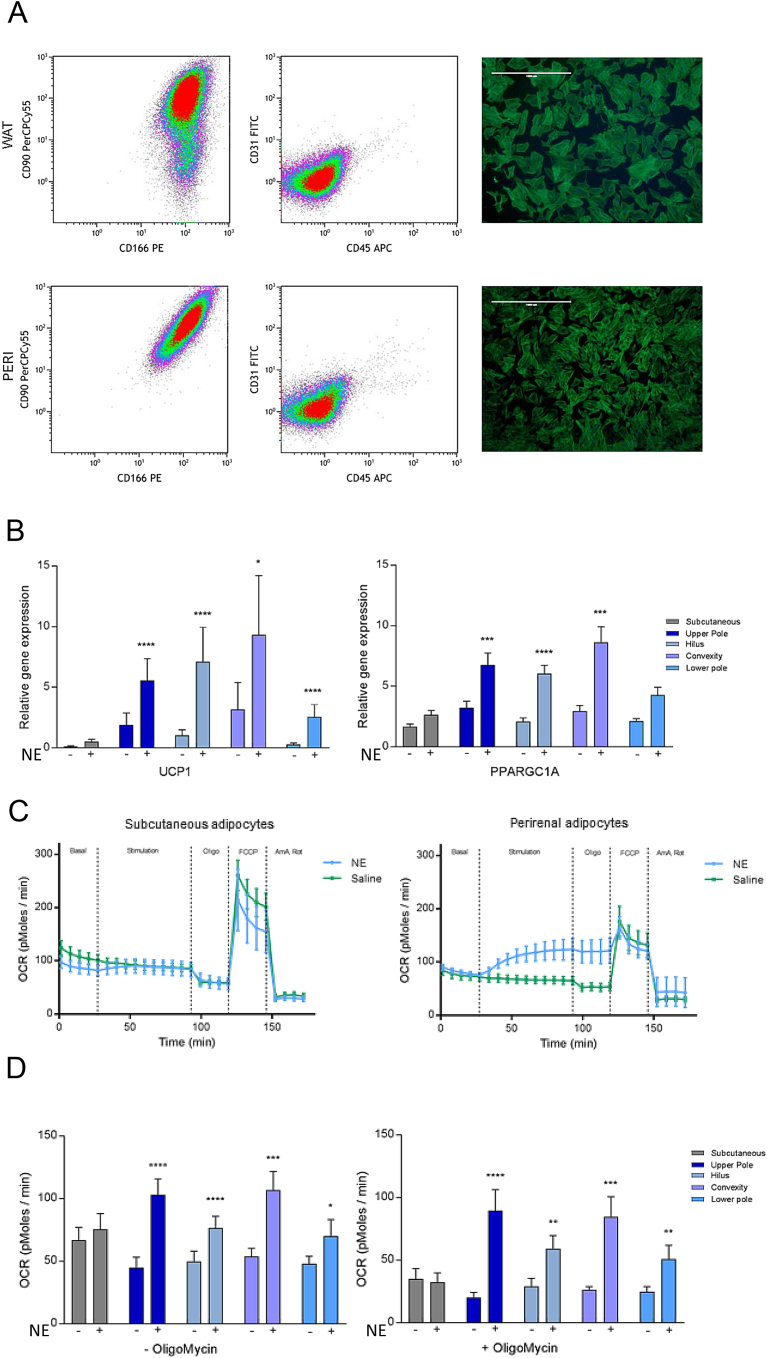
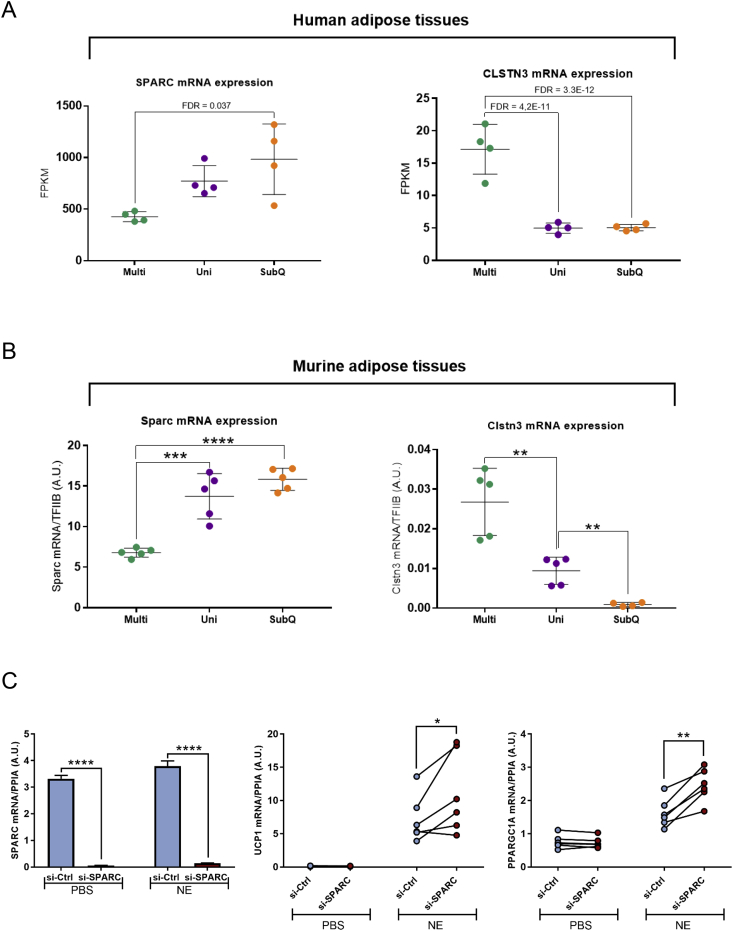
Methods: We characterized fat specimens from four different perirenal regions of adult kidney donors, through a combination of qPCR mapping, immunohistochemical staining, RNA-sequencing, and pre-adipocyte isolation. Candidate gene signatures, separated by adipocyte morphology, were recapitulated in a murine model of unilocular brown fat induced by thermoneutrality and high fat diet.

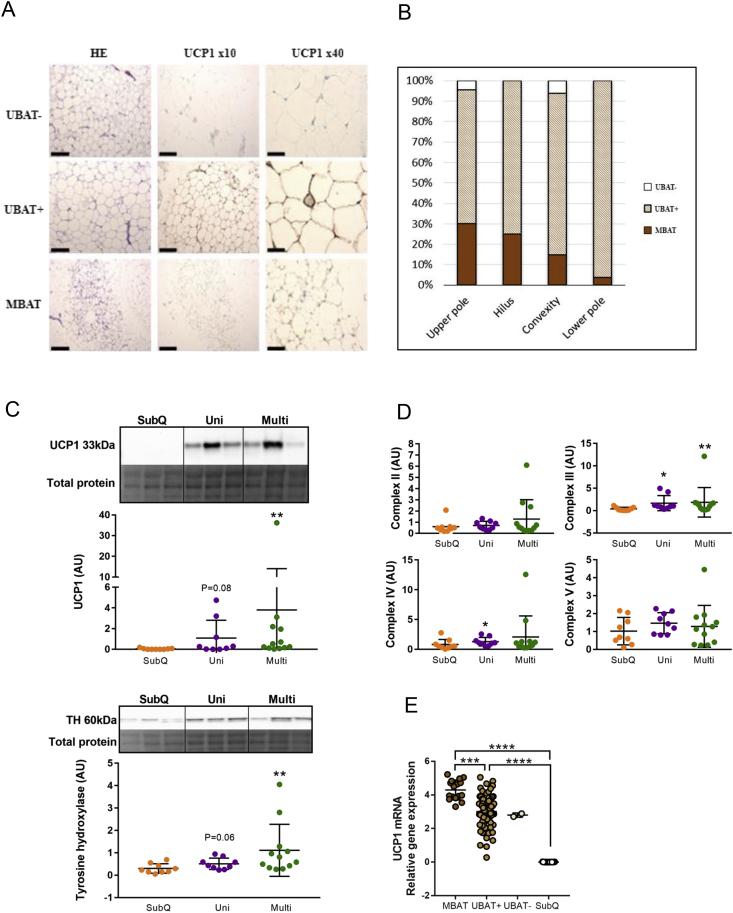
Results: We identified widespread amounts of dormant brown adipose tissue throughout the perirenal depot, which was contrasted by multilocular BAT, primarily found near the adrenal gland. Dormant BAT was characterized by a unilocular morphology and a distinct gene expression profile, which partly overlapped with that of subcutaneous white adipose tissue (WAT). Brown fat precursor cells, which differentiated into functional brown adipocytes were present in the entire perirenal fat depot, regardless of state. We identified SPARC as a candidate adipokine contributing to a dormant BAT state, and CLSTN3 as a novel marker for multilocular BAT.

Conclusions: We propose that perirenal adipose tissue in adult humans consists mainly of dormant BAT and provide a data set for future research on factors which can reactivate dormant BAT into active BAT, a potential strategy for combatting obesity and metabolic disease.

Keywords: Brown fat precursor cells; Dormant brown fat; Human brown fat; Perirenal adipose tissue; Sympathetic activation.


Figures

Image 1
Graphical abstract
Figure 1
Figure 1
qPCR profiling of perirenal adipose tissue. (A) The human kidney with numbers annotating the regions for the obtained surgical biopsies: 1 = upper kidney pole, 2 = hilus, 3 = convexity and 4 = lower kidney pole. A subcutaneous fat biopsy was obtained from the incision site at the abdomen. (B) Heatmap illustrating relative gene expression levels of marker genes measured by using qPCR. Regions are sorted based on UCP1 expression. (C) Gene expression profiling of adrenergic receptors by using qPCR. Individual values are shown and data are presented as mean with error bars representing standard deviation (SD). * = P < 0.05, ** = P < 0.01, *** = P < 0.001, **** = P < 0.0001.
Figure 2
Figure 2
Characterization of adipogenic progenitors derived from perirenal fat of adults. Adipogenic progenitors were isolated from the four regions of the perirenal depot, as depicted in Figure 1, and from the subcutaneous depot. (A) Representative density plots for adipogenic characterization by using Flow cytometry, and pre-adipocytes at 4X magnification, stained with fluorescently-labeled phalloidin and DAPI (scale bar = 1000 μm). (B) Gene expression response to 4 h of NE treatment of in vitro differentiated adipocytes from perirenal and subcutaneous regions. Data are presented as mean +/− standard error of the mean (SEM), * = P < 0.05, *** = P < 0.001 **** = 0.0001. (C) Representative traces of NE-induced uncoupled respiration of subcutaneous and perirenal adipocytes (D) Comparison of basal and NE-induced respiration in subcutaneous and perirenal adipocytes with and without the ATP synthase blocker oligomycin. Data are mean +/−SEM. * = p < 0.05, ** = P < 0.01, **** = p < 0.0001.
Figure 3
Figure 3
The brown fat phenotypes in perirenal tissue of adult humans. (A) Morphological and immunohistochemical evaluation of human perirenal fat. Representative H&E staining and UCP1 staining of areas with multilocular UCP1 positive brown adipose tissue (MBAT) unilocular BAT (UBAT+), and unilocular UCP1 negative BAT (UBAT-). Bar scale = 240 μm in left and middle panel and 60 μm in right panel. (B) Percentage distribution of MBAT, UBAT+ and UBAT-samples in the different perirenal regions. (C) UCP1 and Tyrosine hydroxylase (TH) western blotting. A section the total protein assessment is shown and was used for normalization. (D) mitochondrial OXPHOS western blotting. Complex I was too weak to quantify (Figure S3D). (E) UCP1 mRNA expression in groups based on histology data. Individual values are shown and data are mean +/− SD. When the error bar reached below 0, it was clipped by the GraphPad software and in these cases, only the upper error bar is shown and indicates the variation; *P < 0.05, **P < 0.01, ***P < 0.001.
Figure 4
Figure 4
RNA sequencing of multilocular and unilocular perirenal fat and subcutaneous fat. (A) Principal component analysis (PCA) plot based on all detected genes in RNA sequencing of multilocular perirenal, unilocular perirenal and unilocular subcutaneous adipose tissue samples (B) Heatmap of the most differentially expressed genes (FDR < 0.01) between the three tissue types. (C) Volcano plot ranking genes after -log10 p-value (y-axis) and log2 fold change (x-axis). Differentially expressed genes (p-value < 0.01) are shown with red dots. (D) Venn diagram demonstrating the number of specific/overlaps of differentially expressed genes (FDR < 0.01) for each of the three tissue types. (E) Category netplot generated by the clusterProfiler R package . This network plot shows the relationships between the genes associated with the top most significant GO terms (q-value < 0.05) and their corresponding significant fold changes (FDR < 0.01) from multilocular perirenal vs. unilocular perirenal comparison. The log2 foldchange color code is next to the network and the size of the GO terms reflects the q-values of the terms, with the more significant terms being larger.
Figure 5
Figure 5
Validation of candidate dormant BAT genes. (A) SPARC and CLSTN3 in multilocular perirenal fat (multi); unilocular perirenal fat (uni) and subcutaneous fat (subq). Data are adjusted gene counts (FPKM) and adjusted p-values (FDR) from the RNA sequencing analysis are annotated in the figure. Error bars represent SD. (B) Sparc and Clstn3 in a mouse model of dormant BAT. Gene expression analysis was performed by using qPCR. Data are mean +/− SD. Unpaired t-tests between multi IBAT and uni IBAT: *P < 0.05, **P < 0.01, ***P < 0.001. Paired t-tests between uni IBAT and uni IWAT $P < 0.05, $$P < 0.01, $$$P < 0.001. (C) Brown pre-adipocytes were transfected with siRNA targeting SPARC (si-SPARC) or with a non-targeting siRNA control (si-Ctrl) and stimulated with NE upon differentiation. Gene expression was measured using qPCR. Data are mean +/− SEM (SPARC) or individual values (UCP1 and PPARGC1A) *P < 0.05, **P < 0.01, ***P < 0.001.

References

    1. Cannon B., Nedergaard J. Brown adipose tissue: function and physiological significance. Physiological Reviews. 2004;84(1):277–359. - PubMed
    1. Saito M., Okamatsu-Ogura Y., Matsushita M., Watanabe K., Yoneshiro T., Nio-Kobayashi J. High incidence of metabolically active brown adipose tissue in healthy adult humans: effects of cold exposure and adiposity. Diabetes. 2009;58(7):1526–1531. - PMC - PubMed
    1. Cypess A.M., Weiner L.S., Roberts-Toler C., Elía E.F., Kessler S.H., Kahn P.A. Activation of human brown adipose tissue by a β3-adrenergic receptor agonist. Cell Metabolism. 2015;21(1):33–38. - PMC - PubMed
    1. Hanssen M.J.W., Hoeks J., Brans B., van der Lans A. a J.J., Schaart G., van den Driessche J.J. Short-term cold acclimation improves insulin sensitivity in patients with type 2 diabetes mellitus. Nature Medicine. 2015;21(July):6–10. - PubMed
    1. Chondronikola M., Volpi E., Borsheim E., Porter C., Annamalai P., Enerback S. Brown adipose tissue improves whole-body glucose homeostasis and insulin sensitivity in humans. Diabetes. 2014;63(12):4089–4099. - PMC - PubMed

Further reading

    1. Littell Ramon C., Milliken George A., Stroup W.W., Wolfinger Russell D., O.S. 2nd ed. SAS Institute Inc; Cary, NC: 2006. SAS for mixed models.

Publication types

MeSH terms