. 2019 May 16;177(5):1153-1171.e28.
doi: 10.1016/j.cell.2019.04.012. Epub 2019 May 9.

Slow Delivery Immunization Enhances HIV Neutralizing Antibody and Germinal Center Responses via Modulation of Immunodominance

Affiliations

Slow Delivery Immunization Enhances HIV Neutralizing Antibody and Germinal Center Responses via Modulation of Immunodominance

Kimberly M Cirelli et al. Cell. .

Erratum in

  • Slow Delivery Immunization Enhances HIV Neutralizing Antibody and Germinal Center Responses via Modulation of Immunodominance.
    Cirelli KM, Carnathan DG, Nogal B, Martin JT, Rodriguez OL, Upadhyay AA, Enemuo CA, Gebru EH, Choe Y, Viviano F, Nakao C, Pauthner MG, Reiss S, Cottrell CA, Smith ML, Bastidas R, Gibson W, Wolabaugh AN, Melo MB, Cossette B, Kumar V, Patel NB, Tokatlian T, Menis S, Kulp DW, Burton DR, Murrell B, Schief WR, Bosinger SE, Ward AB, Watson CT, Silvestri G, Irvine DJ, Crotty S. Cirelli KM, et al. Cell. 2020 Jan 9;180(1):206. doi: 10.1016/j.cell.2019.12.027. Cell. 2020. PMID: 31923396 Free PMC article. No abstract available.

Abstract

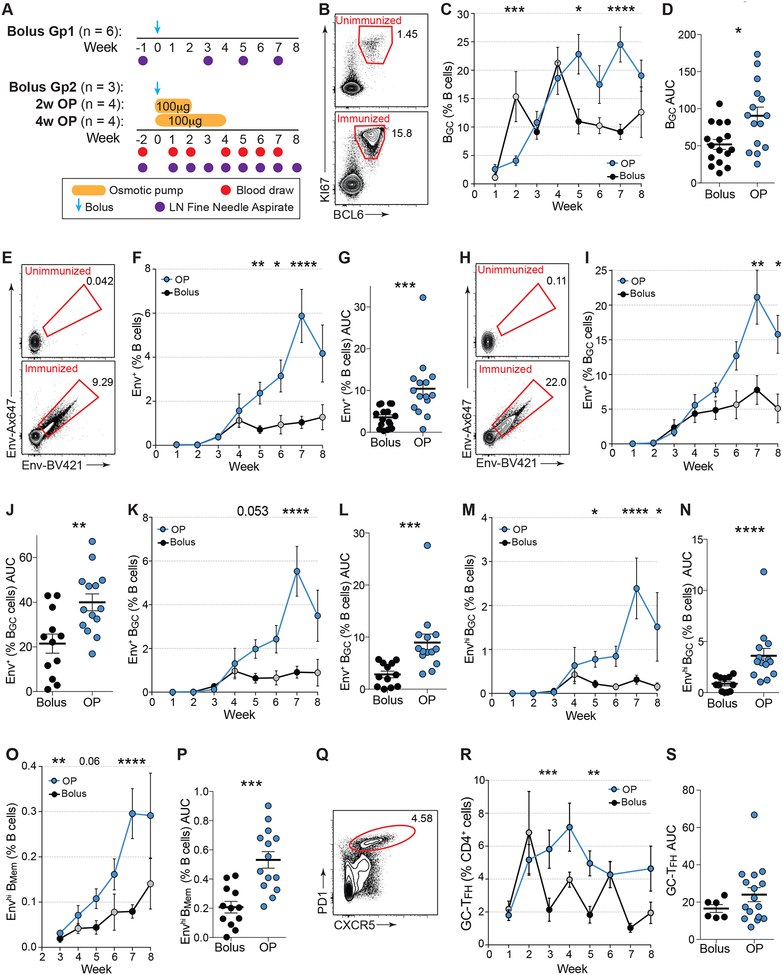
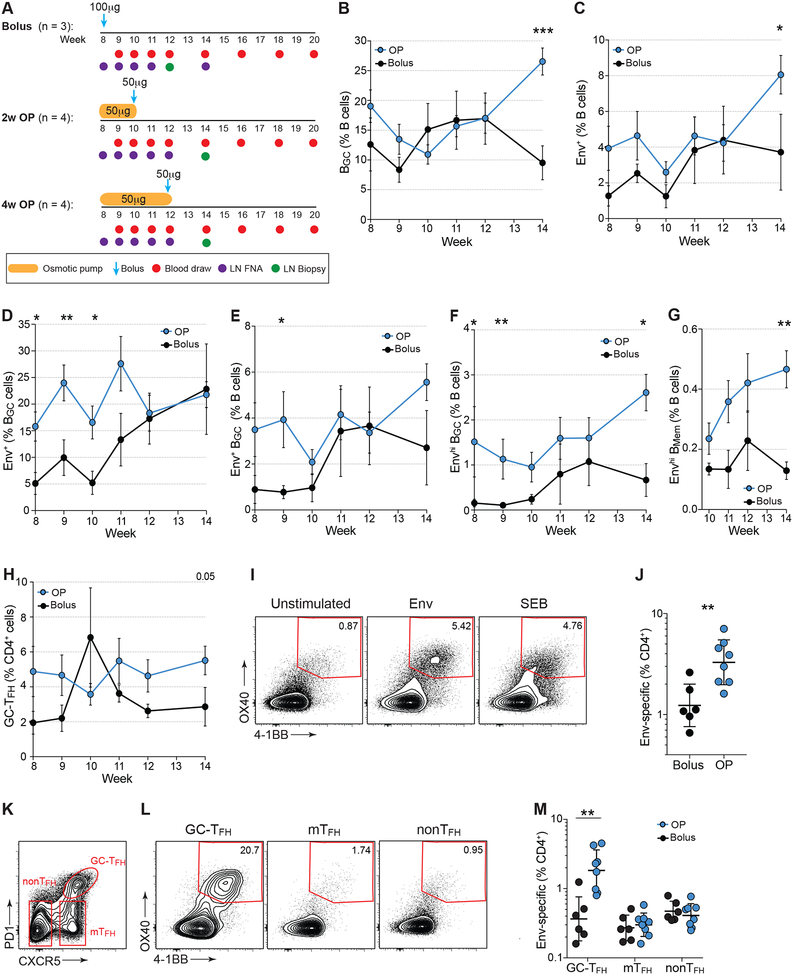
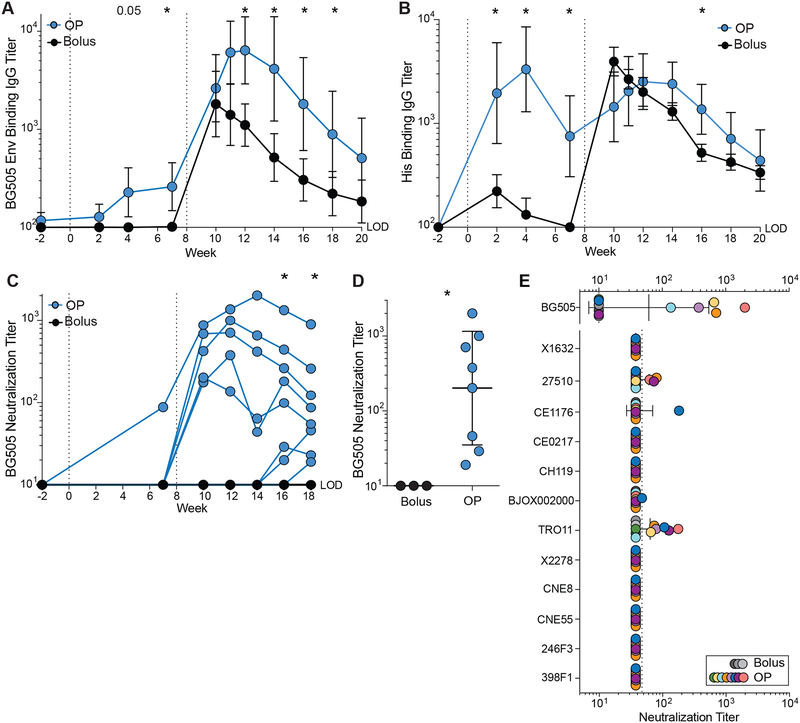
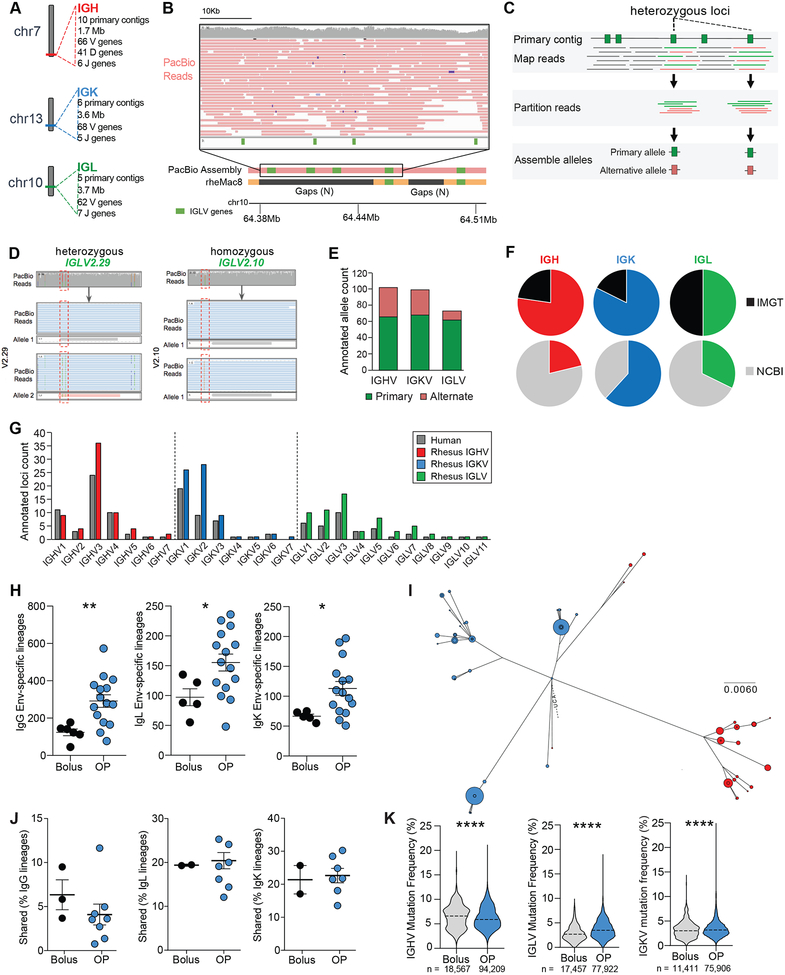
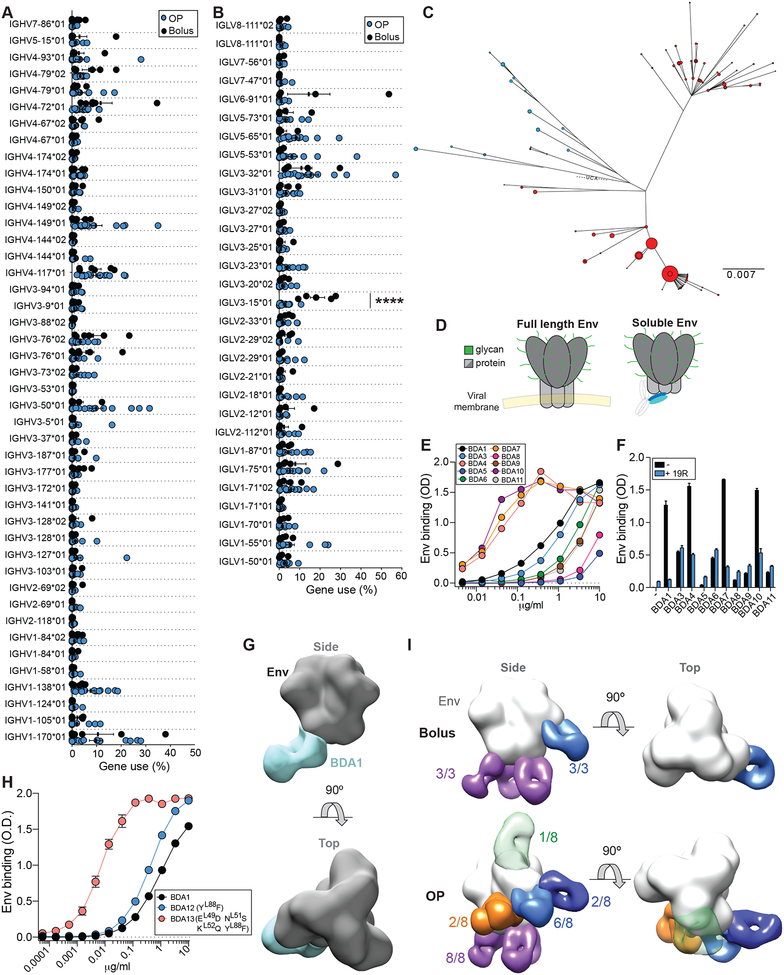
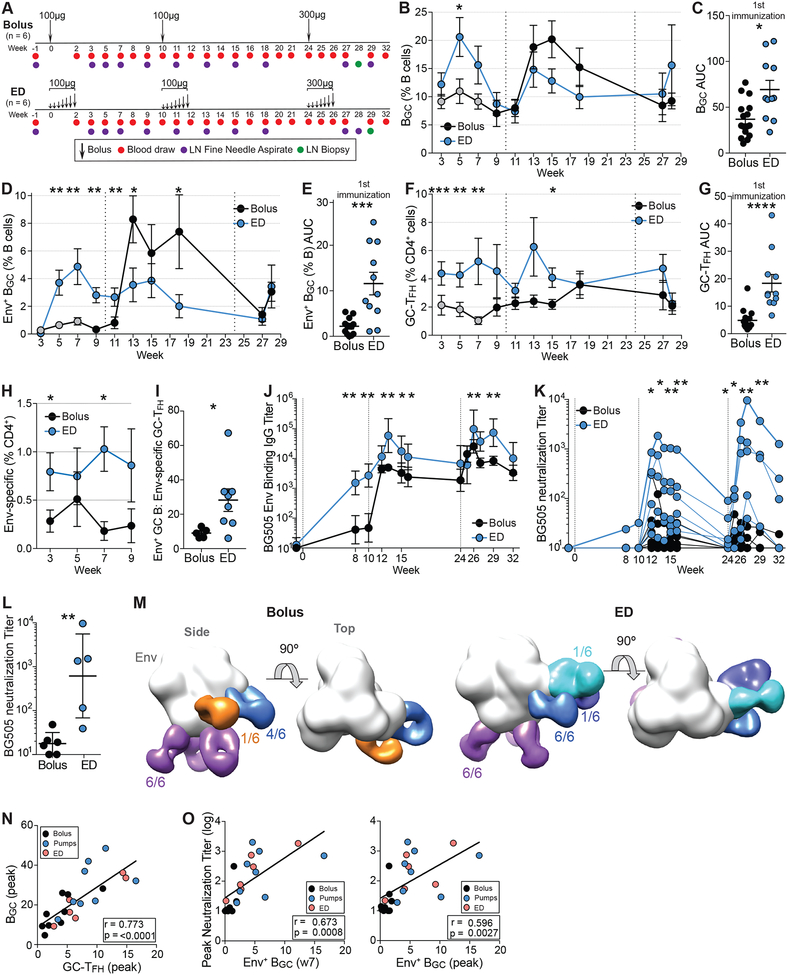
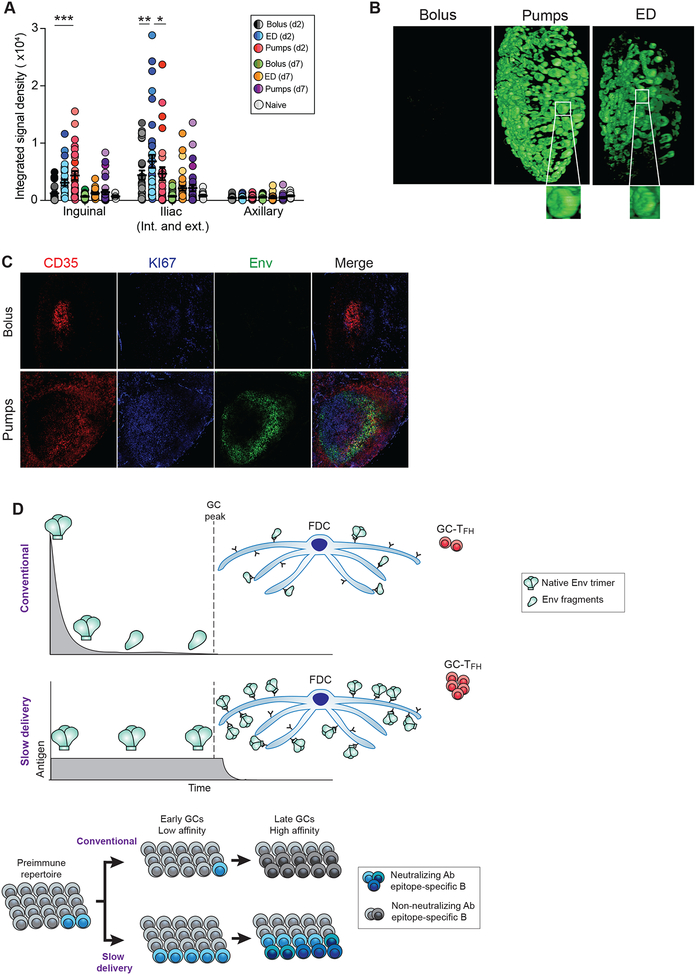
Conventional immunization strategies will likely be insufficient for the development of a broadly neutralizing antibody (bnAb) vaccine for HIV or other difficult pathogens because of the immunological hurdles posed, including B cell immunodominance and germinal center (GC) quantity and quality. We found that two independent methods of slow delivery immunization of rhesus monkeys (RMs) resulted in more robust T follicular helper (TFH) cell responses and GC B cells with improved Env-binding, tracked by longitudinal fine needle aspirates. Improved GCs correlated with the development of >20-fold higher titers of autologous nAbs. Using a new RM genomic immunoglobulin locus reference, we identified differential IgV gene use between immunization modalities. Ab mapping demonstrated targeting of immunodominant non-neutralizing epitopes by conventional bolus-immunized animals, whereas slow delivery-immunized animals targeted a more diverse set of epitopes. Thus, alternative immunization strategies can enhance nAb development by altering GCs and modulating the immunodominance of non-neutralizing epitopes.

Keywords: FNA; GC- T(FH); HIV vaccine; affinity maturation; immune complexes; memory B cells; non-human primates; rhesus macaque genome; somatic hypermutation.


Conflict of interest statement

DECLARATION OF INTERESTS

The authors declare no competing interests.

Figures

Figure 1.
Figure 1.. Sustained delivery immunization enhances BGC cell responses.
(A) Immunization and sampling schedule of first immunization. Bolus Group 2 (Gp2), 2w osmotic pump (OP), and 4w OP RMs were immunized and sampled at the same time. Bolus Gp1 were immunized and sampled separately. Bolus Gp1&2 data have been pooled. (B) Representative BGC cell flow cytometry, gated on viable CD20+ B cells pre- and post-immunization. See Fig S1 for full gating strategy. (C) BGC cell frequencies over time. Black circles, pooled bolus Gp1&2; grey circles, bolus Gp2. (D) Cumulative BGC cell responses (AUC of C) to immunization within individual LNs at weeks 1, 3–7 [AUC]. (E) Representative flow cytometry of Env trimer-specific B cells pre- and post-immunization. (F) Env-specific B cell frequencies over time. (G) Cumulative Env trimer-specific B cells (AUC of F) within each LN. (H) Representative flow cytometry Env trimer-specific BGC cells pre- and post-immunization. (I) Env trimer-specific BGC cell frequencies over time. (J) Cumulative Env trimer-specific BGC cells (AUC of I) within each LN. (K) Env trimer-specific BGC cells over time. (L) Cumulative Env trimer-specific BGC cells (AUC of K) within each LN. (M) Frequencies of high-affinity Env trimer-specific BGC cells over time. (N) Cumulative high-affinity Env trimer-specific BGC cells (AUC of M) within each LN. (O) High-affinity Env trimer-specific BMem cells over time. (P) Cumulative high-affinity Env trimer-specific BMem cell responses within individual LNs. (Q) Representative flow cytometry of GC-TFH cells, gated on CD4+ T cells. See Fig S2 for full gating strategy. (R) GC-TFH cells over time. (S) Cumulative GC-TFH cell response between w1 plus w3-6 [AUC]. Mean ± SEM are graphed. Statistical significance tested using unpaired, two-tailed Mann-Whitney U tests. *p≤0.05, **p≤0.01. ***p≤0.001, ****p≤0.0001 See also Figures S1–2 and Data S1.
Figure 2.
Figure 2.. Germinal center responses following 2nd Env trimer immunization.
(A) Immunization and sampling schedule of 2nd immunization. Groups were immunized and sampled contemporaneously. (B) Frequencies of total BGC cells over time. (C) Env trimer-specific B cell frequencies over time. (D-E) Env trimer-specific BGC cells over time. (F) High-affinity Env trimer-specific BGC cells over time. (G) High-affinity Env trimer-specific BMem cells over time. (H) GC-TFH cell frequencies after 2nd immunization. (I) Representative flow cytometry of Env-specific CD4+ T cells from LNs. Cells were left unstimulated or stimulated with a peptide pool spanning Olio6CD4ko. (J) Env-specific CD4+ T cells at w12 (bolus) or w14 (OP). (K) Representative flow cytometry of GC-TFH, mantle (m)TFH and non-TFH cell subsets. (L) Flow cytometry of AIMOB assay (OX40+4-1BB+), gated on GC-TFH, mTFH or non-TFH cells. (M) Quantification of Env-specific CD4+ T cells by subset. Mean ± SEM are graphed. Statistical significance tested using unpaired, two-tailed Mann-Whitney U test. *p≤ 0.05, **p≤0.01, ***p≤0.00. See also Figure S2.
Figure 3.
Figure 3.. Sustained delivery immunization induces higher nAb titers
(A) BG505 Env trimer IgG binding endpoint titers over time. (B) His IgG binding endpoint titers over time. (C) BG505 (autologous) nAb titers over time. (D) Peak BG505 nAb titers after two immunizations. (E) Neutralization breadth on a 12-virus panel. GMT and ± geometric SD. Statistical significance was tested using unpaired, two-tailed Mann-Whitney U test. *p≤0.05. See also Figure S2.
Figure 4.
Figure 4.. Immunoglobulin gene germline annotations using long-read genomic DNA sequencing
(A) Locus and assembly summaries for the RM Ig loci. (B) A representative region where PacBio primary contigs resolved gaps in the current RM reference genome. PacBio reads span these gaps (inset). (C) Overview of V gene allelic variant discovery process. Reads overlapping annotations on primary contigs were assessed for the presence of SNPs, which were used to partition reads for allele-specific assemblies. (D) SNPs (e.g., green and red) within or near genes (red boxes) were used to partition reads to each respective haplotype, allowing for the identification of heterozygous (pink) and homozygous (grey) gene segments. (E) Primary and alternate contig alleles. (F) Variable (V) genes from PacBio assembly that were present in IMGT or NCBI V gene repositories. (G) V gene counts from PacBio primary contig assemblies, compared to human gene loci. (H) Quantification of Env-specific B cells lineages from individual LNs. (I) Phylogenetic analysis of a lineage found in both LNs in one animal. Blue, left LN; Red, right LN. Dot size represents number of reads with that sequence. (J) Lineages shared between R and L LNs within an animal. (K) Mutation frequencies in IGHV, IGLV, or IGKV. Violin plots; Dash = mean. Mean ± SEM; statistical significance in H and J tested using unpaired, two-tailed Mann-Whitney U test. Significance in K tested using Student’s t-test. *p≤ 0.05, **p≤0.01, ***p≤0.001 See also Figure S3 and Tables S1–2.
Figure 5.
Figure 5.. Slow delivery immunization shifts immunodominance.
(A) IGHV or (B) IGLV use by antigen-specific B cells within a LN. Each data point is single LN. Statistical significance tested using multiple t-tests with FDR = 5%; ****q<0.0001. (C) Phylogenetic tree of an IGLV3-15+ lineage. Blue, left LN; Red, right LN. Dot size represents number of reads with that sequence. (D) The base of Env is hidden on the virion surface. Soluble trimer allows access of the base to B cells. Glycans restrict access to the main Env trimer surface. (E) Binding curves of mAbs isolated from w7 to BG505 Env trimer. (F) Cross-competition ELISA assay. Data is representative of two experiments, each performed in duplicate. (G) 3D EM reconstruction of BDA1 Fab (blue) in complex with BG505 Env trimer. (H) Binding curves of BDA1 and related mutants to BG505 Env trimer. BDA12 has a single w12 mutation in L-CDR3. BDA13 contains this mutation and three additional w12 mutations in L-CDR2. Data is representative of two experiments, each performed in duplicate. (I) Composite 3D reconstruction of Env trimer bound to Fabs isolated from all animals as determined by polyclonal EM analysis. Numbers of individuals with Fab that binds region are listed. Base (purple), glycan hole-I (light blue), C3/V5 (dark blue), fusion peptide (orange), V1/V3 apex (green). Apex specific Fab is transparent to represent rarity. Mean ± SEM. See also Figures S4–6 and Table S3.
Figure 6.
Figure 6.. Dose escalating immunization strategy results in higher nAb titers.
(A) Immunization and sampling schedule. Groups were immunized and sampled contemporaneously. (B) Total BGC frequencies over time. Data from bolus Gp2 (Fig 1) are included in these analyses (grey circles). (C) Cumulative BGC cell response to the first immunization, calculated between w3-7 [AUC]. (D) Env trimer-specific BGC cells frequencies over time. (E) Cumulative Env trimer-specific BGC cell responses to one immunization. (F) Total GC-TFH cell frequencies over time. (G) Cumulative GC-TFH responses to one immunization (AUC of F). (H) Env-specific CD4+ responses after one immunization. (I) Ratio of Env+ BGC to Env-specific GC-TFH cells at w5, calculated as Env+ BGC (% B cells)/ Env-specific GC-TFH (% CD4+). (J) BG505 Env trimer binding IgG titers over time. (K) Autologous BG505 nAb titers over time. (L) Peak BG505 nAb titers after three immunizations. (M) Composite 3D reconstruction of Env trimer bound to Fabs isolated from all animals after two immunizations. 3D EM reconstructions from individual animals can be seen in Figure S8A. (N) Correlation between peak GC-TFH and BGC cell % during 1st immunization from both studies. (O) Correlation between Env+ BGC cells (% B cells) and peak neutralization titers. Env+ BGC cell values are from w7 or peak frequencies during 1st immunization. Peak nAb titers are after 2nd immunization. Serological data represent GMT ± geometric SD. Cell-frequency data represent mean ± SEM. Statistical significance was tested using unpaired, two-tailed Mann-Whitney U tests. *p<0.05, **p<0.01, ***p<0.001, ****p<0.0001. See also Figure S7–8 and Data S2.
Figure 7.
Figure 7.. Slow delivery immunization results in enhanced antigen retention in LNs.
(A) Quantitation of fluorescent Env in draining inguinal and iliac and non-draining axillary LNs. Mean ± SEM; statistical significance was tested using two-way ANOVA. *adjusted p <0.05, **p<0.01, ***p<0.001 (B) Light sheet microscopy visualizing Env in intact draining LNs at d2. 360° views available in video S1. (C) Histology of draining LNs at d7. Green, Env; red, CD35; blue, KI67. Scale bars, 100μm. (D) Model of GC response in conventional immunization vs. slow delivery. Slow delivery immunization likely alters early (~d1-d7) activation and differentiation of TFH cells and activation and recruitment of a diverse set of B cells. Greater GC-TFH help supports a wider repertoire of B cells, which is more likely to contain nAb precursors, later in the response (w3–7). Antigen delivered via conventional bolus immunization can be subject to degradative processes and nonnative forms of antigen can be presented by FDCs late in the response, while OPs protect the antigen prior to release. Immune complex (IC) formation is enhanced by slow delivery immunization. See also Figure S8 and Movie S1.

References

    1. Abbott RK, Lee JH, Menis S, Skog P, Rossi M, Ota T, Kulp DW, Bhullar D, Kalyuzhniy O, Havenar-Daughton C, et al. (2018). Precursor Frequency and Affinity Determine B Cell Competitive Fitness in Germinal Centers, Tested with Germline-Targeting HIV Vaccine Immunogens. Immunity 48, 133–146.e136. - PMC - PubMed
    1. Alkan C, Sajjadian S, and Eichler EE (2011). Limitations of next-generation genome sequence assembly. Nat. Methods 8, 61–65. - PMC - PubMed
    1. Andrew S (2010). FastQC: A quality control tool for high throughput sequence data. 2010.
    1. Andrews SF, Graham BS, Mascola JR, and McDermott AB (2018). Is It Possible to Develop a “Universal” Influenza Virus Vaccine? Immunogenetic Considerations Underlying B-Cell Biology in he Development of a Pan-Subtype Influenza A Vaccine Targeting the Hemagglutinin Stem. Cold Spring Harb Perspect Biol 10, a029413. - PMC - PubMed
    1. Angeletti D, and Yewdell JW (2018). Understanding and Manipulating Viral Immunity: Antibody Immunodominance Enters Center Stage. Trends Immunol 39, 549–561. - PubMed

Publication types

MeSH terms

Substances