. 2019 May 30;177(6):1649-1661.e9.
doi: 10.1016/j.cell.2019.04.016. Epub 2019 May 9.

A White-Box Machine Learning Approach for Revealing Antibiotic Mechanisms of Action

Affiliations

A White-Box Machine Learning Approach for Revealing Antibiotic Mechanisms of Action

Jason H Yang et al. Cell. .

Abstract

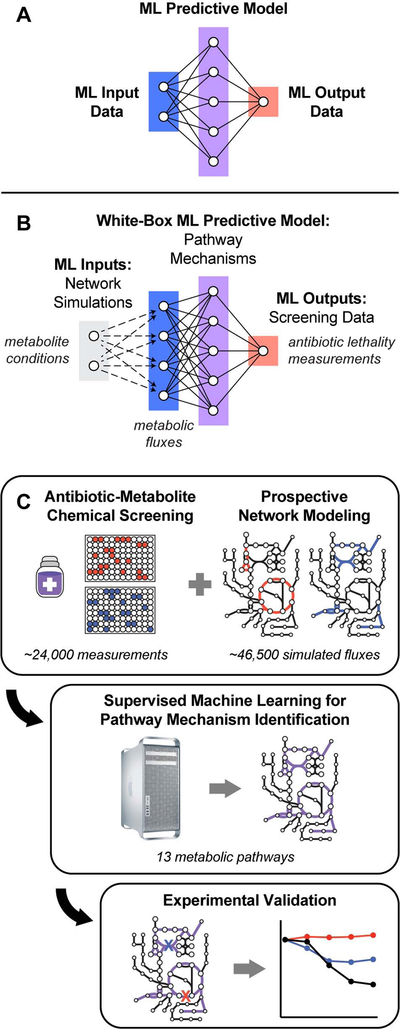
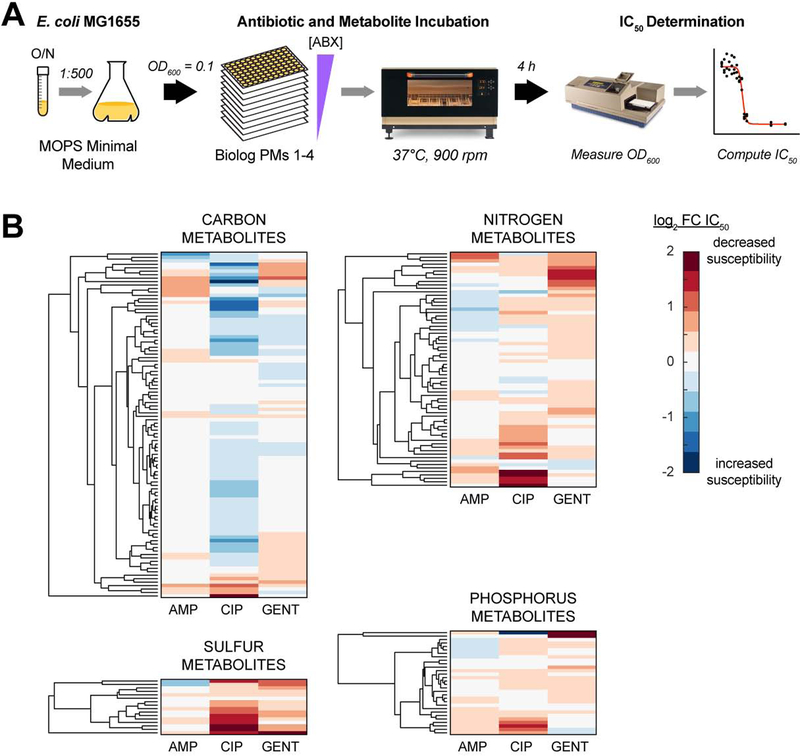
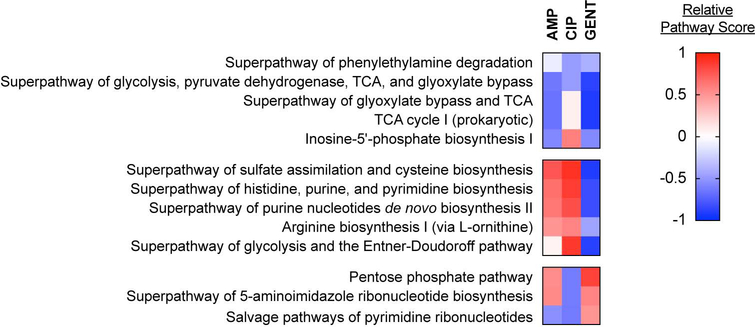
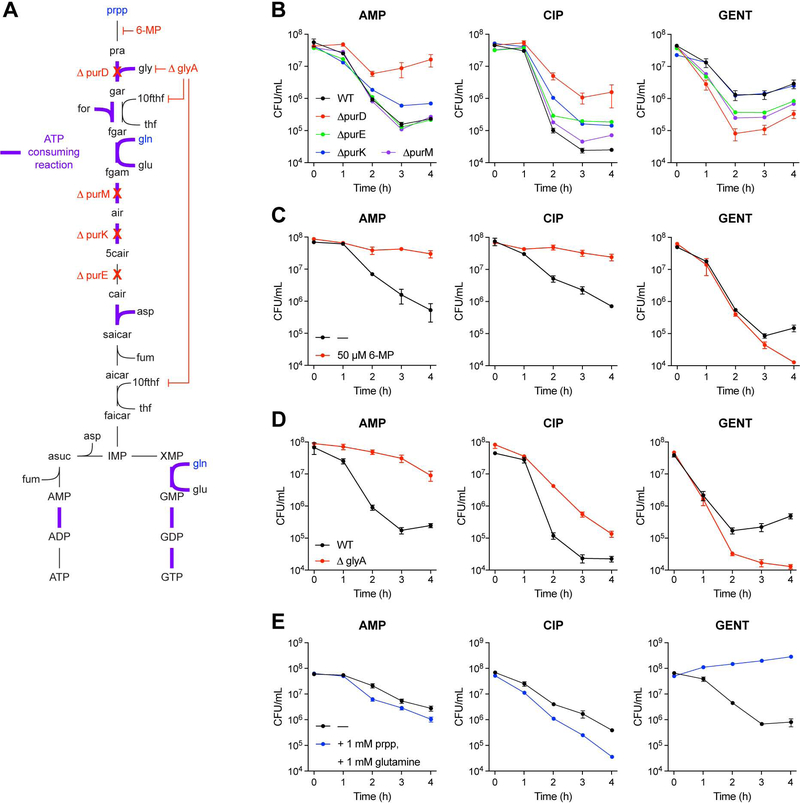
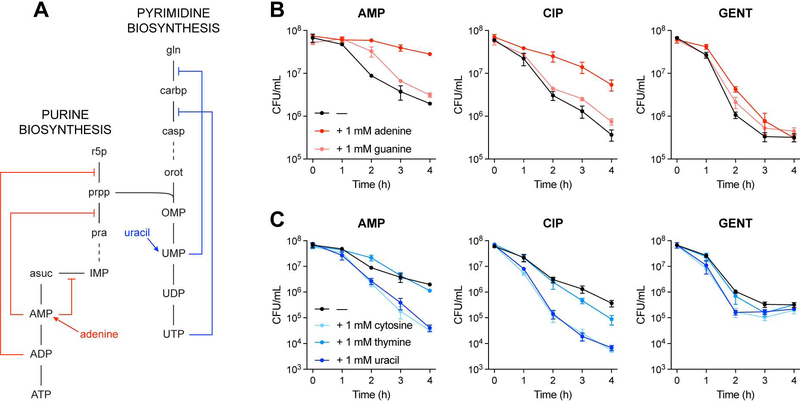
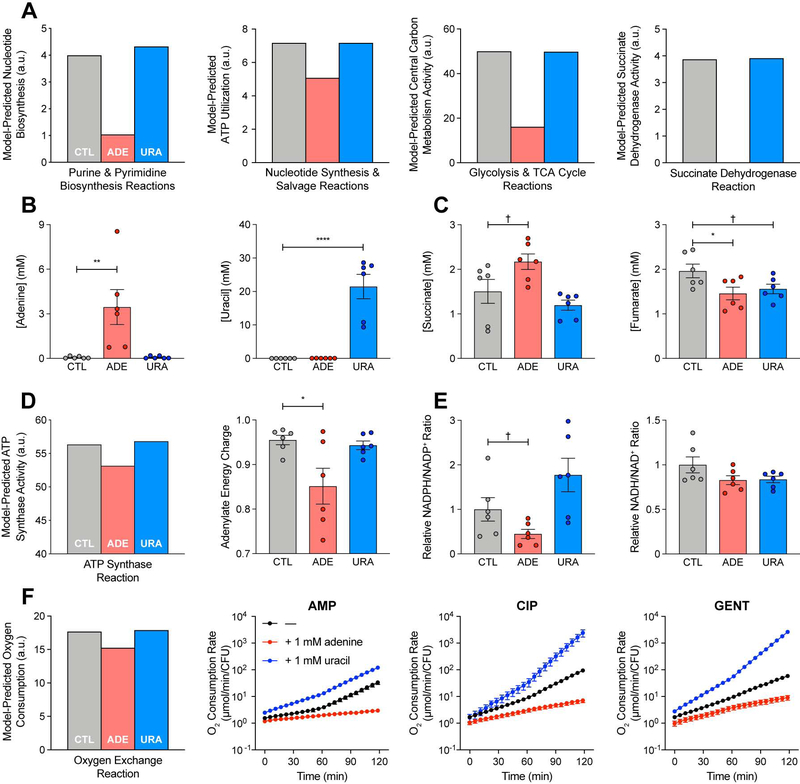
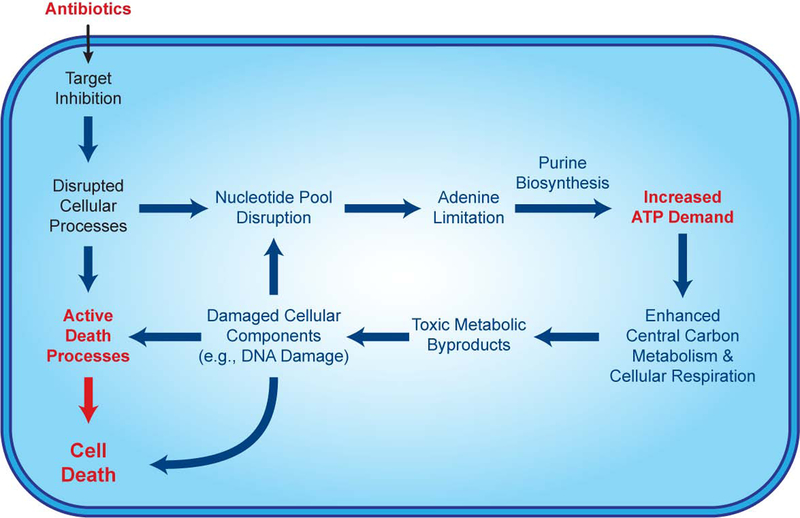
Current machine learning techniques enable robust association of biological signals with measured phenotypes, but these approaches are incapable of identifying causal relationships. Here, we develop an integrated "white-box" biochemical screening, network modeling, and machine learning approach for revealing causal mechanisms and apply this approach to understanding antibiotic efficacy. We counter-screen diverse metabolites against bactericidal antibiotics in Escherichia coli and simulate their corresponding metabolic states using a genome-scale metabolic network model. Regression of the measured screening data on model simulations reveals that purine biosynthesis participates in antibiotic lethality, which we validate experimentally. We show that antibiotic-induced adenine limitation increases ATP demand, which elevates central carbon metabolism activity and oxygen consumption, enhancing the killing effects of antibiotics. This work demonstrates how prospective network modeling can couple with machine learning to identify complex causal mechanisms underlying drug efficacy.

Keywords: ATP; LC-MS/MS; NADPH:NADP(+) ratio; adenylate energy charge; antibiotics; biochemical screen; machine learning; metabolism; network modeling; purine biosynthesis.


Conflict of interest statement

DECLARATION OF INTERESTS

J.J.C. is scientific co-founder and scientific advisory board chair of Enbiotix, an antibiotics startup company.

Figures

Figure 1.
Figure 1.. A white-box machine learning approach for revealing metabolic mechanisms of antibiotic lethality.
(A) Machine learning activities are typically comprised of three parts: input data (blue), output data (red), and a predictive model trained to compute output data from input data (purple). (B) An overall framework for white-box machine learning. Input screening perturbations (e.g., metabolite conditions; gray) are first transformed into enriched biological network states by prospective network modeling (e.g., metabolic fluxes; blue). These network simulations are then used as machine learning inputs to train a predictive model (purple), revealing mechanisms underlying the output data (e.g., antibiotic lethality measurements; red). Because biological networks are mechanistically constructed, features comprising the predictive models trained by machine learning are, by definition, mechanistically causal. (C) E. coli MG1655 cells were treated with three bactericidal antibiotics at ≥ 13 different concentrations. Antibiotic IC50s were quantified following supplementation with 206 diverse metabolites and normalized by their on-plate controls. Metabolic network states corresponding to each metabolite were prospectively simulated using the iJO1366 model of E. coli metabolism (Orth et al., 2011). For each antibiotic, changes in IC50 were regressed on the simulated fluxes and pathway mechanisms were identified by hypergeometric testing on metabolic pathways curated by Ecocyc (Keseler et al., 2017). Identified pathways were validated experimentally.
Figure 2.
Figure 2.. Exogenous metabolites exert pathway-specific effects on antibiotic lethality.
(A) Overall experimental design for measuring metabolite effects on antibiotic lethality. Overnight cultures of E. coli MG1655 were inoculated into MOPS minimal medium, grown to early exponential phase, and back-diluted to OD600 = 0.1. Cells were dispensed into Biolog phenotype microarray plates (PMs) 1–4 (Bochner, 2009) with different concentrations of ampicillin (AMP), ciprofloxacin (CIP) or gentamicin (GENT) added. OD600 was measured after 4 hours of incubation at 37°C and 900 rpm shaking. Antibiotic IC50s were estimated for each antibiotic-metabolite combination. (B) Antibiotic IC50 responses to metabolite supplementation. Metabolically-induced sensitivity profiles differ by antibiotic, but several metabolites commonly protect (red) or sensitize (blue) cells to multiple antibiotics. Carbon metabolites were screened using Biolog PMs 1 and 2; nitrogen metabolites were screened using Biolog PM 3; phosphorus and sulfur metabolites were screened using Biolog PM 4. Data are represented as mean from n ≥ 3 independent biological replicates.
Figure 3.
Figure 3.. White-box machine learning reveals known and new antibiotic mechanisms of action.
Pathways scores for metabolic pathways identified by white-box machine learning. Identified pathways include several central carbon metabolism and nucleotide biosynthesis pathways and these cluster into three groups, based on pathway score. Central metabolism pathways primarily exhibit similar pathway directionality for ampicillin (AMP), ciprofloxacin (CIP), gentamicin (GENT), while purine biosynthesis pathways exhibit different pathway score directionality for GENT from AMP or CIP. Pathway scores were computed for each antibiotic by log-transforming the average regression coefficient for all non-zero reactions annotated in a given pathway.
Figure 4.
Figure 4.. Purine biosynthesis participates in antibiotic lethality.
(A) Purine biosynthesis pathway. Purine biosynthesis begins with phosphoribosyl pyrophosphate (prpp) and contains several ATP consuming steps (purple). (B) Antibiotic lethality in purine biosynthesis deletion mutants. Genetic inhibition of purine biosynthesis by purD (glycinamide ribonucleotide synthetase), purE (N5-carboxyaminoimidazole ribonucleotide mutase), purK (5-(carboxyamino)imidazole ribonucleotide synthase), or purM (phosphoribosylformylglycinamide cyclo-ligase) deletion decreases ampicillin (AMP) and ciprofloxacin (CIP) lethality, but increases gentamicin (GENT) lethality. (C) Antibiotic lethality following biochemical inhibition of purine biosynthesis. Biochemical inhibition of PurF (amidophosphoribosyltransferase) by 6-mercaptopurine (6-MP) decreases AMP and CIP lethality, but increases GENT lethality. (D) Antibiotic lethality in a glyA (serine hydroxymethyltransferase) deletion mutant. Genetic inhibition of glycine (gly) and N10-formyl-tetrahydrofolate (10fthf) by glyA deletion decreases AMP and CIP lethality, but increases GENT lethality. (E) Antibiotic lethality following enhanced purine biosynthesis. Substrate-level stimulation of purine biosynthesis with phosphoribosyl pyrophosphate (prpp) and glutamine (gln) supplementation increases AMP and CIP lethality, but decreases GENT lethality. Data are represented as mean ± SEM from n ≥ 3 independent biological replicates.
Figure 5.
Figure 5.. Adenine limitation contributes to antibiotic lethality.
(A) Feedback inhibition in the purine and pyrimidine biosynthesis pathways. Purine and pyrimidine biosynthesis auto-regulate through internal feedback inhibition by nucleotide end-products. (B) Antibiotic lethality following purine supplementation. Adenine supplementation (red) decreases ampicillin (AMP), ciprofloxacin (CIP) and gentamicin (GENT) lethality. (C) Antibiotic lethality following pyrimidine supplementation. Uracil supplementation (dark blue) increases AMP, CIP and GENT lethality. Data are represented as mean ± SEM from n = 3 independent biological replicates.
Figure 6.
Figure 6.. Adenine supplementation reduces ATP demand and central carbon metabolism activity.
(A) Metabolic modeling predictions. Adenine supplementation decreases activity through purine biosynthesis, consequently decreasing ATP utilization by purine biosynthesis, central carbon metabolism and oxidative phosphorylation (Figure S4), in comparison to simulated control (CTL). E. coli metabolism under adenine (ADE) or uracil (URA) supplementation was simulated by parsimonious flux balance analysis (pFBA) in the iJO1366 metabolic model with exchange reactions for adenine or uracil opened, respectively. Nucleotide biosynthesis activity was computed by summing fluxes through reactions in the Purine and Pyrimidine Biosynthesis subsystem (left). ATP consumption was summed across all reactions in the Purine and Pyrimidine Biosynthesis and Nucleotide Salvage Pathway subsystems (center left). Central carbon metabolism activity was computed by summing fluxes through reactions in the Glycolysis and TCA Cycle subsystems (center right). Oxidative phosphorylation is proxied by the Succinate Dehydrogenase reaction (right); additional oxidative phosphorylation reactions are depicted in Figure S4. All fluxes were normalized by the biomass objective function. (B) Intracellular adenine or uracil concentrations following adenine or uracil supplementation. Intracellular metabolite concentrations were measured by targeted LC-MS/MS. (C) Intracellular succinate or fumarate concentrations following adenine or uracil supplementation. Adenine supplementation increases intracellular succinate and decreases intracellular fumarate, consistent with model predictions for inhibited succinate dehydrogenase activity (A, right). (D) ATP synthesis following adenine or uracil supplementation. Metabolic modeling simulations predict a decrease in ATP synthesis following adenine supplementation (left), reported by the ATP Synthase reaction. Metabolomic measurements of intracellular ATP, ADP and AMP (Figure S5B) reveal a similar decrease in adenylate energy charge following adenine supplementation (right). (E) NADPH/NADP+ and NADH/NAD+ ratios following adenine or uracil supplementation. Metabolomic measurements of intracellular NADPH, NADP+, NADH and NAD+ (Figure S5C) reveal modest decreases in the NADPH/NADP+ ratio following adenine supplementation (left), indicating reduced anabolic metabolism. The NADH/NAD+ ratio is largely unchanged (right), indicating preserved catabolic metabolism. (F) Cellular respiration following adenine or uracil supplementation during antibiotic treatment. Metabolic modeling simulations predict a decrease in oxygen consumption following adenine supplementation (left), reported by the Oxygen Exchange reaction. Adenine supplementation (red) reduces respiratory activity, while uracil (blue) increases respiratory activity. Changes in oxygen consumption rate following treatment with ampicillin (AMP), ciprofloxacin (CIP) or gentamicin (GENT) and adenine or uracil supplementation were measured using the Seahorse Extracellular Flux Analyzer. Data are represented as mean ± SEM from n = 3 independent biological replicates. Significance reported as FDR-corrected p-values in comparison with control: †: p ≤ 0.1, *: p ≤ 0.05, **: p ≤ 0.01, ****: p ≤ 0.0001.
Figure 7.
Figure 7.. Antibiotic-induced adenine limitation induces purine biosynthesis, increasing ATP demand and driving central carbon metabolic activity.
In addition to the lethal effects of inhibiting their primary targets, bactericidal antibiotics disrupt the nucleotide pool, depleting intracellular purines and inducing adenine limitation. Adenine limitation triggers purine biosynthesis, increasing ATP demand, which drives increased activity through central carbon metabolism and cellular respiration. Toxic metabolic byproducts generated by this increased metabolic activity damage DNA and exacerbate antibiotic-mediated killing. Futile cycles and other stressinduced phenomena may also elevate ATP demand.

Comment in

References

    1. Adolfsen KJ, and Brynildsen MP (2015). Futile cycling increases sensitivity toward oxidative stress in Escherichia coli. Metab Eng 29, 26–35. - PMC - PubMed
    1. Allison KR, Brynildsen MP, and Collins JJ (2011). Metabolite-enabled eradication of bacterial persisters by aminoglycosides. Nature 473, 216–220. - PMC - PubMed
    1. Andersen KB, and von Meyenburg K (1977). Charges of nicotinamide adenine nucleotides and adenylate energy charge as regulatory parameters of the metabolism in Escherichia coli. J Biol Chem 252, 4151–4156. - PubMed
    1. Baba T, Ara T, Hasegawa M, Takai Y, Okumura Y, Baba M, Datsenko KA, Tomita M, Wanner BL, and Mori H (2006). Construction of Escherichia coli K-12 in-frame, single-gene knockout mutants: the Keio collection. Mol Syst Biol 2, 2006 0008. - PMC - PubMed
    1. Babin BM, Atangcho L, van Eldijk MB, Sweredoski MJ, Moradian A, Hess S, Tolker-Nielsen T, Newman DK, and Tirrell DA (2017). Selective Proteomic Analysis of Antibiotic-Tolerant Cellular Subpopulations in Pseudomonas aeruginosa Biofilms. MBio 8. - PMC - PubMed

Publication types

MeSH terms