. 2019 Jul 3;25(1):69-86.e5.
doi: 10.1016/j.stem.2019.03.022. Epub 2019 May 9.

Cardiac Reprogramming Factors Synergistically Activate Genome-wide Cardiogenic Stage-Specific Enhancers

Affiliations

Cardiac Reprogramming Factors Synergistically Activate Genome-wide Cardiogenic Stage-Specific Enhancers

Hisayuki Hashimoto et al. Cell Stem Cell. .

Abstract

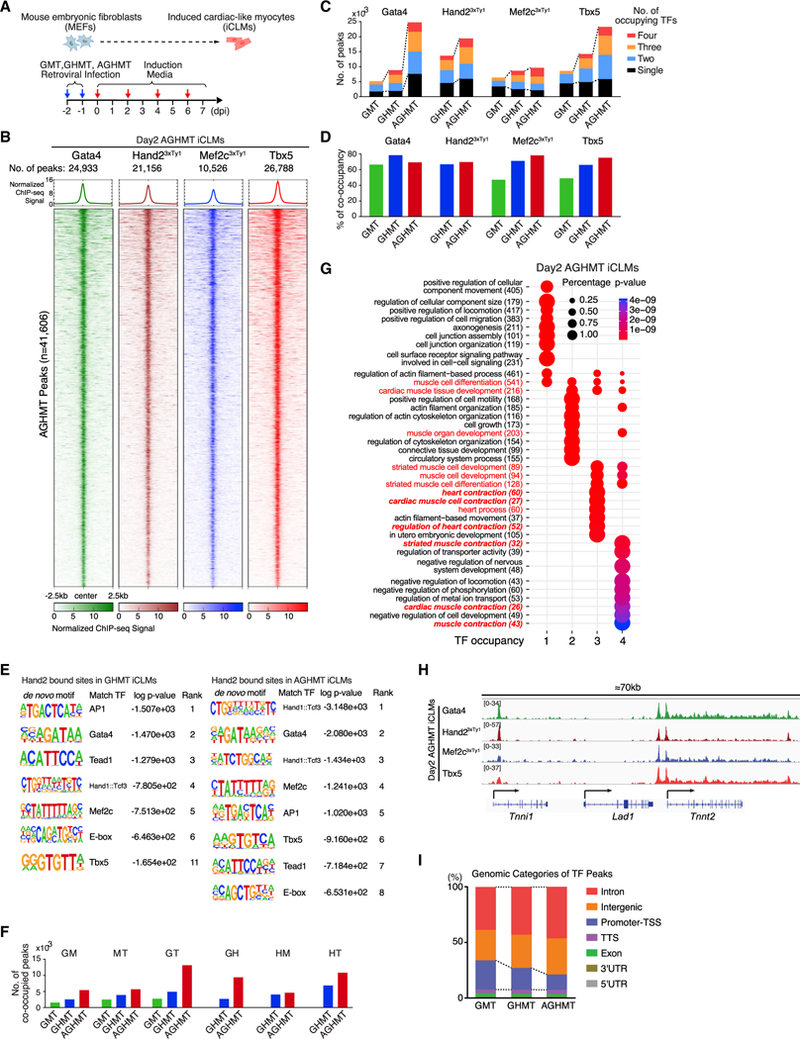
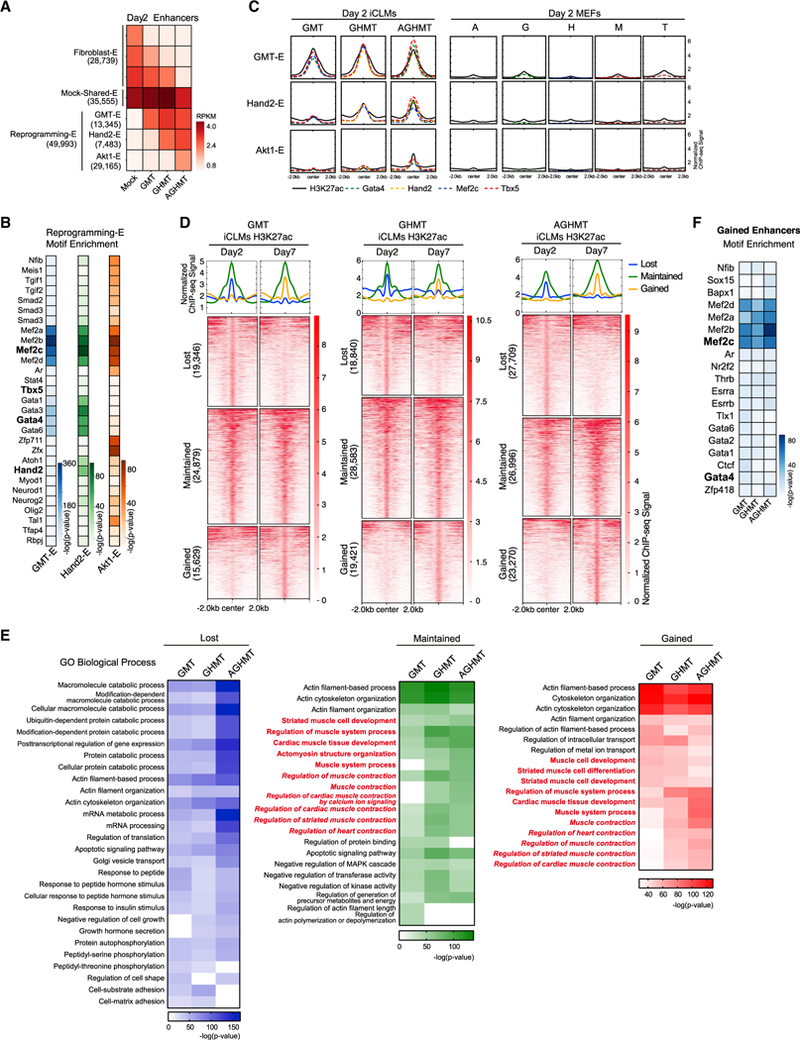
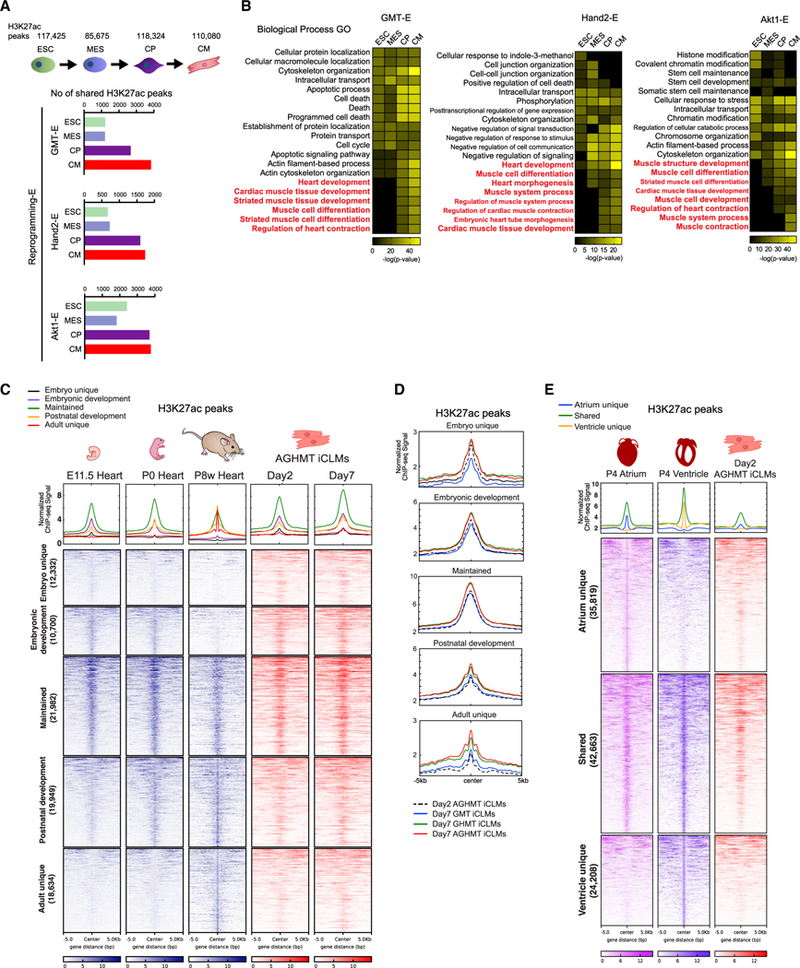
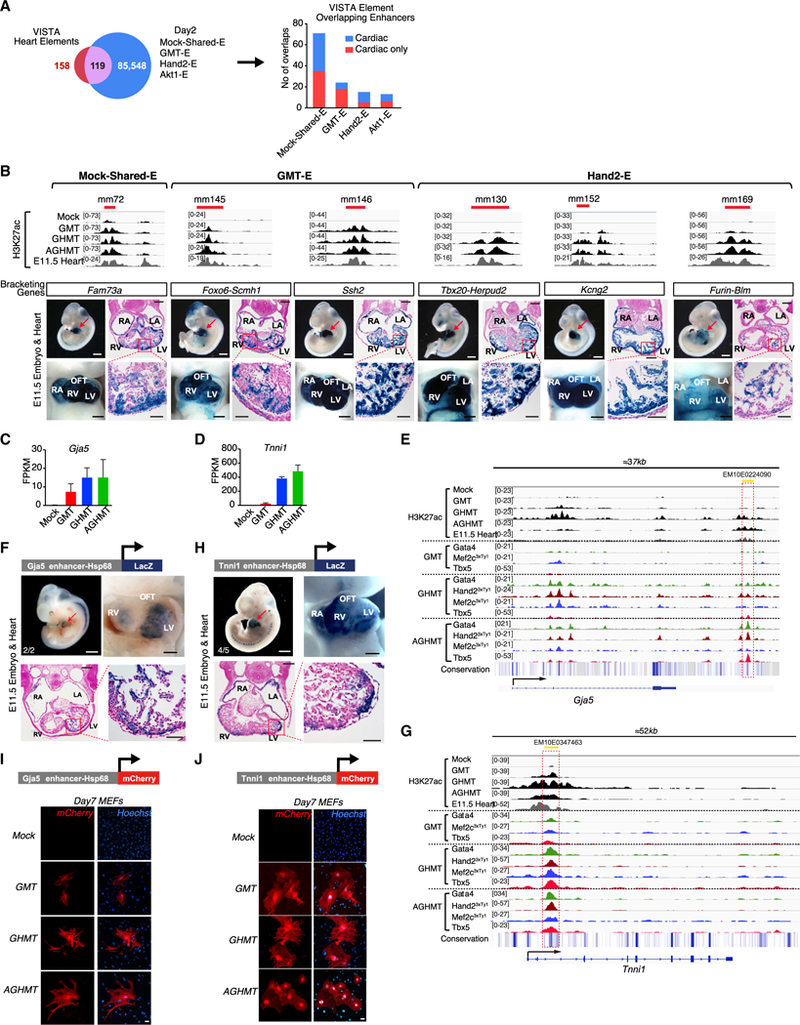
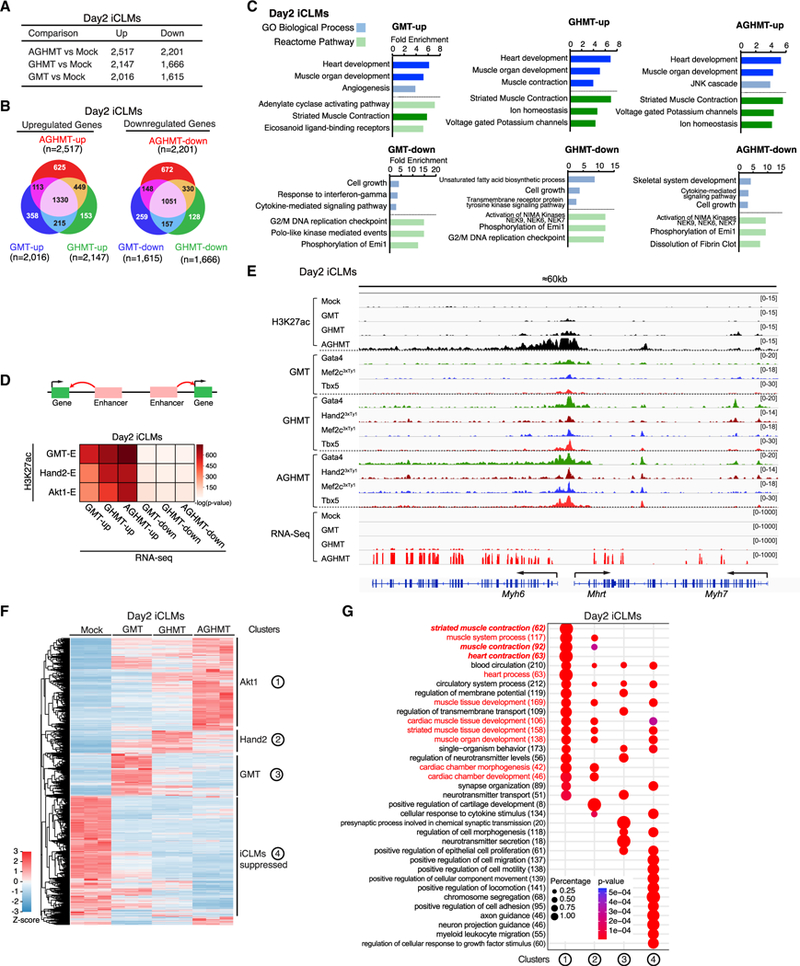
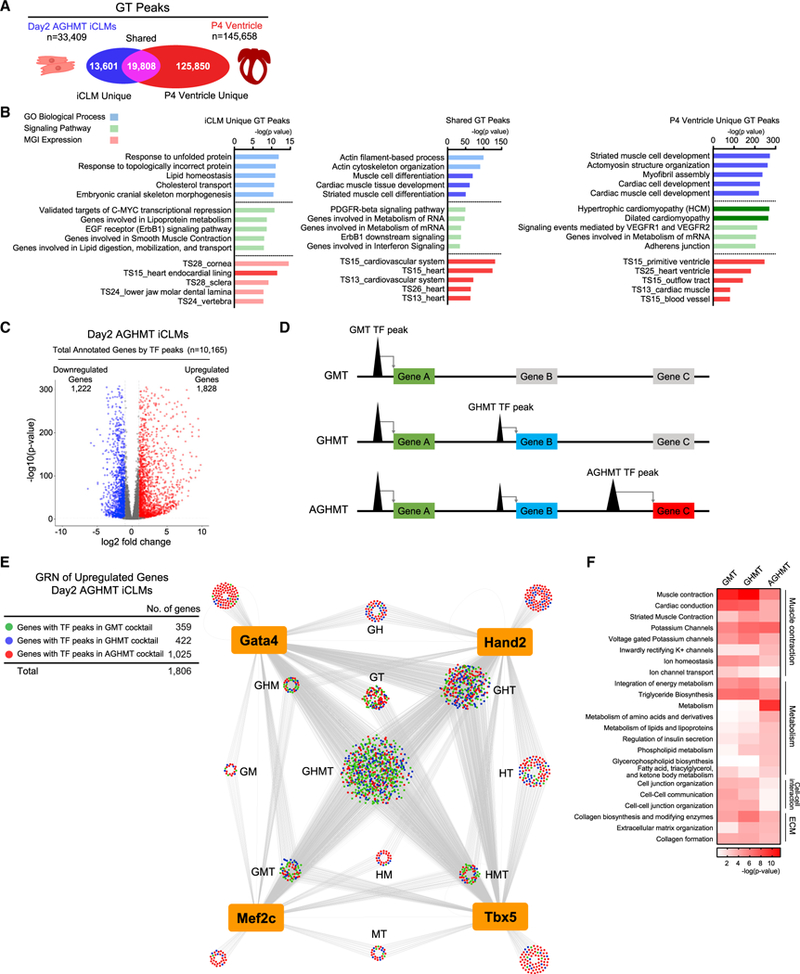
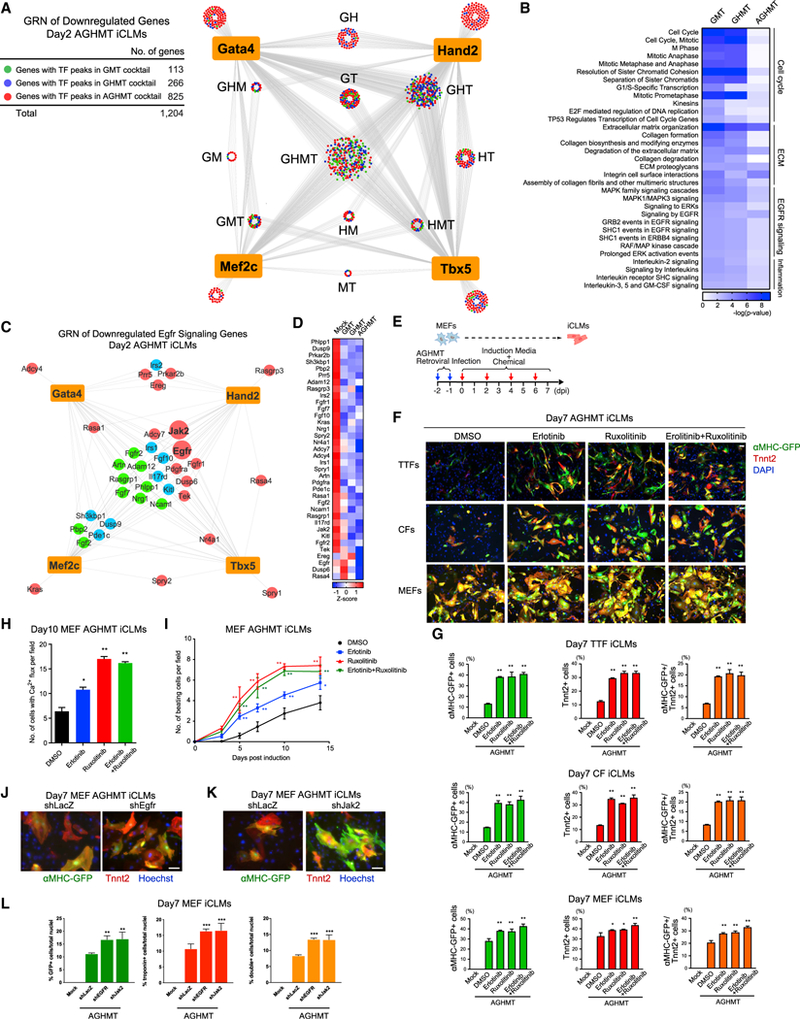
The cardiogenic transcription factors (TFs) Mef2c, Gata4, and Tbx5 can directly reprogram fibroblasts to induced cardiac-like myocytes (iCLMs), presenting a potential source of cells for cardiac repair. While activity of these TFs is enhanced by Hand2 and Akt1, their genomic targets and interactions during reprogramming are not well studied. We performed genome-wide analyses of cardiogenic TF binding and enhancer profiling during cardiac reprogramming. We found that these TFs synergistically activate enhancers highlighted by Mef2c binding sites and that Hand2 and Akt1 coordinately recruit other TFs to enhancer elements. Intriguingly, these enhancer landscapes collectively resemble patterns of enhancer activation during embryonic cardiogenesis. We further constructed a cardiac reprogramming gene regulatory network and found repression of EGFR signaling pathway genes. Consistently, chemical inhibition of EGFR signaling augmented reprogramming. Thus, by defining epigenetic landscapes these findings reveal synergistic transcriptional activation across a broad landscape of cardiac enhancers and key signaling pathways that govern iCLM reprogramming.

Keywords: Akt1; Gata4; Hand2; Mef2c; Tbx5; cardiomyocytes; direct reprogramming; heart regeneration; induced cardiac-like myocytes.


Figures

Figure 1.
Figure 1.. Genome-wide Co-occupancy of Reprogramming Factors in AGHMT iCLMs
(A) Strategy for cardiac reprogramming in MEFs. (dpi, days post-induction.) (B) ChIP-seq data for Gata4, Hand2, Mef2c, and Tbx5 display co-occupancy at 41,606 genomic binding sites in day 2 AGHMT iCLMs. ChIP-seq signal heatmap using a 5 kb window was centered on peak regions and sorted in descending order by signal intensity. (C) Number of TF peaks of GMT, GHMT, and AGHMT in day 2 iCLMs. (D) Percentage of TF peaks co-occupied by more than two TFs. (E) De novo motifs identified at Hand2 bound sites in day 2 iCLMs by HOMER. (F) Number of TF peaks with different pairs of TFs in day 2 iCLMs. (G) TF peaks were annotated to the nearest neighboring genes, and GO enrichment analysis was performed with DAVID (v.6.8). GO enrichment from different groups based on the number of occupying TFs was performed with clusterProfiler (v.3.6.0). (H) Genome browser view showing the co-occupancy of Gata4, Hand2, Mef2c, and Tbx5 in a 70 kb window encompassing Tnni1, Lad1, and Tnnt2 genes in day 2 iCLMs. (I) GMT, GHMT, and AGHMT ChIP-seq peaks were classified into seven genomic categories. Dashed lines connect the group of intronic and intergenicTF peaks. See also Figures S1 and S2 and Table S1.
Figure 2.
Figure 2.. Synergistic Enhancer Activation during Reprogramming
(A) H3K27ac enhancer peaks in day 2 iCLMs clustered into three groups (Fibroblast-Enhancer, Mock-Shared-Enhancer, and Reprogramming-Enhancer). Fibroblast-Enhancer and Reprogramming-Enhancer were then sub-clustered into groups depending on their response to GMT, GHMT, and AGHMT (GMT-E, Hand2-E, and Akt1-E for Reprogramming-E). Each box represents the mean RPKM H3K27ac enhancer signals of the group of enhancers. (B) Heatmaps of known motifs enriched in GMT-E, Hand2-E, and Akt1-E peaks. (C) Normalized ChIP-seq binding profiles for H3K27ac and TFs show similar distribution patterns on a genome-wide scale in iCLMs. TF peaks show higher correlation with Hand2-E and Akt1-E peaks in the presence of Hand2 and Akt1, respectively. Single-factor overexpressing MEFs show weak signals of H3K27ac and TF binding at the Reprogramming-E regions. (D) Heatmaps of reprogramming enhancers clustered into three distinct groups depending on differences between day 2 and 7 iCLMs. (E) Heatmaps of overrepresented terms belonging to the Biological Process GO in each enhancer cluster. Terms related to heart or muscle contraction are highlighted in red italics. (F) Heatmap of known motifs enriched in enhancers gained by day 7 compared to day 2 iCLMs. See also Figure S3 and Tables S2 and S3.
Figure 3.
Figure 3.. Conservation of the Reprogramming Enhancer Landscape in Cardiogenic Processes
(A) Comparison of Reprogramming-E peaks with active enhancers in embryonic stem cells (ESC), mesoderm (MES), cardiac precursors (CP), and cardiomyocytes (CM). (B) Heatmaps of overrepresented terms belonging to the Biological Process GO using GREAT in each reprogramming enhancer cluster. (C) Heatmaps of H3K27ac enhancer ChIP-seq signals of E11.5, P0, and P8 week hearts from ENCODE datasets, and day 2 and 7 AGHMT iCLMs clustered according to their appearance in different developmental stages. (D) Normalized ChIP-seq binding profiles for H3K27ac of day 2 AGHMT, and day 7 GMT, GHMT, and AGHMT iCLMs, in each developmental cluster from Figure 3C are shown. (E) Heatmap of H3K27ac enhancer ChIP-seq signals of P4 atrium, ventricle, and day 2 AGHMT iCLMs using a 10 kb window, clustered according to their presence in P4 atrium and ventricle. Normalized ChIP-seq binding profiles for H3K27ac in each cluster are shown.
Figure 4.
Figure 4.. In Vivo Cardiac Activity of Reprogramming Enhancers
(A) iCLM enhancers (Mock-Shared-E + GMT-E + Hand2-E + Akt1-Efrom Figure 2A) were overlapped with 158 mouse heart enhancers from the VISTA enhancer database, which showed an overlap of 119 enhancers. Numbers of iCLM enhancers in different groups overlapping with the VISTA heart enhancers are shown. “Cardiac only” indicates enhancers that show exclusively cardiac activity and “Cardiac” indicates enhancers that show activity in the heart plus other tissues, based on the VISTA database. (B) Top: H3K27ac enrichment profiles showing predicted enhancers. Red bars indicate respective VISTA enhancer elements. Bottom: subregional cardiac enhancer activities of six VISTA heart enhancers that overlap iCLM enhancers. Shown is a representative transgenic E11.5 embryo with LacZ reporter staining (blue) indicating enhancer activity. Red arrowhead indicates the heart and heart sections that were counter-stained with Nuclear Fast Red. (white scale bars: 1 mm; black scale bars: 500 μm for whole-mount heart and 200 and 50 μm for low- and high-magnification histology sections, respectively) (C and D) mRNA expression of Gja5 (C) and Tnnil (D) is upregulated in day 2 iCLMs based on RNA-seq (n = 3 per group). Data are represented as mean ± SD. (E) A highly conserved putative regulatory element ~25 kb downstream of the Gja5 locus (Gja5-E) that overlaps with an ENCODE based candidate Regulatory Element (EM10E0224090) is co-occupied by TFs during cardiac reprogramming. Conservation track was generated from Euarchontoglires subset of the UCSC genome browser. (F) Schematic of Gja5 enhancer LacZ construct and a representative image of E11.5 transgenic embryo and heart stained with β-galactosidase showing LacZ expression in the heart. Numbers indicate embryos with cardiac expression over the total LacZ+ genotyped embryos (white scale bar: 1 mm; black scale bar: 500 mm). A section of the E11.5 transgenic heart was counter-stained with Nuclear Fast Red (black scale bars: 200 and 50 μm for low-and high-magnification histology sections, respectively). (G) A highly conserved putative regulatory element in the Tnni1 intronic locus that overlaps with an ENCODE based candidate Regulatory Element (EM10E0347463) is co-occupied by TFs during cardiac reprogramming. The red dashed box indicates the region of the putative regulatory element. (H) Schematic of Tnni1 enhancer LacZ construct and a representative image of E11.5 transgenic embryo and heart stained with β-galactosidase showing LacZ expression in the heart. Numbers indicate embryos with cardiac expression over the total LacZ+ genotyped embryos (white scale bar: 1 mm; black scale bar, 500 μm). A section of E11.5 transgenic heart was counter-stained with Nuclear Fast Red (Black scale bars, 200 and 50 μm for low- and high-magnification histology sections, respectively). (I and J) Schematic of Gja5 (I) and Tnni1 (J) enhancer mCherry construct. Gja5-E- or Tnni1-E-Hsp68-mCherry was retrovirally delivered to MEFs together with the reprogramming factors. Representative image of day 7 mock-infected, GMT, GHMT, and AGHMT MEFs shows mCherry expression. (Bars, 50 μm.) See also Figures S4 and S5, Table S4, and Table S5.
Figure 5.
Figure 5.. Reprogramming Enhancers Positively Correlate with Gene Upregulation during Cardiac Reprogramming
(A and B) Table (A) and Venn diagrams (B) displaying the number of common and unique genes upregulated and downregulated in GMT, GHMT, and AGHMT day 2 iCLMs compared to mock (n = 3 per group). (C) In silico functional annotation of day 2 iCLM gene sets performed using PANTHER, and the three most overrepresented GO Biological Process (blue) and Reactome Pathway (green) terms are shown. Terms related to heart or muscle are highlighted in dark colors. (D) The enrichment significance of differentially expressed genes (columns) overlapping the reprogramming enhancer cluster (rows) in day 2 iCLMs was calculated using hypergeometric distribution. (E) A genome browser view of the Myh6, Mhrt, and Myh7 locus showing Hand2-andAkt1-dependent activation ofH3K27ac peaks withTF co-occupancy,which is associated with mRNA upregulation in day 2 iCLMs. (F) Heatmap of normalized FPKMs for all differentially expressed genes that meet inclusion criteria (|log2 FC| ≥ 1.0,p value ≤ 0.01, false discovery rate [FDR] ≤ 1%) for GMT, GHMT, and AGHMT day 2 iCLMs compared to mock-infected MEFs. (G) Genes from clusters corresponding to the numbers in (E) were used to perform GO enrichment analysis for Biological Process with DAVID (v.6.8). clusterProfiler (v.3.6.0) was used to visualize GO term enrichment. Terms related to heart or muscle are highlighted in red, and heart- or muscle-contraction-related terms are highlighted in red italics. See also Figure S6.
Figure 6.
Figure 6.. Construction of GRN during Cardiac Reprogramming
(A) Comparison of Gata4 and Tbx5 (GT) peaks between day 2 AGHMT iCLMs and P4 ventricle. (B) In silico functional annotation using GREAT showing the five most overrepresented GO Biological Process (blue), Signaling Pathway (green), and MGI Expression (red) terms. Terms related to heart or muscle are highlighted in dark colors. (C) Volcano plot of all differentially expressed genes annotated by day 2 AGHMT iCLMs TF peaks. Genes with their expression increased or decreased greater than 2-fold in AGHMT iCLMs compared to mock-infected MEFs with p value <0.01 are colored in red and blue, respectively. (D) Strategy for constructing GRN. Genes were colored according to their nearest TF peaks, if the peak activation was GMT (green), Hand2 (GHMT) (blue), orAktl (AGHMT) (red) dependent. (E) GRN of reprogramming factors and upregulated genes in day 2 AGHMT iCLMs. Each node represents a gene and edges are drawn to all the annotated genes of reprogramming TF peaks. (F) Genes colored in green (GMT), blue (Hand2), or red (Akt1) in (E) were used in GO analyses using PANTHER. Heatmap shows upregulated signaling pathways targeted by reprogramming factors. See also Table S6.
Figure 7.
Figure 7.. Inhibition of EGFR Signaling Enhances Cardiac Reprogramming
(A) GRN of reprogramming factors and downregulated genes in day 2 AGHMT iCLMs. Each node represents a gene and edges are drawn to all the annotated genes of reprogramming TF peaks. (B) Genes colored in green (GMT), blue (Hand2), or red (Akt1) in (A) were used for GO analyses using PANTHER. Heatmap shows downregulated signaling pathways targeted by reprogramming factors. (C) GRN of downregulated Egfr signaling pathway genes in day 2 AGHMT iCLMs. (D) Gene expression heatmap of all genes from (C). (E) Strategy for testing chemicals on iCLMs during reprogramming. (F) Representative immunocytochemistry images of AGHMT reprogrammed fibroblasts from αMHC-GFP transgenic mice treated with DMSO or the indicated chemicals. Cells were fixed and stained for αMHC-GFP (green), Tnnt2 (red), and DAPI (blue) 7 days after infection. (Bars, 100 μm.) (G) Quantification by flow cytometry of αMHC-GFP+ and Tnnt2+ iCLMs 7 days after treatment with AGHMT and DMSO or the indicated chemicals (n = 3, independent experiments). (*p < 0.05 versus AGHMT+DMSO, **p < 0.01 versus AGHMT+DMSO.) Data are represented as mean ± SD. (H) Quantification of Ca2+ flux-positive MEFs after 10 days of reprogramming using Fluo-4 NW dye (n = 3, independent experiments). (*p < 0.05 versus AGHMT+DMSO, **p < 0.01 versus AGHMT+DMSO). Data are represented as mean ± SD. (I) Quantification of spontaneous beating MEF iCLMs after treatment (n = 3, independent experiments). (*p < 0.05 versus AGHMT+DMSO, **p < 0.01 versus AGHMT+DMSO.) Data are represented as mean ± SD. (J and K) Representative immunocytochemistry images of AGHMT iCLMs from αMHC-GFP transgenic mice treated with Egfr shRNA(J) or Jak2 shRNA(K). Cells were fixed and stained for αMHC-GFP (green), Tnnt2 (red), and Hoechst (blue) 7 days after infection. (Bars, 100 μm.) (L) Quantification of αMHC-GFP+ and Tnnt2+ iCLMs 7 days after infection with AGHMT and the indicated shRNAs by immunocytochemistry (n = 3, independent experiments). (**p < 0.01 versus AGHMT+shLacZ, ***p < 0.0001 versus AGHMT+shLacZ.) Data are represented as mean ± SD. See also Figure S7 and Table S6.

References

    1. Abad M, Hashimoto H, Zhou H, Morales MG, Chen B, Bassel-Duby R, and Olson EN (2017). Notch Inhibition Enhances Cardiac Reprogramming by Increasing MEF2C Transcriptional Activity. Stem Cell Reports 8, 548–560. - PMC - PubMed
    1. Addis RC, Ifkovits JL, Pinto F, Kellam LD, Esteso P, Rentschler S, Christoforou N, Epstein JA, and Gearhart JD (2013). Optimization of direct fibroblast reprogramming to cardiomyocytes using calcium activity as a functional measure of success. J. Mol. Cell. Cardiol. 60, 97–106. - PMC - PubMed
    1. Ang YS, Rivas RN, Ribeiro AJS, Srivas R, Rivera J, Stone NR, Pratt K, Mohamed TMA, Fu JD, Spencer CI, et al. (2016). Disease Model of GATA4 Mutation Reveals Transcription Factor Cooperativity in Human Cardiogenesis. Cell 167, 1734–1749. - PMC - PubMed
    1. Bagwe S, Berenfeld O, Vaidya D, Morley GE, and Jalife J (2005). Altered right atrial excitation and propagation in connexin40 knockout mice. Circulation 112, 2245–2253. - PMC - PubMed
    1. Blow MJ, McCulley DJ, Li Z, Zhang T, Akiyama JA, Holt A, Plajzer-Frick I, Shoukry M, Wright C, Chen F, et al. (2010). ChIP-Seq identification of weakly conserved heart enhancers. Nat. Genet. 42, 806–810. - PMC - PubMed

Publication types