

Measuring viability selection from prospective cohort mortality studies: A case study in maritime pine
- PMID: 31080501
- PMCID: PMC6503825
- DOI: 10.1111/eva.12729
Measuring viability selection from prospective cohort mortality studies: A case study in maritime pine
Abstract
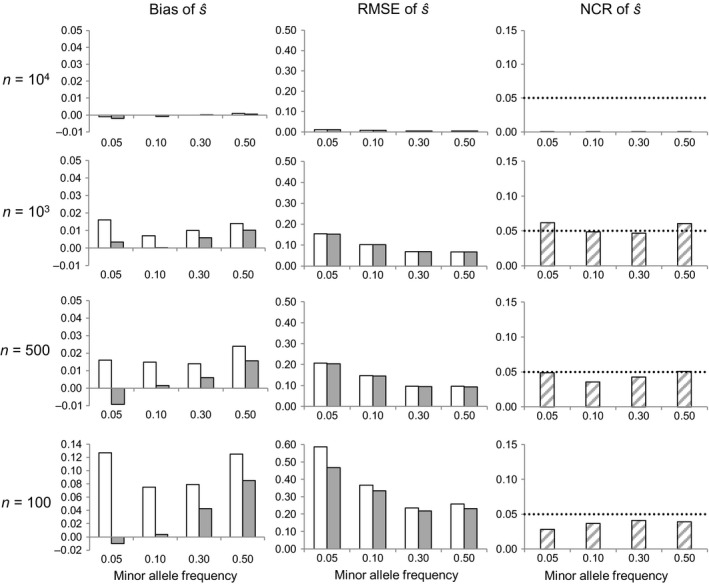
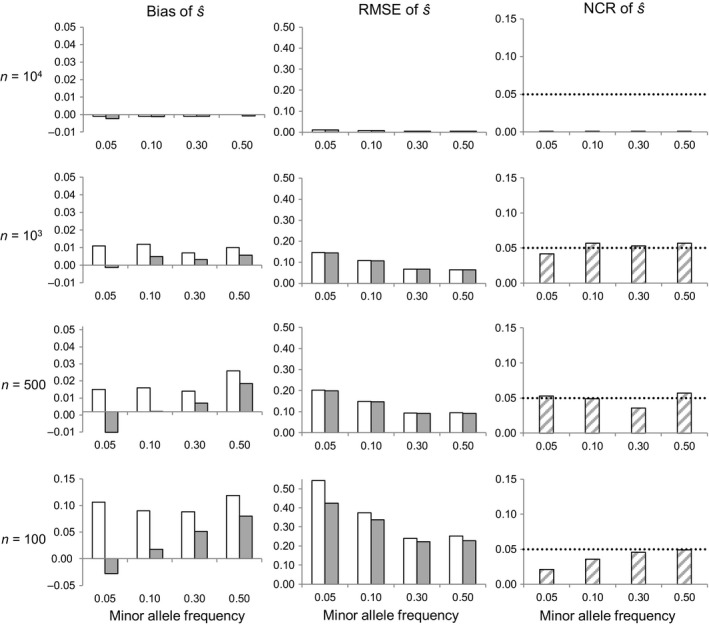
By changing the genetic background available for selection at subsequent life stages, stage-specific selection can define adaptive potential across the life cycle. We propose and evaluate here a neutrality test and a Bayesian method to infer stage-specific viability selection coefficients using sequential random genotypic samples drawn from a longitudinal cohort mortality study, within a generation. The approach is suitable for investigating selective mortality in large natural or experimental cohorts of any organism in which individual tagging and tracking are unfeasible. Numerical simulation results indicate that the method can discriminate loci under strong viability selection, and provided samples are large, yield accurate estimates of the corresponding selection coefficients. Genotypic frequency changes are largely driven by sampling noise under weak selection, however, compromising inference in that case. We apply the proposed methods to analyze viability selection operating at early recruitment stages in a natural maritime pine (Pinus pinaster Ait.) population. We measured temporal genotypic frequency changes at 384 candidate-gene SNP loci among seedlings sampled from the time of emergence in autumn until the summer of the following year, a period with high elimination rates. We detected five loci undergoing allele frequency changes larger than expected from stochastic mortality and sampling, with putative functions that could influence survival at early seedling stages. Our results illustrate how new statistical and sampling schemes can be used to conduct genomic scans of contemporary selection on specific life stages.
Keywords: Pinus pinaster; adaptive conservation management; contemporary adaptation; longitudinal study; neutrality test; selection coefficient; selective mortality.
Conflict of interest statement
None declared.
Figures


Similar articles
-
The role of population origin and microenvironment in seedling emergence and early survival in Mediterranean maritime pine (Pinus pinaster Aiton).PLoS One. 2014 Oct 6;9(10):e109132. doi: 10.1371/journal.pone.0109132. eCollection 2014. PLoS One. 2014. PMID: 25286410 Free PMC article.
-
Environment-dependent microevolution in a Mediterranean pine (Pinus pinaster Aiton).BMC Evol Biol. 2014 Sep 23;14:200. doi: 10.1186/s12862-014-0200-5. BMC Evol Biol. 2014. PMID: 25245540 Free PMC article.
-
Assessing early fitness consequences of exotic gene flow in the wild: a field study with Iberian pine relicts.Evol Appl. 2016 Jan 9;9(2):367-80. doi: 10.1111/eva.12333. eCollection 2016 Feb. Evol Appl. 2016. PMID: 26834830 Free PMC article.
-
Phototropic response induced by wind loading in Maritime pine seedlings (Pinus pinaster Aït.).J Exp Bot. 2005 Mar;56(413):851-6. doi: 10.1093/jxb/eri071. Epub 2005 Feb 7. J Exp Bot. 2005. PMID: 15699065
-
Molecular proxies for climate maladaptation in a long-lived tree (Pinus pinaster Aiton, Pinaceae).Genetics. 2015 Mar;199(3):793-807. doi: 10.1534/genetics.114.173252. Epub 2014 Dec 29. Genetics. 2015. PMID: 25549630 Free PMC article.
Cited by
-
Genomics and adaptation in forest ecosystems.Tree Genet Genomes. 2022;18(2):12. doi: 10.1007/s11295-022-01542-1. Epub 2022 Feb 9. Tree Genet Genomes. 2022. PMID: 35210985 Free PMC article.
References
-
- Benjamini, Y. , & Hochberg, Y. (1995). Controlling the false discovery rate: A practical and powerful approach to multiple testing. Journal of the Royal Statistical Society Series B: Statistical Methodology, 57, 289–300.
Associated data
LinkOut - more resources
Full Text Sources
Other Literature Sources
