

Retrotransposons evolution and impact on lncRNA and protein coding genes in pigs
- PMID: 31080521
- PMCID: PMC6501411
- DOI: 10.1186/s13100-019-0161-8
Retrotransposons evolution and impact on lncRNA and protein coding genes in pigs
Abstract
Background: Retrotransposons are the major determinants of genome sizes and they have shaped both genes and genomes in mammalian organisms, but their overall activity, diversity, and evolution dynamics, particularly their impact on protein coding and lncRNA genes in pigs remain largely unknown.
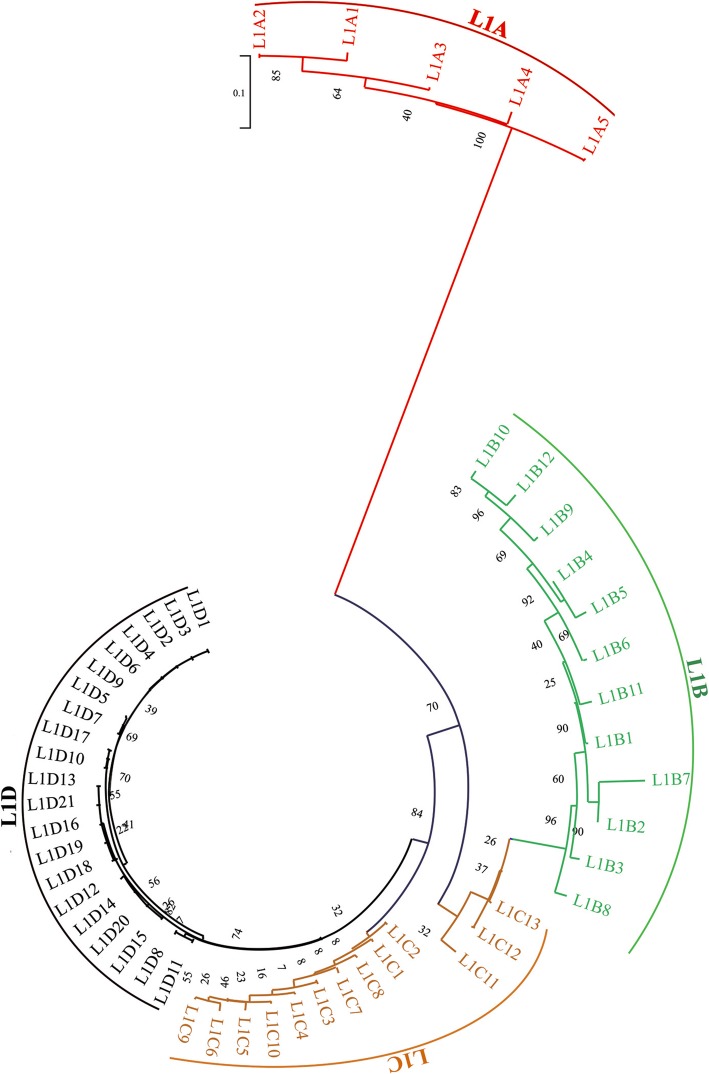
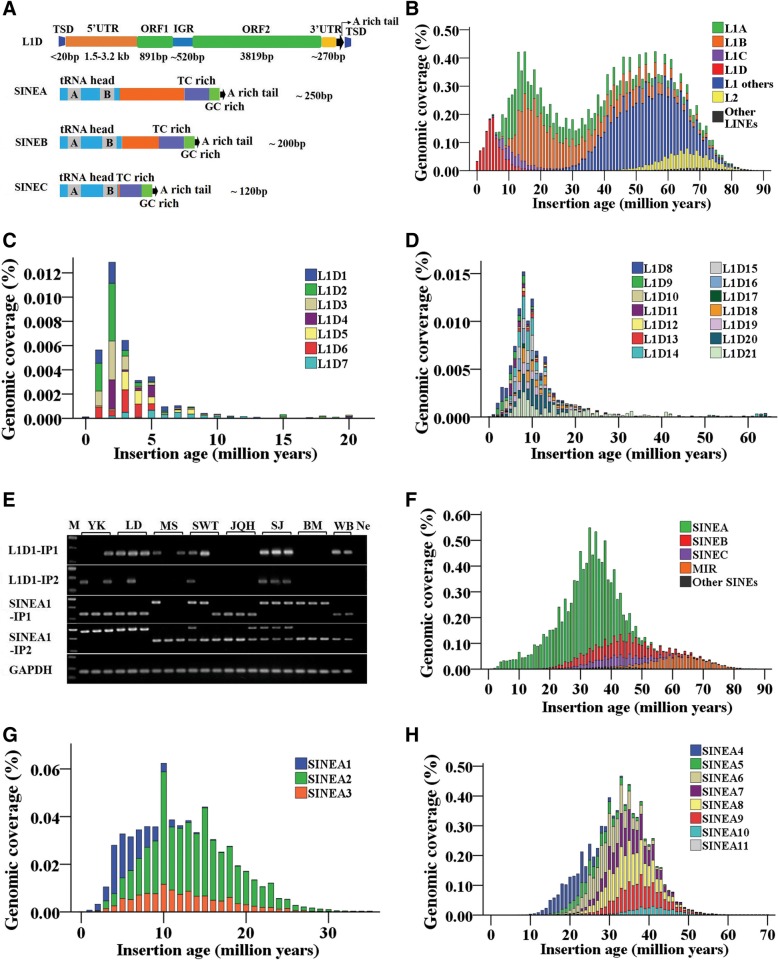
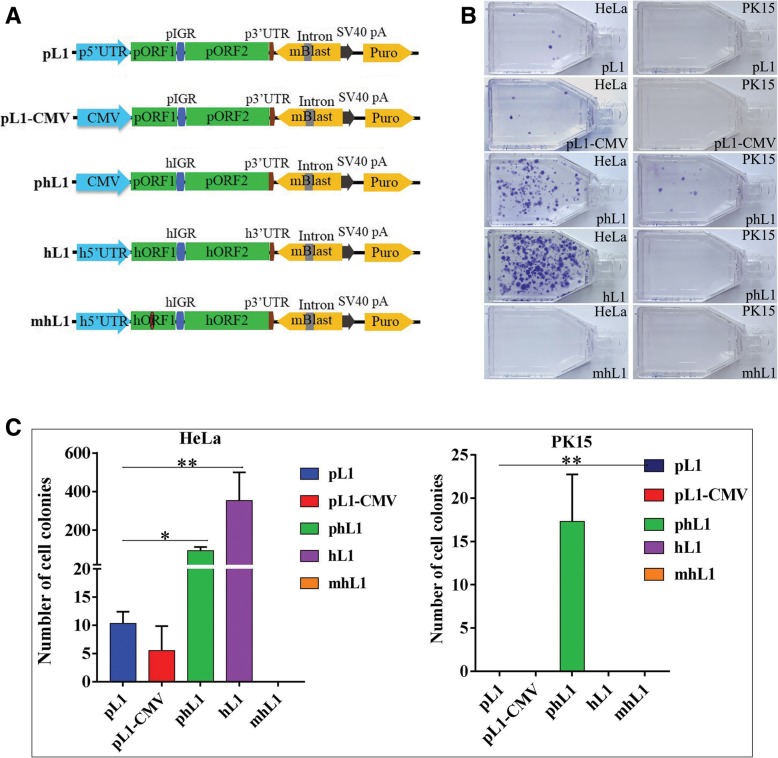
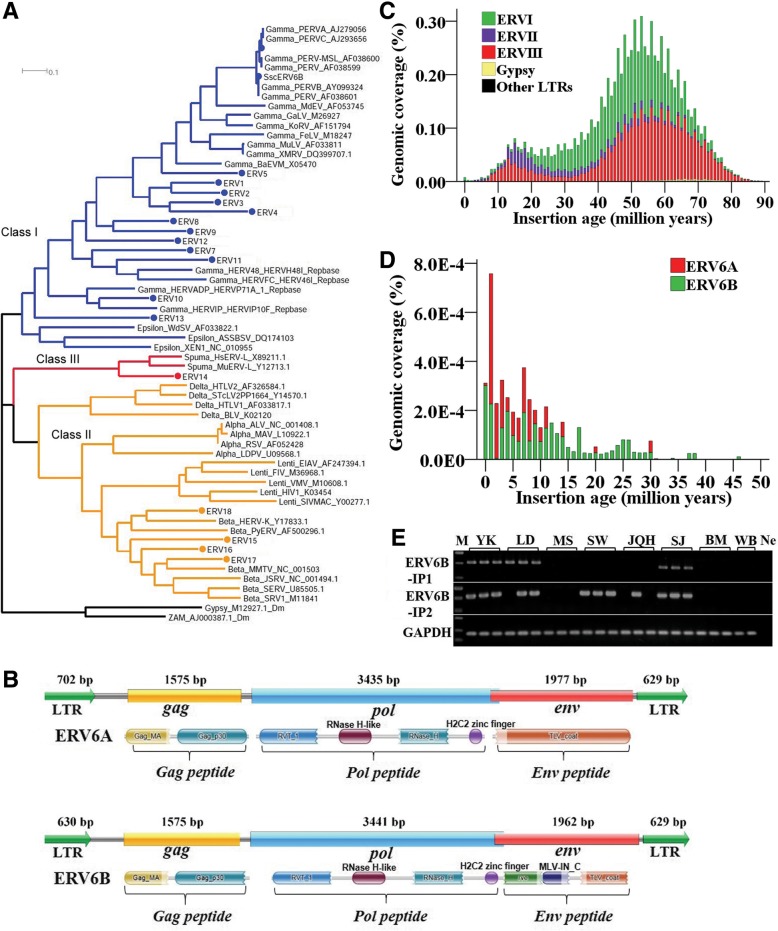
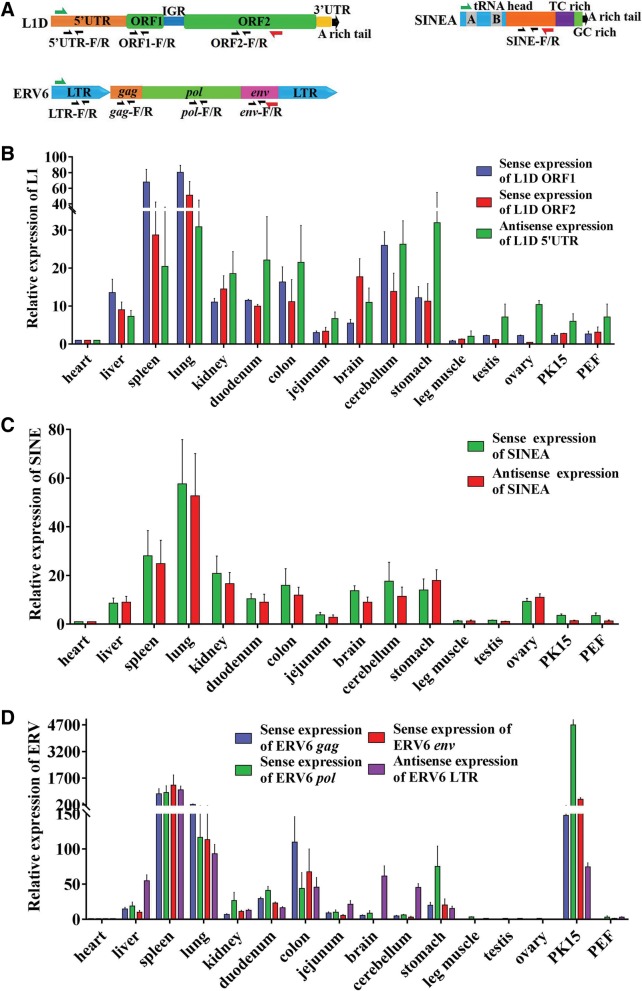
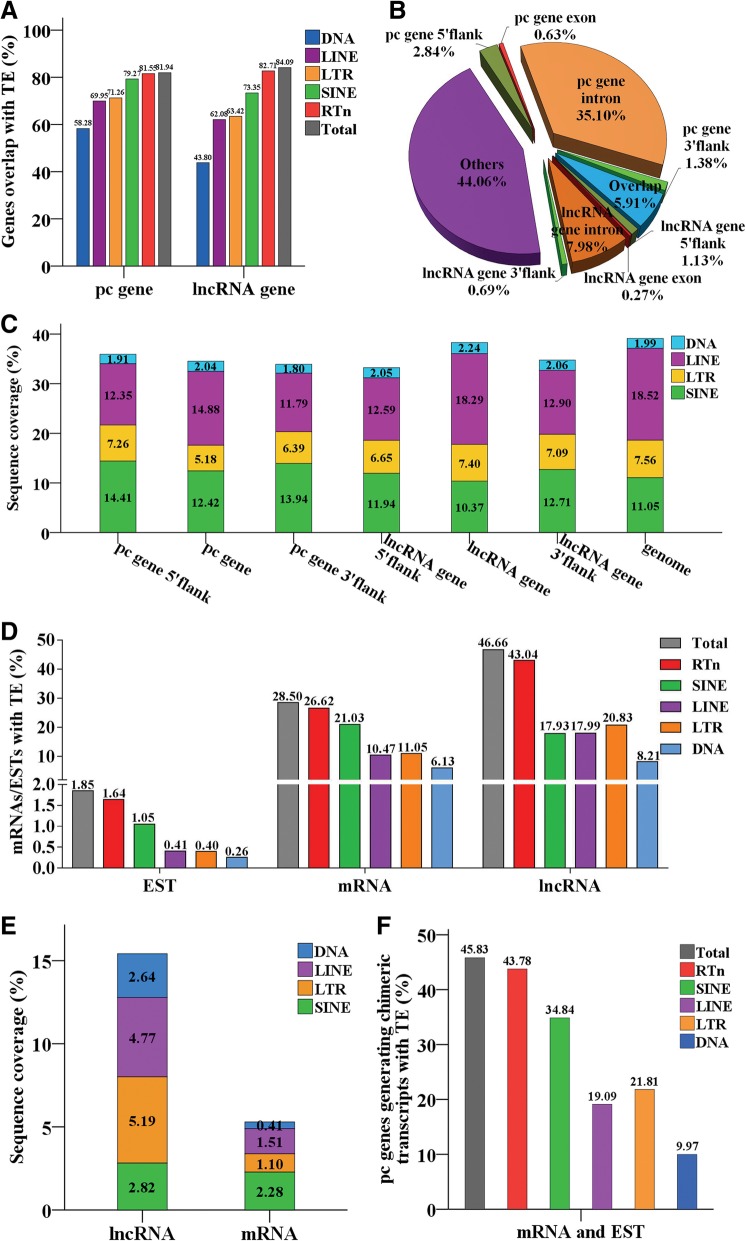
Results: In the present study, we performed de novo detection of retrotransposons in pigs by using multiple pipelines, four distinct families of pig-specific L1 s classified into 51 distinct subfamilies and representing four evolution models and three expansion waves of pig-specific SINEs represented by three distinct families were identified. ERVs were classified into 18 families and found two most "modern" subfamilies in the pig genome. The transposition activity of pig L1 was verified by experiment, the sense and antisense promoter activities of young L1 5'UTRs and ERV LTRs and expression profiles of young retrotransposons in multiple tissues and cell lines were also validated. Furthermore, retrotransposons had an extensive impact on lncRNA and protein coding genes at both the genomic and transcriptomic levels. Most protein coding and lncRNA (> 80%) genes contained retrotransposon insertions, and about half of protein coding genes (44.30%) and one-fourth (24.13%) of lncRNA genes contained the youngest retrotransposon insertions. Nearly half of protein coding genes (43.78%) could generate chimeric transcripts with retrotransposons. Significant distribution bias of retrotransposon composition, location, and orientation in lncRNA and protein coding genes, and their transcripts, were observed.
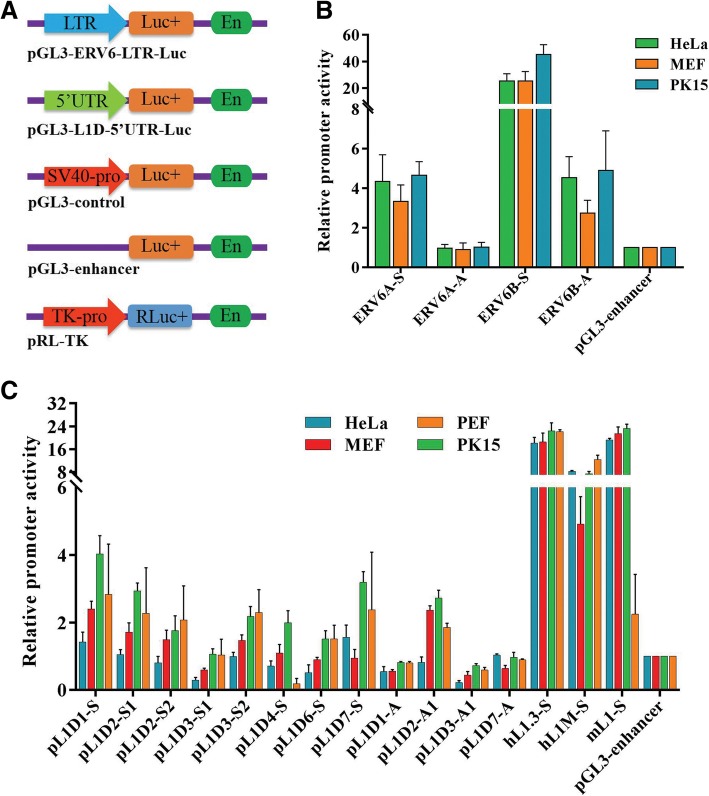
Conclusions: In the current study, we characterized the classification and evolution profile of retrotransposons in pigs, experimentally proved the transposition activity of the young pig L1 subfamily, characterized the sense and antisense expression profiles and promoter activities of young retrotransposons, and investigated their impact on lncRNA and protein coding genes by defining the mobilome landscapes at the genomic and transcriptomic levels. These findings help provide a better understanding of retrotransposon evolution in mammal and their impact on the genome and transcriptome.
Keywords: Distribution bias; Gene overlapping; Pig genome; Promoter activity; Retrotransposition activity; Retrotransposon evolution.
Conflict of interest statement
Animal care and use was approved by the Animal Care and Use Committee of Yangzhou University.Not applicable.The authors declare that they have no competing interests.Springer Nature remains neutral with regard to jurisdictional claims in published maps and institutional affiliations.
Figures
Similar articles
-
Distinct Retrotransposon Evolution Profile in the Genome of Rabbit (Oryctolagus cuniculus).Genome Biol Evol. 2021 Aug 3;13(8):evab168. doi: 10.1093/gbe/evab168. Genome Biol Evol. 2021. PMID: 34270728 Free PMC article.
-
Linear decay of retrotransposon antisense bias across genes is contingent upon tissue specificity.PLoS One. 2013 Nov 14;8(11):e79402. doi: 10.1371/journal.pone.0079402. eCollection 2013. PLoS One. 2013. PMID: 24244495 Free PMC article.
-
A genome-wide study of ruminants uncovers two endogenous retrovirus families recently active in goats.Mob DNA. 2025 Feb 17;16(1):4. doi: 10.1186/s13100-024-00337-6. Mob DNA. 2025. PMID: 39962507 Free PMC article.
-
Retrotransposons: How the continuous evolutionary front shapes plant genomes for response to heat stress.Front Plant Sci. 2022 Dec 9;13:1064847. doi: 10.3389/fpls.2022.1064847. eCollection 2022. Front Plant Sci. 2022. PMID: 36570931 Free PMC article. Review.
-
CTRL+INSERT: retrotransposons and their contribution to regulation and innovation of the transcriptome.EMBO Rep. 2016 Aug;17(8):1131-44. doi: 10.15252/embr.201642743. Epub 2016 Jul 11. EMBO Rep. 2016. PMID: 27402545 Free PMC article. Review.
Cited by
-
Pangenome obtained by long-read sequencing of 11 genomes reveal hidden functional structural variants in pigs.iScience. 2023 Feb 2;26(3):106119. doi: 10.1016/j.isci.2023.106119. eCollection 2023 Mar 17. iScience. 2023. PMID: 36852268 Free PMC article.
-
Genome-wide DNA methylation dynamics during epigenetic reprogramming in the porcine germline.Clin Epigenetics. 2021 Feb 3;13(1):27. doi: 10.1186/s13148-021-01003-x. Clin Epigenetics. 2021. PMID: 33536045 Free PMC article.
-
SINE Insertion May Act as a Repressor to Affect the Expression of Pig LEPROT and Growth Traits.Genes (Basel). 2022 Aug 10;13(8):1422. doi: 10.3390/genes13081422. Genes (Basel). 2022. PMID: 36011333 Free PMC article.
-
SINE Insertion in the Intron of Pig GHR May Decrease Its Expression by Acting as a Repressor.Animals (Basel). 2021 Jun 23;11(7):1871. doi: 10.3390/ani11071871. Animals (Basel). 2021. PMID: 34201672 Free PMC article.
-
A 280 bp SINE insertion within the pig PLA2G16 could potentially modify gene expression through integration with its transcript.J Appl Genet. 2025 Sep;66(3):689-696. doi: 10.1007/s13353-024-00933-5. Epub 2025 Jan 2. J Appl Genet. 2025. PMID: 39745593
References
-
- Kazazian HH. Mobile Elements: Drivers of Genome Evolution. Science. 2004;80:1626–1632. - PubMed
-
- Wicker T, Sabot F, Hua-Van A, Bennetzen JL, Capy P, Chalhoub B, et al. A unified classification system for eukaryotic transposable elements. Nat Rev Genet. 2007;8:973–982. - PubMed
-
- Michael TP. Plant genome size variation: bloating and purging DNA. Brief Funct Genomic Proteomic. 2014;13:308–317. - PubMed
LinkOut - more resources
Full Text Sources
