

Piceatannol markedly upregulates heme oxygenase-1 expression and alleviates oxidative stress in skeletal muscle cells
- PMID: 31080897
- PMCID: PMC6500920
- DOI: 10.1016/j.bbrep.2019.100643
Piceatannol markedly upregulates heme oxygenase-1 expression and alleviates oxidative stress in skeletal muscle cells
Abstract
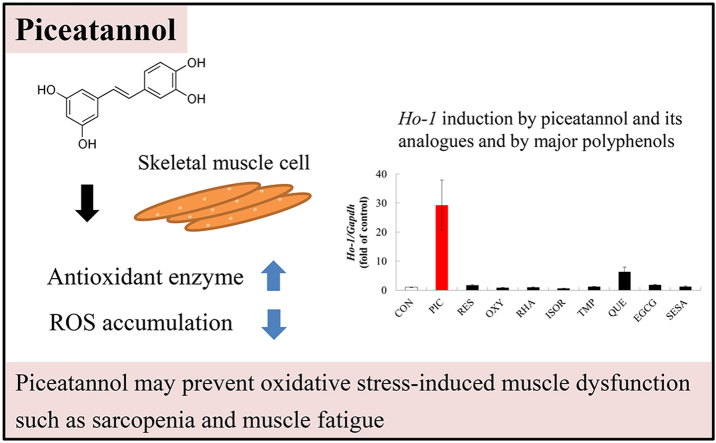
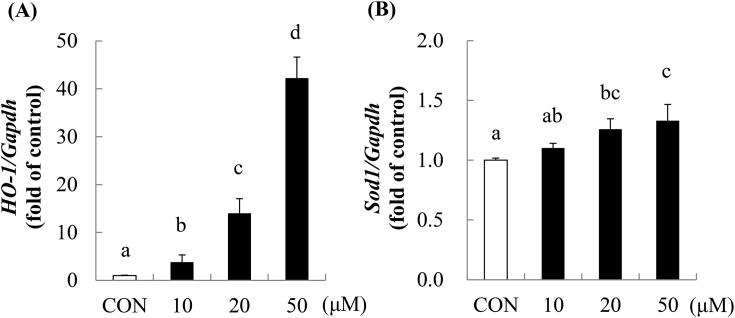
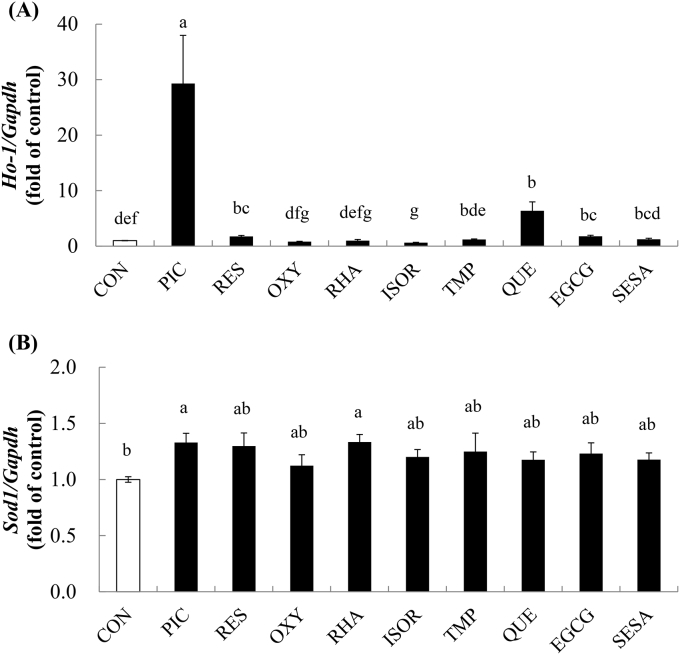
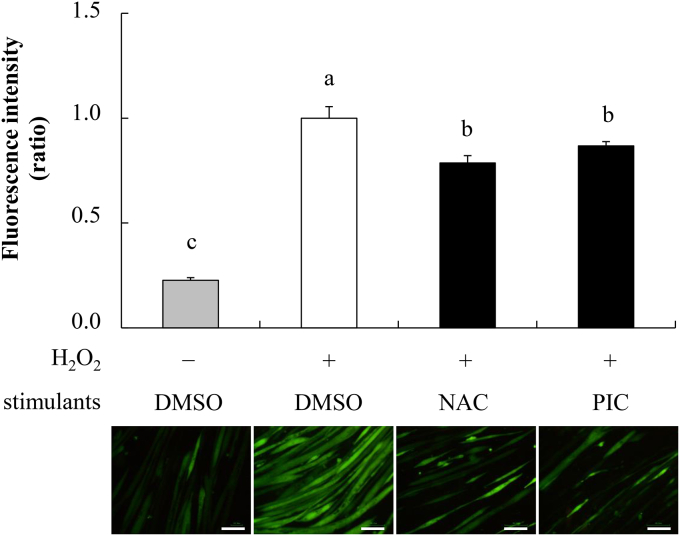
Piceatannol (PIC), a phytochemical, is abundant in passion fruit (Passiflora edulis) seeds. In this study, we investigated the effects of PIC on the expression levels of antioxidant enzymes in C2C12 skeletal muscle cells and compared its effects with those of PIC analogues and polyphenols. We also evaluated its effects on hydrogen peroxide-induced accumulation of reactive oxygen species in C2C12 myotubes. Treatment with PIC led to dose-dependent upregulation of heme oxygenase-1 (Ho-1) and superoxide dismutase 1 (Sod1) mRNA expression in C2C12 myotubes. PIC was the most potent inducer of Ho-1 among the PIC analogues and major polyphenols tested. In addition, treatment with PIC suppressed the hydrogen peroxide-induced increase in intracellular reactive oxygen species levels. Our results suggest that PIC protects skeletal muscles from oxidative stress by activating antioxidant enzymes such as HO-1 and SOD1 and can therefore help prevent oxidative stress-induced muscle dysfunction such as muscle fatigue and sarcopenia.
Keywords: Antioxidant enzymes; HO-1; Oxidative stress; Piceatannol; Skeletal muscle cell.
Figures
Similar articles
-
Piceatannol Upregulates SIRT1 Expression in Skeletal Muscle Cells and in Human Whole Blood: In Vitro Assay and a Randomized, Double-Blind, Placebo-Controlled, Parallel-Group Comparison Trial.Life (Basel). 2024 May 5;14(5):589. doi: 10.3390/life14050589. Life (Basel). 2024. PMID: 38792610 Free PMC article.
-
Piceatannol alleviates inflammation and oxidative stress via modulation of the Nrf2/HO-1 and NF-κB pathways in diabetic cardiomyopathy.Chem Biol Interact. 2019 Sep 1;310:108754. doi: 10.1016/j.cbi.2019.108754. Epub 2019 Jul 16. Chem Biol Interact. 2019. PMID: 31323227
-
Piceatannol attenuates homocysteine-induced endoplasmic reticulum stress and endothelial cell damage via heme oxygenase-1 expression.Amino Acids. 2017 Apr;49(4):735-745. doi: 10.1007/s00726-016-2375-0. Epub 2016 Dec 20. Amino Acids. 2017. PMID: 27995330
-
The protective effects of piceatannol from passion fruit (Passiflora edulis) seeds in UVB-irradiated keratinocytes.Biol Pharm Bull. 2013;36(5):845-9. doi: 10.1248/bpb.b12-00708. Biol Pharm Bull. 2013. PMID: 23649341
-
Cardiovascular Protective Effects of Polyphenols Contained in Passion Fruit Seeds Namely Piceatannol and Scirpusin B: A Review.Tokai J Exp Clin Med. 2021 Sep 20;46(3):151-161. Tokai J Exp Clin Med. 2021. PMID: 34498252 Review.
Cited by
-
Therapeutic strategies to modulate gut microbial health: Approaches for sarcopenia management.Histol Histopathol. 2024 Nov;39(11):1395-1425. doi: 10.14670/HH-18-730. Epub 2024 Mar 6. Histol Histopathol. 2024. PMID: 38497338 Review.
-
Piceatannol enhances hyaluronic acid synthesis through SIRT1-Mediated HAS2 upregulation in human dermal fibroblasts.Biochem Biophys Rep. 2024 Jun 4;39:101746. doi: 10.1016/j.bbrep.2024.101746. eCollection 2024 Sep. Biochem Biophys Rep. 2024. PMID: 38910870 Free PMC article.
-
Piceatannol Ameliorates Hepatic Oxidative Damage and Mitochondrial Dysfunction of Weaned Piglets Challenged with Diquat.Animals (Basel). 2020 Jul 21;10(7):1239. doi: 10.3390/ani10071239. Animals (Basel). 2020. PMID: 32708214 Free PMC article.
-
Piceatannol Upregulates SIRT1 Expression in Skeletal Muscle Cells and in Human Whole Blood: In Vitro Assay and a Randomized, Double-Blind, Placebo-Controlled, Parallel-Group Comparison Trial.Life (Basel). 2024 May 5;14(5):589. doi: 10.3390/life14050589. Life (Basel). 2024. PMID: 38792610 Free PMC article.
References
-
- Jackson M.J. Redox regulation of skeletal muscle. IUBMB Life. 2008;60:497–501. - PubMed
-
- Merry T.L., McConell G.K. Skeletal muscle glucose uptake during exercise: a focus on reactive oxygen species and nitric oxide signaling. IUBMB Life. 2009;61:479–484. - PubMed
-
- Fulle S., Protasi F., Di Tano G., Pietrangelo T., Beltramin A., Boncompagni S., Vecchiet L., Fano G. The contribution of reactive oxygen species to sarcopenia and muscle ageing. Exp. Gerontol. 2004;39:17–24. - PubMed
-
- Kensler T.W., Wakabayashi N., Biswal S. Cell survival responses to environmental stresses via the Keap1-Nrf2-ARE pathway. Annu. Rev. Pharmacol. Toxicol. 2007;47:89–116. - PubMed
LinkOut - more resources
Full Text Sources
Miscellaneous
